What is an Electric Power Retail Office & Service Center Efficiency Dashboard?
An Electric Power Retail Office & Service Center Efficiency Dashboard is a performance monitoring system used by retail utilities to track facility operations, workplace utilization, and service center readiness across offices, billing centers, and customer service hubs. It serves as an electric power service center dashboard, combining energy usage, downtime, maintenance compliance, and space productivity metrics into a single view. This dashboard helps retail utilities improve service productivity and reduce facility cost leakage through data-driven operational decisions. It also supports daily planning by showing where downtime, backlog, or inefficient energy intensity is impacting customer-facing performance.
How to Create an Electric Power Retail Office & Service Center Efficiency Dashboard
You don’t need to build your report from scratch, just start with a ready-to-use dashboard template from Mokkup. Add in your data and export it however you like. Here’s how to do it:
1. Create or Log in to Your Mokkup Account
Start by signing up on Mokkup.ai using your email. If you already have an account, just log in, and you’ll be good to go.
2. Choose and Customize Your Dashboard Template
Find the Electric Power Retail Office & Service Center Efficiency Dashboard template in the Templates section. Use the drag-and-drop editor to adjust KPIs, edit filters, or add elements based on your data.
3. Export to Your BI Tool
Once your dashboard wireframe is ready, use the BI Tool Export feature to send it directly to Power BI or Tableau for further analysis and enhancements. You can also download the dashboard as a PDF, PNG, or JPEG, embed it on a platform, or invite your team to collaborate.
Note: This is a Pro template. You’ll need a Pro subscription on Mokkup to use and customize this dashboard wireframe. Upgrade anytime to unlock full access.
Electric Power Retail Office & Service Center Efficiency Dashboard Example
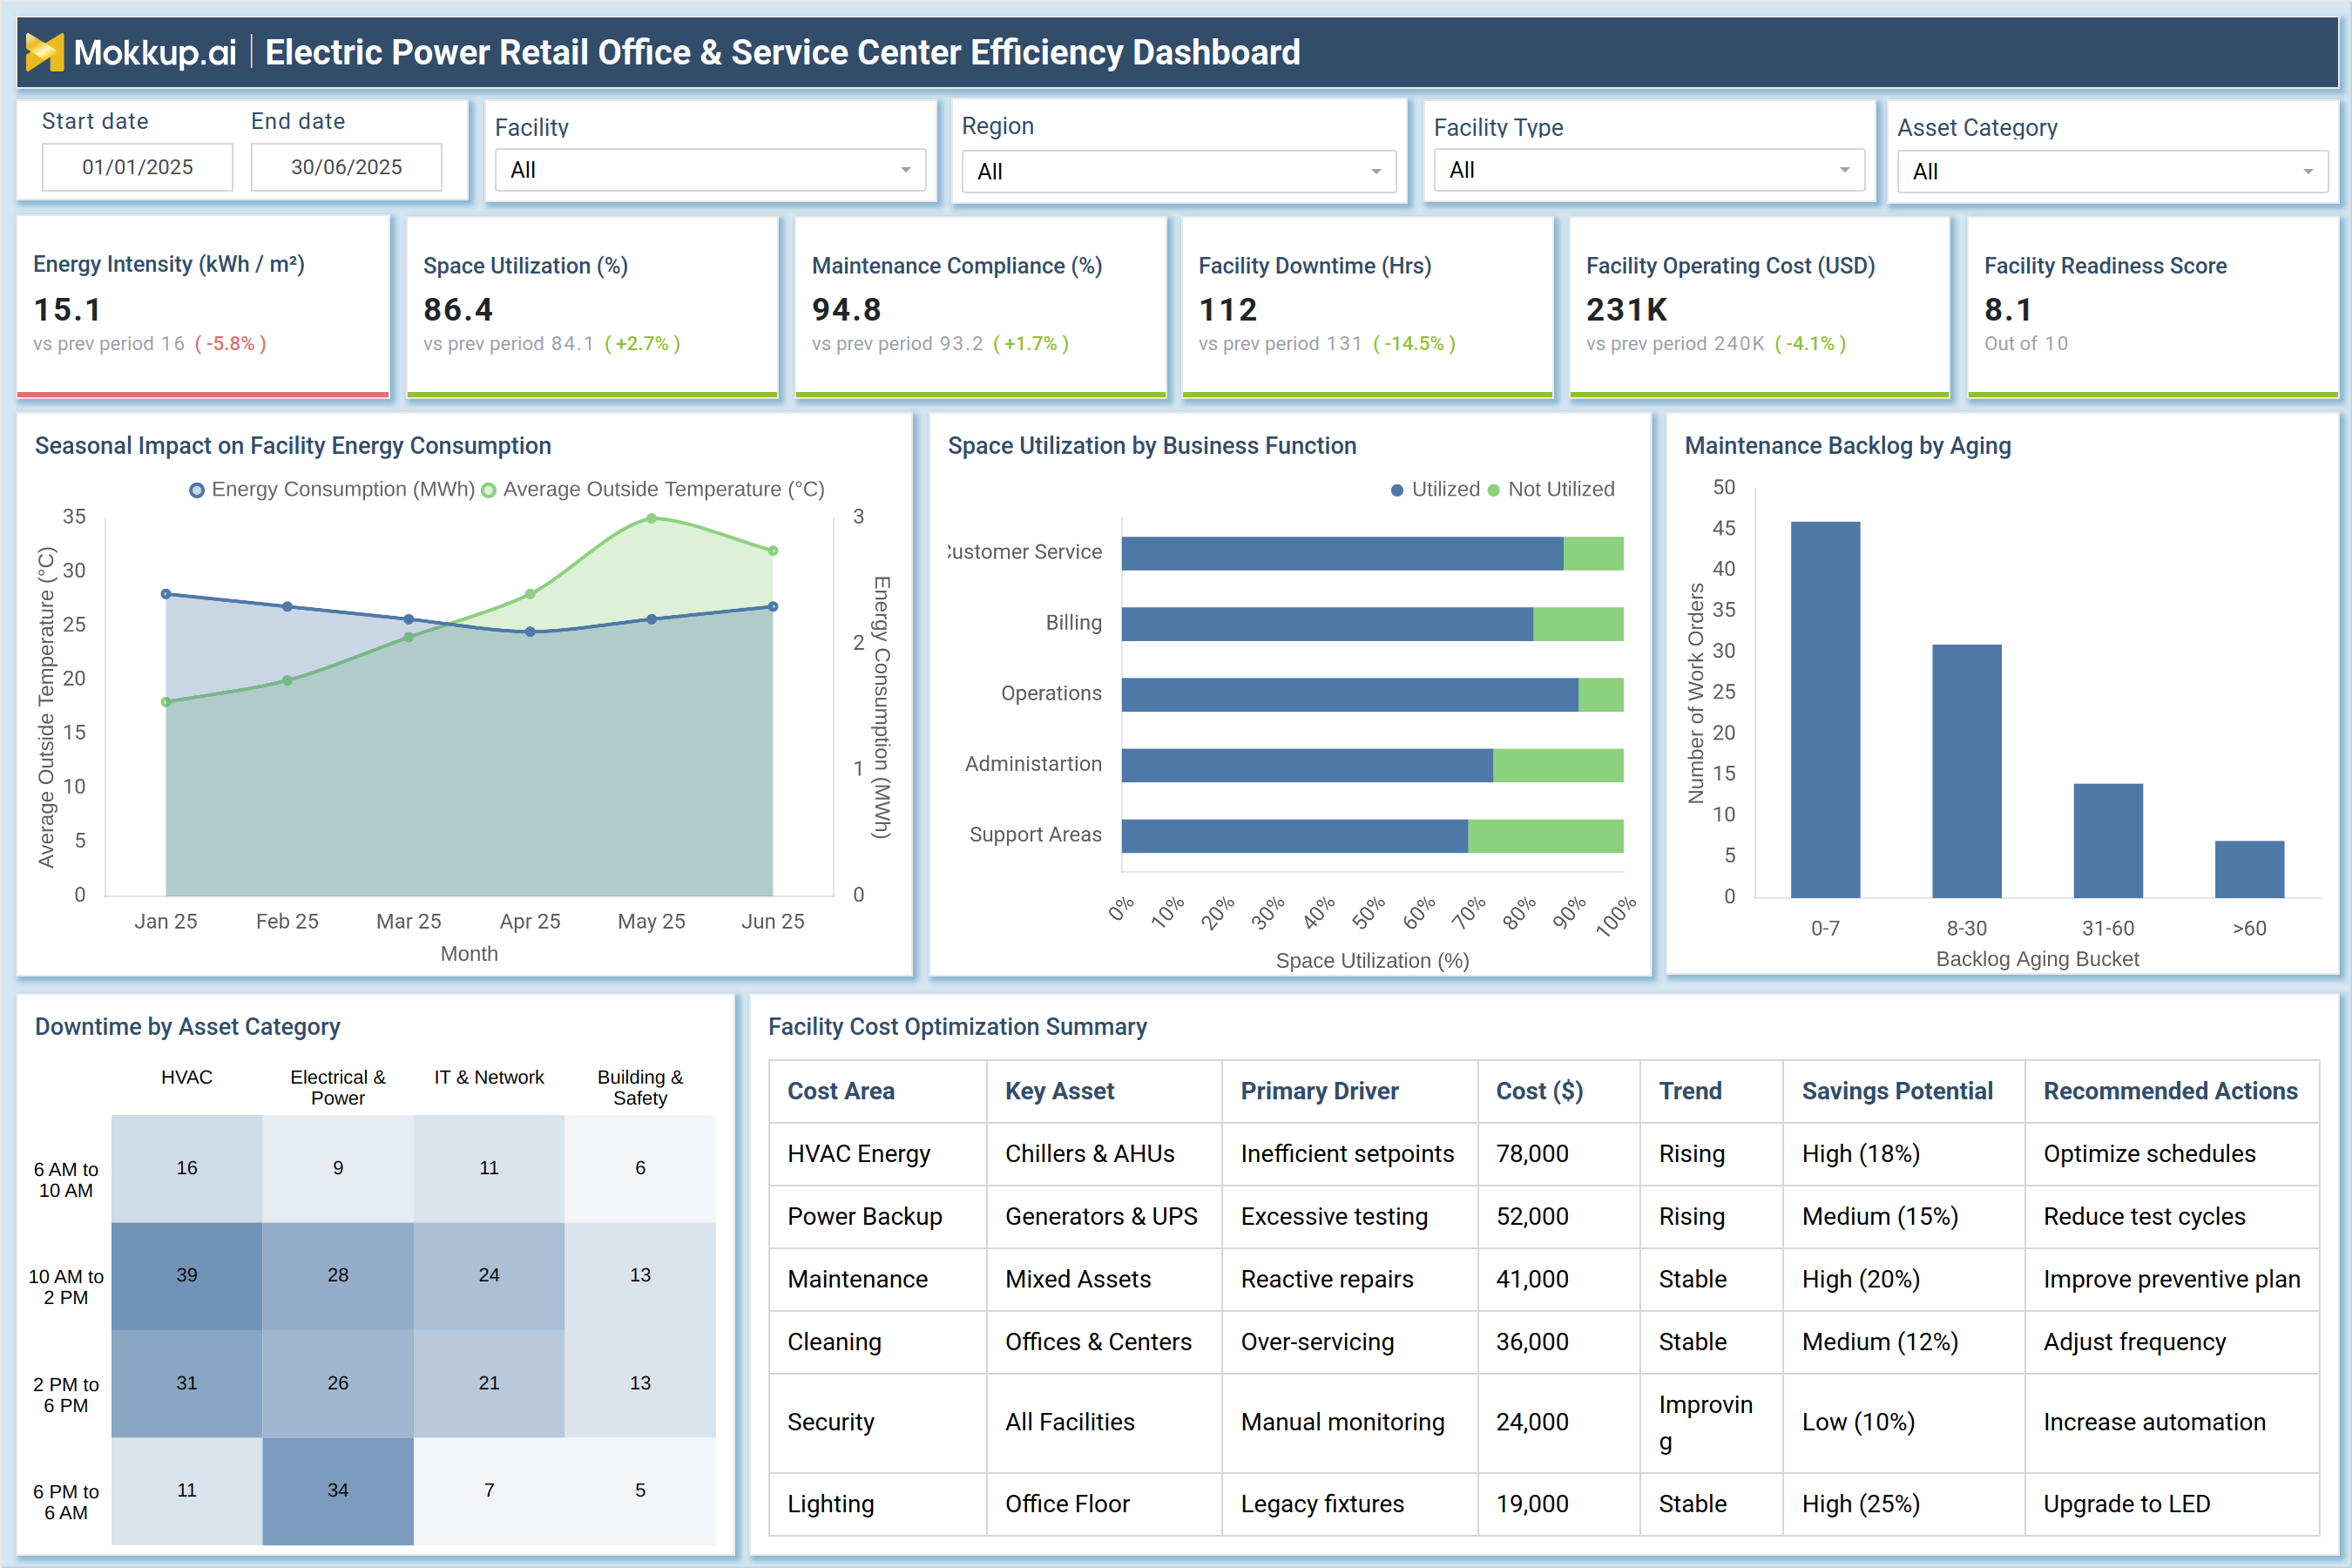
This dashboard example provides a complete retail utility office efficiency dashboard across time period, facility, region, and asset category filters. KPI tiles highlight Energy Intensity, Space Utilization, Maintenance Compliance, Facility Downtime, Facility Operating Cost, and a Facility Readiness Score to measure overall operational health. The visuals illustrate the impact of seasonal facility energy consumption, space utilization by business function, and maintenance backlog aging, helping service leaders connect facility performance with frontline service productivity. A downtime heatmap helps identify peak disruption windows by asset category (HVAC, IT, Electrical/Power), while the facility cost optimization summary table flags cost drivers and recommended corrective actions. This structure delivers actionable energy retail service center analytics to reduce downtime, optimize space, and improve service reliability.
How to Analyze Data in Electric Power Retail Office & Service Center Efficiency Dashboard
Here is how you can analyze data from this dashboard:
- Monitor Energy Intensity (kWh/m²): Assess whether offices are consuming more power than expected for their floor area and identify potential energy inefficiencies.
- Validate Space Utilization: Check if workspaces, especially Admin and Support areas, are underused and carrying excess capacity.
- Check Maintenance Compliance: Ensure the planned maintenance completion rate remains consistently above the target threshold.
- Review Facility Downtime (hrs): Track downtime trends, as higher downtime directly reduces service capacity and impacts customer walk-in experience.
- Analyze Downtime Heatmap: Identify peak disruption hours and correlate them with asset categories such as HVAC or IT & Network.
- Track Maintenance Backlog Aging: Monitor work orders pending for 30+ days, as higher aging indicates increased risk of breakdowns and repeat disruptions.
- Evaluate Space Utilization by Business Function: Confirm that Customer Service and Billing areas show higher utilization than non-core functions.
- Study Operating Cost Trends: Compare cost increases against savings opportunities and investigate root causes using the cost optimization table.
- Prioritize Recommended Actions: Start with high savings-potential initiatives such as HVAC scheduling optimization and LED upgrades.
- Link Facility Readiness Score: Use this as a final indicator of overall service hub preparedness and operational efficiency.
Benefits of Electric Power Retail Office & Service Center Efficiency Dashboard
The following are the benefits of using this dashboard:
- Improve Facility & Service Hub Productivity: Use power retail service productivity analytics to identify efficiency gaps and optimize daily operations.
- Reduce Avoidable Facility Costs: Lower energy, maintenance, and cleaning expenses through targeted optimization initiatives.
- Strengthen Uptime & Service Continuity: Minimize service interruptions in customer-facing centers by proactively addressing downtime drivers.
- Support Smarter Asset Planning: Analyze downtime patterns by asset category to guide replacement, upgrade, and maintenance strategies.
- Manage Preventive Maintenance Performance: Track completion rates and backlog closure to maintain strong maintenance discipline.
- Optimize Space Planning: Identify underutilized functions and floor areas to improve workspace allocation.
- Enhance Customer Experience Indirectly: Improve operational readiness so service teams can deliver faster, smoother customer interactions.
- Standardize Multi-Region Reporting: Create consistent performance views across facilities and geographies.
- Track Operational Risks Early: Give leadership visibility into emerging risks before service performance declines.
- Strengthen Compliance & Governance: Ensure consistent maintenance execution aligned with defined standards and policies.
KPIs to Track in Electric Power Retail Office & Service Center Efficiency Dashboard
The following key KPIs can be tracked by using this dashboard:
- Energy Intensity (kWh/m²): Measures facility energy consumption efficiency per square meter.
- Space Utilization (%): Tracks how effectively office and service center workspace capacity is being used.
- Maintenance Compliance: Measures the percentage of scheduled maintenance completed on time.
- Facility Downtime (hrs): Tracks total operational downtime caused by asset issues or facility disruptions.
- Facility Operating Cost (USD): Measures total facility operating expenditure for the selected period.
- Facility Readiness Score (0–10): A composite readiness index based on uptime, maintenance adherence, and operational stability.
- Maintenance Backlog Aging (work orders): Tracks open maintenance tasks by aging bucket (0–7, 8–30, 31–60, 60+).
- Downtime by Asset Category (hrs): Measures downtime contribution by HVAC, IT & Network, Electrical & Power, Building Safety.
- Space Utilization by Business Function: Tracks usage efficiency across Customer Service, Billing, Operations, Admin, Support.
- Cost Savings Potential: Estimates savings opportunity for each cost category based on drivers and trends.
- Customer Service Facility Stability Index (derived): Tracks whether facility disruptions are impacting service operations.
- Electric Utility Customer Service KPI Impact (derived): Measures operational readiness impact on service delivery performance.
Frequently Asked Questions
1. Who should use this dashboard in retail utilities?
Facility managers, operations heads, service center managers, and retail utility leadership can use it for efficiency, cost control, and readiness monitoring.
2. Why is facility downtime important for retail power utilities?
Because downtime reduces service capacity, affects walk-in experience, and can delay billing, payment processing, and request handling.
3. How does this help improve customer service KPIs?
By improving facility readiness, reducing disruption frequency, and ensuring customer service areas have consistent uptime and stable operations.