
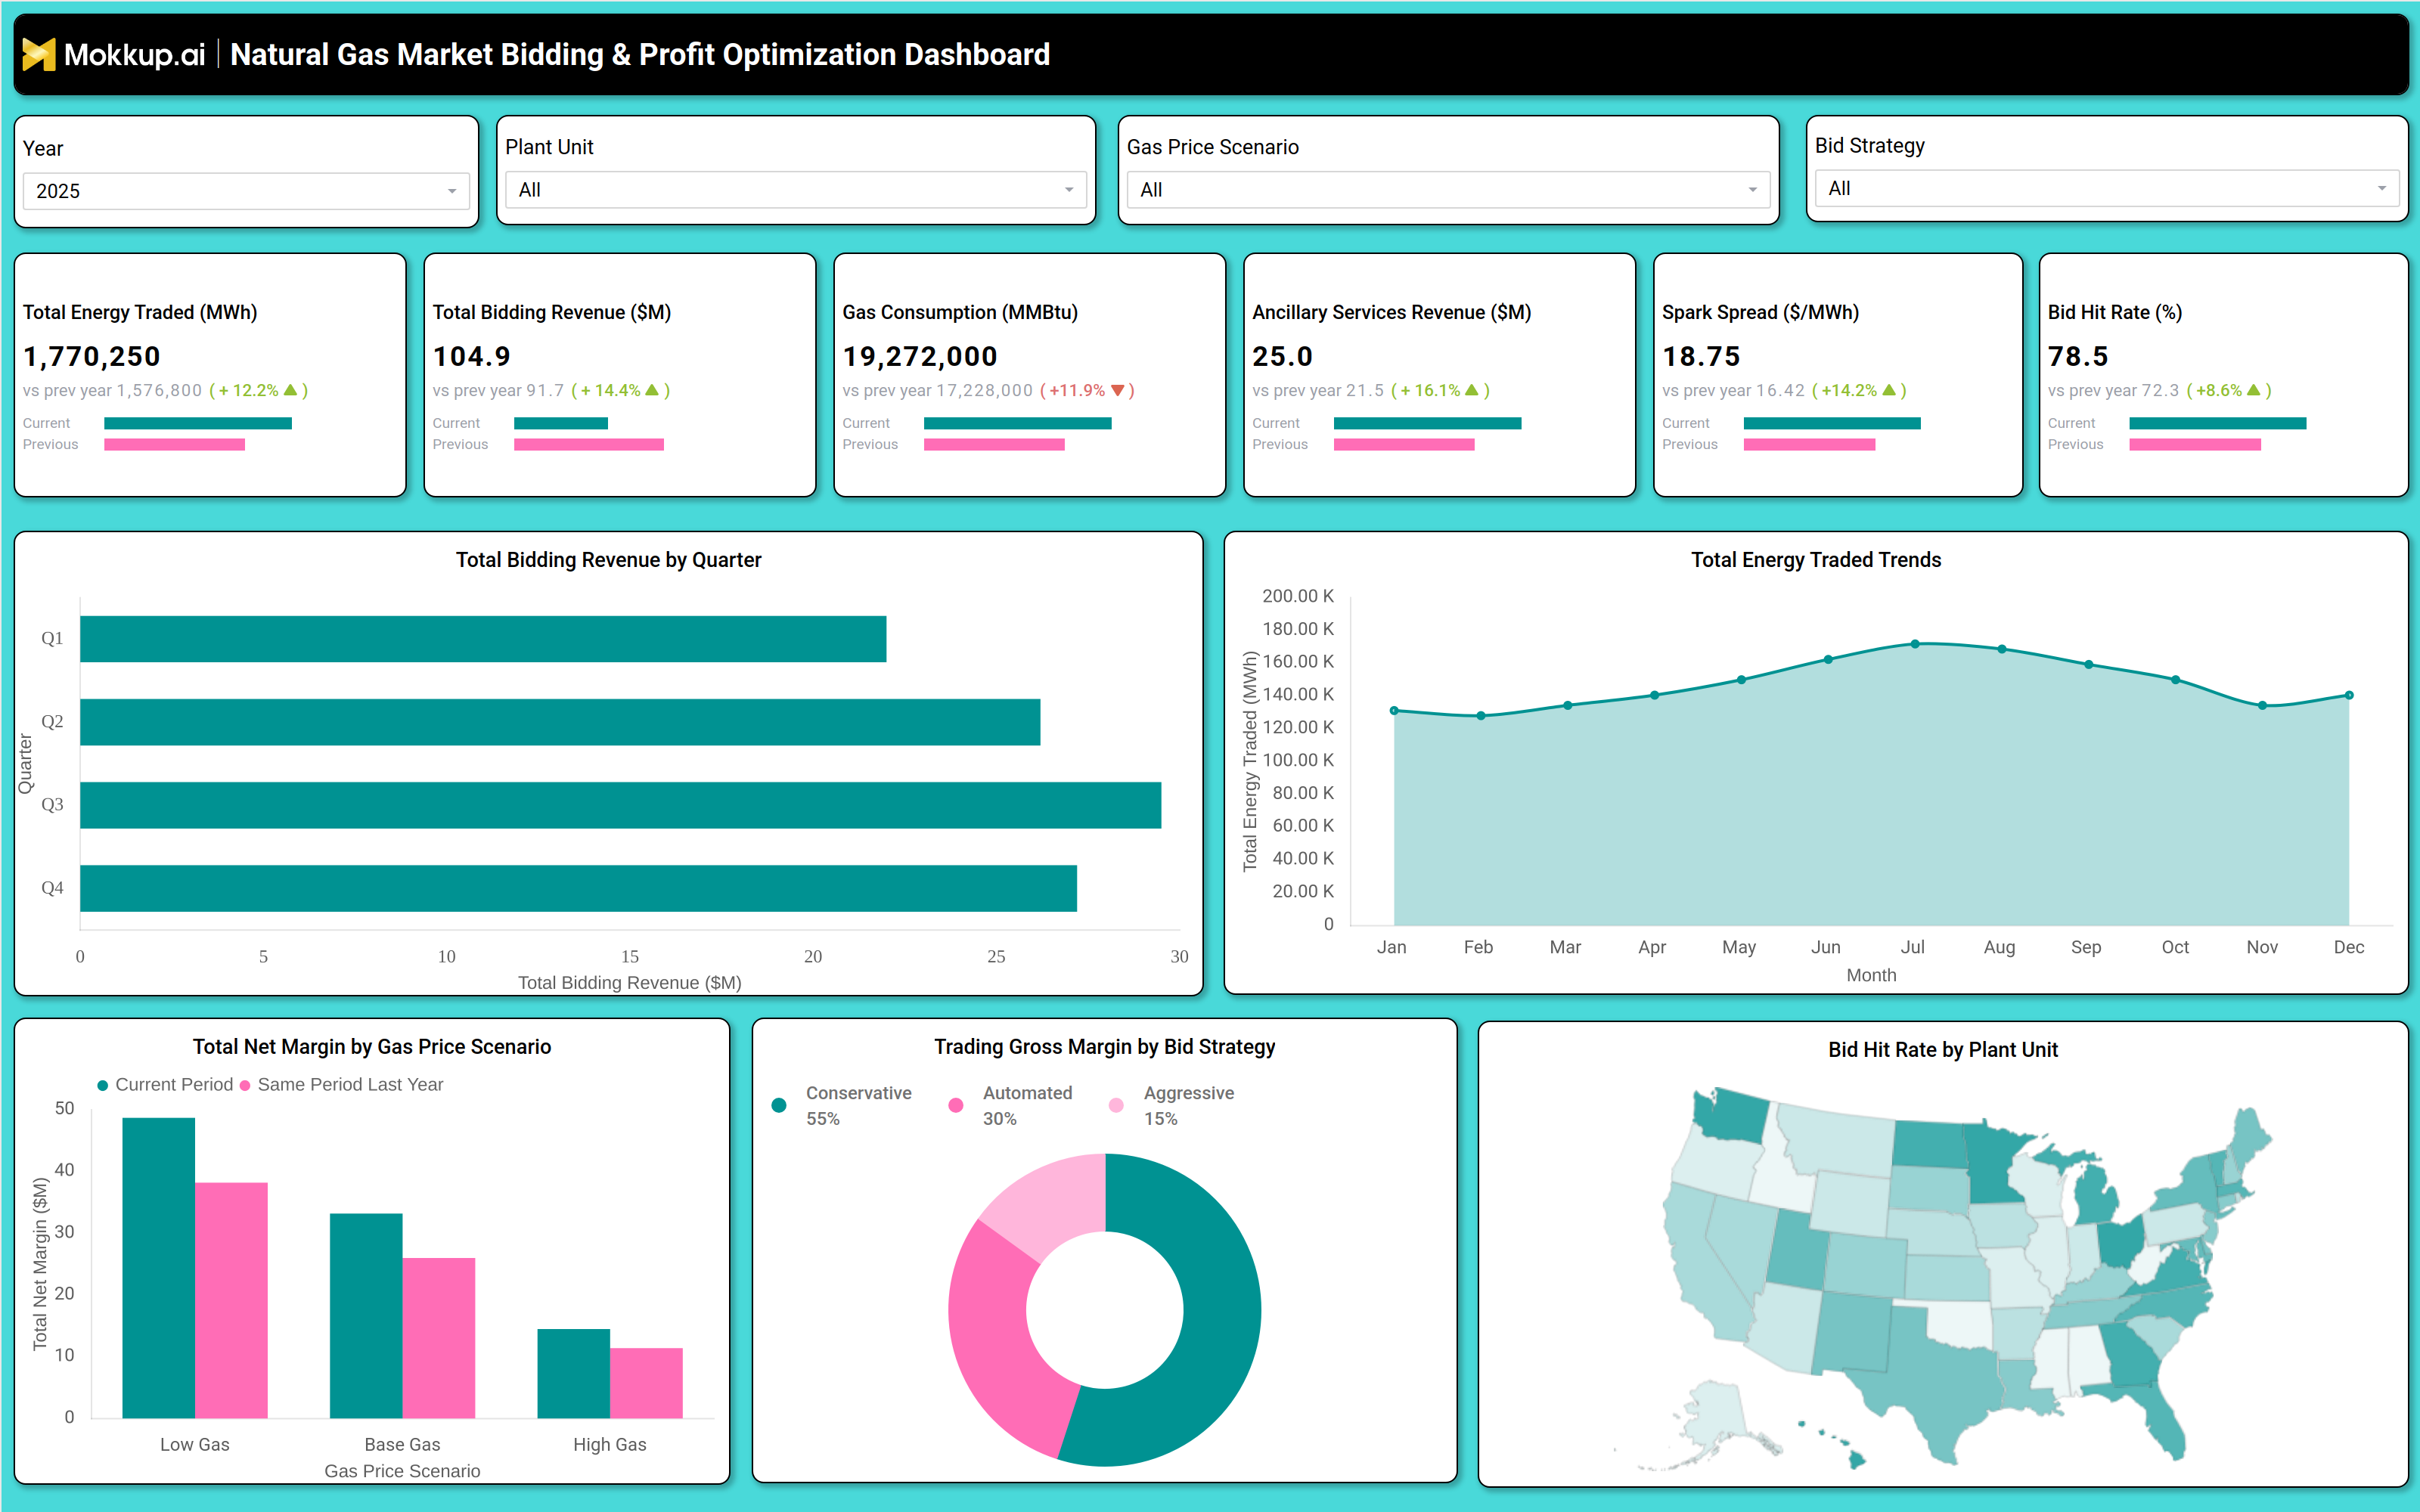
What is a Natural Gas Market Bidding & Profit Optimization Dashboard?
A natural gas market bidding & profit optimization dashboard is a specialized analytics platform designed for electric utilities and power generators to maximize revenue from natural gas-fired power plants. This dashboard integrates energy trading data, gas price forecasting, bid strategy performance, and profitability metrics into a single interface. It helps operators analyze total energy traded, bidding revenue, gas consumption, ancillary services revenue, spark spread, and bid hit rates to refine bidding strategies. By tracking gas price scenarios, plant unit performance, and market trends, utilities can optimize bids for day-ahead and intraday. The dashboard also compares current performance against historical data, enabling decisions to improve profit margins, operational efficiency, and market competitiveness.
How to Create a Natural Gas Market Bidding & Profit Optimization Dashboard
You don't need to build your report from scratch, just start with a ready-to-use dashboard template from Mokkup. Add in your data and export it however you like. Here's how to do it:
1. Create or Log in to Your Mokkup Account
Start by signing up on Mokkup.ai using your email. If you already have an account, just log in, and you'll be good to go.
2. Choose and Customize Your Dashboard Template
Find the Natural Gas Market Bidding & Profit Optimization Dashboard template in the Templates section. Use the drag-and-drop editor to adjust KPIs, edit filters, or add elements based on your data.
3. Export to Your BI Tool
Once your dashboard wireframe is ready, use the BI Tool Export feature to send it directly to Power BI or Tableau for further analysis and enhancements. You can also download the dashboard as a PDF, PNG, or JPEG, embed it on a platform, or invite your team to collaborate.
Note: This is a Pro template. You'll need a Pro subscription on Mokkup to use and customize this dashboard wireframe. Upgrade anytime to unlock full access.
Natural Gas Market Bidding & Profit Optimization Dashboard Example
A well-structured natural gas market bidding & profit optimization dashboard includes interactive filters for year, plant unit, gas price scenario, and bid strategy. Key performance tiles display total energy traded (MWh), total bidding revenue ($M), gas consumption (MMBtu), ancillary services revenue ($M), spark spread ($/MWh), and bid hit rate. Trend charts show quarterly bidding revenue, monthly energy traded, and net margin by gas price scenario. A trading gross margin breakdown by bid strategy (conservative, automated, aggressive) helps operators assess which approach yields the highest returns. A geographic heatmap visualizes bid hit rates by plant location, while comparative bar charts highlight performance differences between current and previous periods. Together, these components provide a comprehensive view of market positioning, profitability, and bidding efficiency for gas-fired power plants.
How to Analyze Data in a Natural Gas Market Bidding & Profit Optimization Dashboard
Here is how you can analyze data from this spark spread monitoring dashboard:
- Total Energy Traded (MWh) – Review energy trading volumes to assess market participation levels, identify volume trends, and evaluate overall trading activity.
- Total Bidding Revenue ($M) – Compare bidding revenue against previous periods to measure financial performance, revenue growth, and the effectiveness of trading strategies.
- Gas Consumption (MMBtu) – Monitor fuel consumption to optimize fuel efficiency, control operating costs, and improve power generation profitability.
- Ancillary Services Revenue ($M) – Track revenue generated from ancillary services to identify additional income streams and maximize market opportunities.
- Spark Spread ($/MWh) – Analyze the difference between electricity prices and fuel costs to evaluate profitability margins and support trading decisions.
- Bid Hit Rate (%) – Measure the percentage of successful bids to assess bidding strategy effectiveness and improve market competitiveness.
- Net Margin by Gas Price Scenario – Compare net margins under different gas price conditions to understand risk exposure and evaluate profitability across market scenarios.
- Trading Gross Margin by Bid Strategy – Break down gross margins by bidding approach to identify the most profitable strategies and refine future bidding decisions.
- Geographic Performance Heatmaps – Use location-based visualizations to identify high-performing plant units, regional opportunities, and operational performance variations.
- Historical Performance Benchmarking – Compare current trading and operational metrics against historical performance to detect trends, uncover anomalies, and support continuous improvement.
Benefits of a Natural Gas Market Bidding & Profit Optimization Dashboard
The following are the benefits of using this compression cost tracking dashboard:
- Enhanced Bidding Strategy Accuracy – Leverage data-driven market insights to improve bidding decisions, increase bid success rates, and maximize trading performance.
- Improved Fuel Cost Efficiency – Monitor gas consumption and fuel utilization trends to optimize operating costs and enhance generation profitability.
- Increased Ancillary Services Revenue – Identify and capitalize on profitable ancillary service opportunities to diversify revenue streams and improve financial returns.
- Reduced Financial Risk – Analyze performance under different gas price scenarios to assess market exposure, mitigate risks, and strengthen financial planning.
- Boosted Operational Efficiency – Refine bidding strategies using performance analytics to improve resource utilization and maximize operational effectiveness.
- Enhanced Regulatory Compliance – Maintain transparent and auditable bidding data to support compliance with market regulations and reporting requirements.
- Faster Data-Driven Decision-Making – Provide real-time performance visibility and actionable insights that enable quicker, more informed operational and trading decisions.
KPIs to Track in a Natural Gas Market Bidding & Profit Optimization Dashboard
The following key KPIs can be tracked by using this profit optimization dashboard for power plants:
- Total Energy Traded (MWh): Measures the volume of electricity sold in the market.
- Total Bidding Revenue ($M): Tracks revenue generated from energy bids.
- Gas Consumption (MMBtu): Monitors natural gas usage for power generation.
- Ancillary Services Revenue ($M): Tracks earnings from grid support services.
- Spark Spread ($/MWh): Calculates profitability by comparing gas and electricity prices.
- Bid Hit Rate (%): Measures the success rate of submitted bids.
- Net Margin by Gas Price Scenario ($M): Assesses profitability under different market conditions.
- Trading Gross Margin by Bid Strategy (%): Evaluates performance across conservative, automated, and aggressive bidding approaches.
Frequently Asked Questions
1. What is a bid hit rate dashboard used for?
It helps power generators optimize bids, maximize revenue, and improve profitability in energy markets.
2. What data sources feed this natural gas bidding dashboard?
Energy trading platforms, gas price forecasts, plant performance data, and market bidding systems.
3. Who should use an energy trading analytics dashboard?
Energy traders, power plant operators, utility managers, and financial analysts in gas-fired power generation.