What is a Fleet Fuel Efficiency & Consumption Tracking Dashboard?
A fleet fuel efficiency and consumption tracking dashboard is a centralized analytics tool designed to monitor, analyze, and optimize fuel usage across a fleet of vehicles. It consolidates data from telematics, fuel cards, and vehicle sensors to provide actionable insights on fuel consumption patterns, cost trends, and efficiency metrics.
Fleet managers use this dashboard to identify wasteful spending, detect fuel theft, and improve overall operational efficiency. By tracking key performance indicators (KPIs) such as fuel cost per mile, idle time, and miles per gallon (MPG), businesses can make data-driven decisions to reduce expenses and enhance sustainability. This dashboard also helps in comparing fuel efficiency across different vehicle classes, regions, and time periods, enabling targeted improvements in fleet performance.
How to Create a Fleet Fuel Efficiency & Consumption Tracking Dashboard
You don’t need to build your report from scratch, just start with a ready-to-use dashboard template from Mokkup. Add in your data and export it however you like. Here’s how to do it:
1. Create or Log in to Your Mokkup Account
Start by signing up on Mokkup.ai using your email. If you already have an account, just log in, and you’ll be good to go.
2. Choose and Customize Your Dashboard Template
Find the Fleet Fuel Efficiency & Consumption Tracking Dashboard template in the Templates section. Use the drag and drop editor to adjust KPIs, edit filters, or add elements based on your data.
3. Export to Your BI Tool
Once your dashboard wireframe is ready, use the BI Tool Export feature to send it directly to Power BI or Tableau for further analysis and enhancements. You can also download the dashboard as a PDF, PNG, or JPEG, embed it on a platform, or invite your team to collaborate.
Note: This is a Pro template. You’ll need a Pro subscription on Mokkup to use and customize this dashboard wireframe. Upgrade anytime to unlock full access.
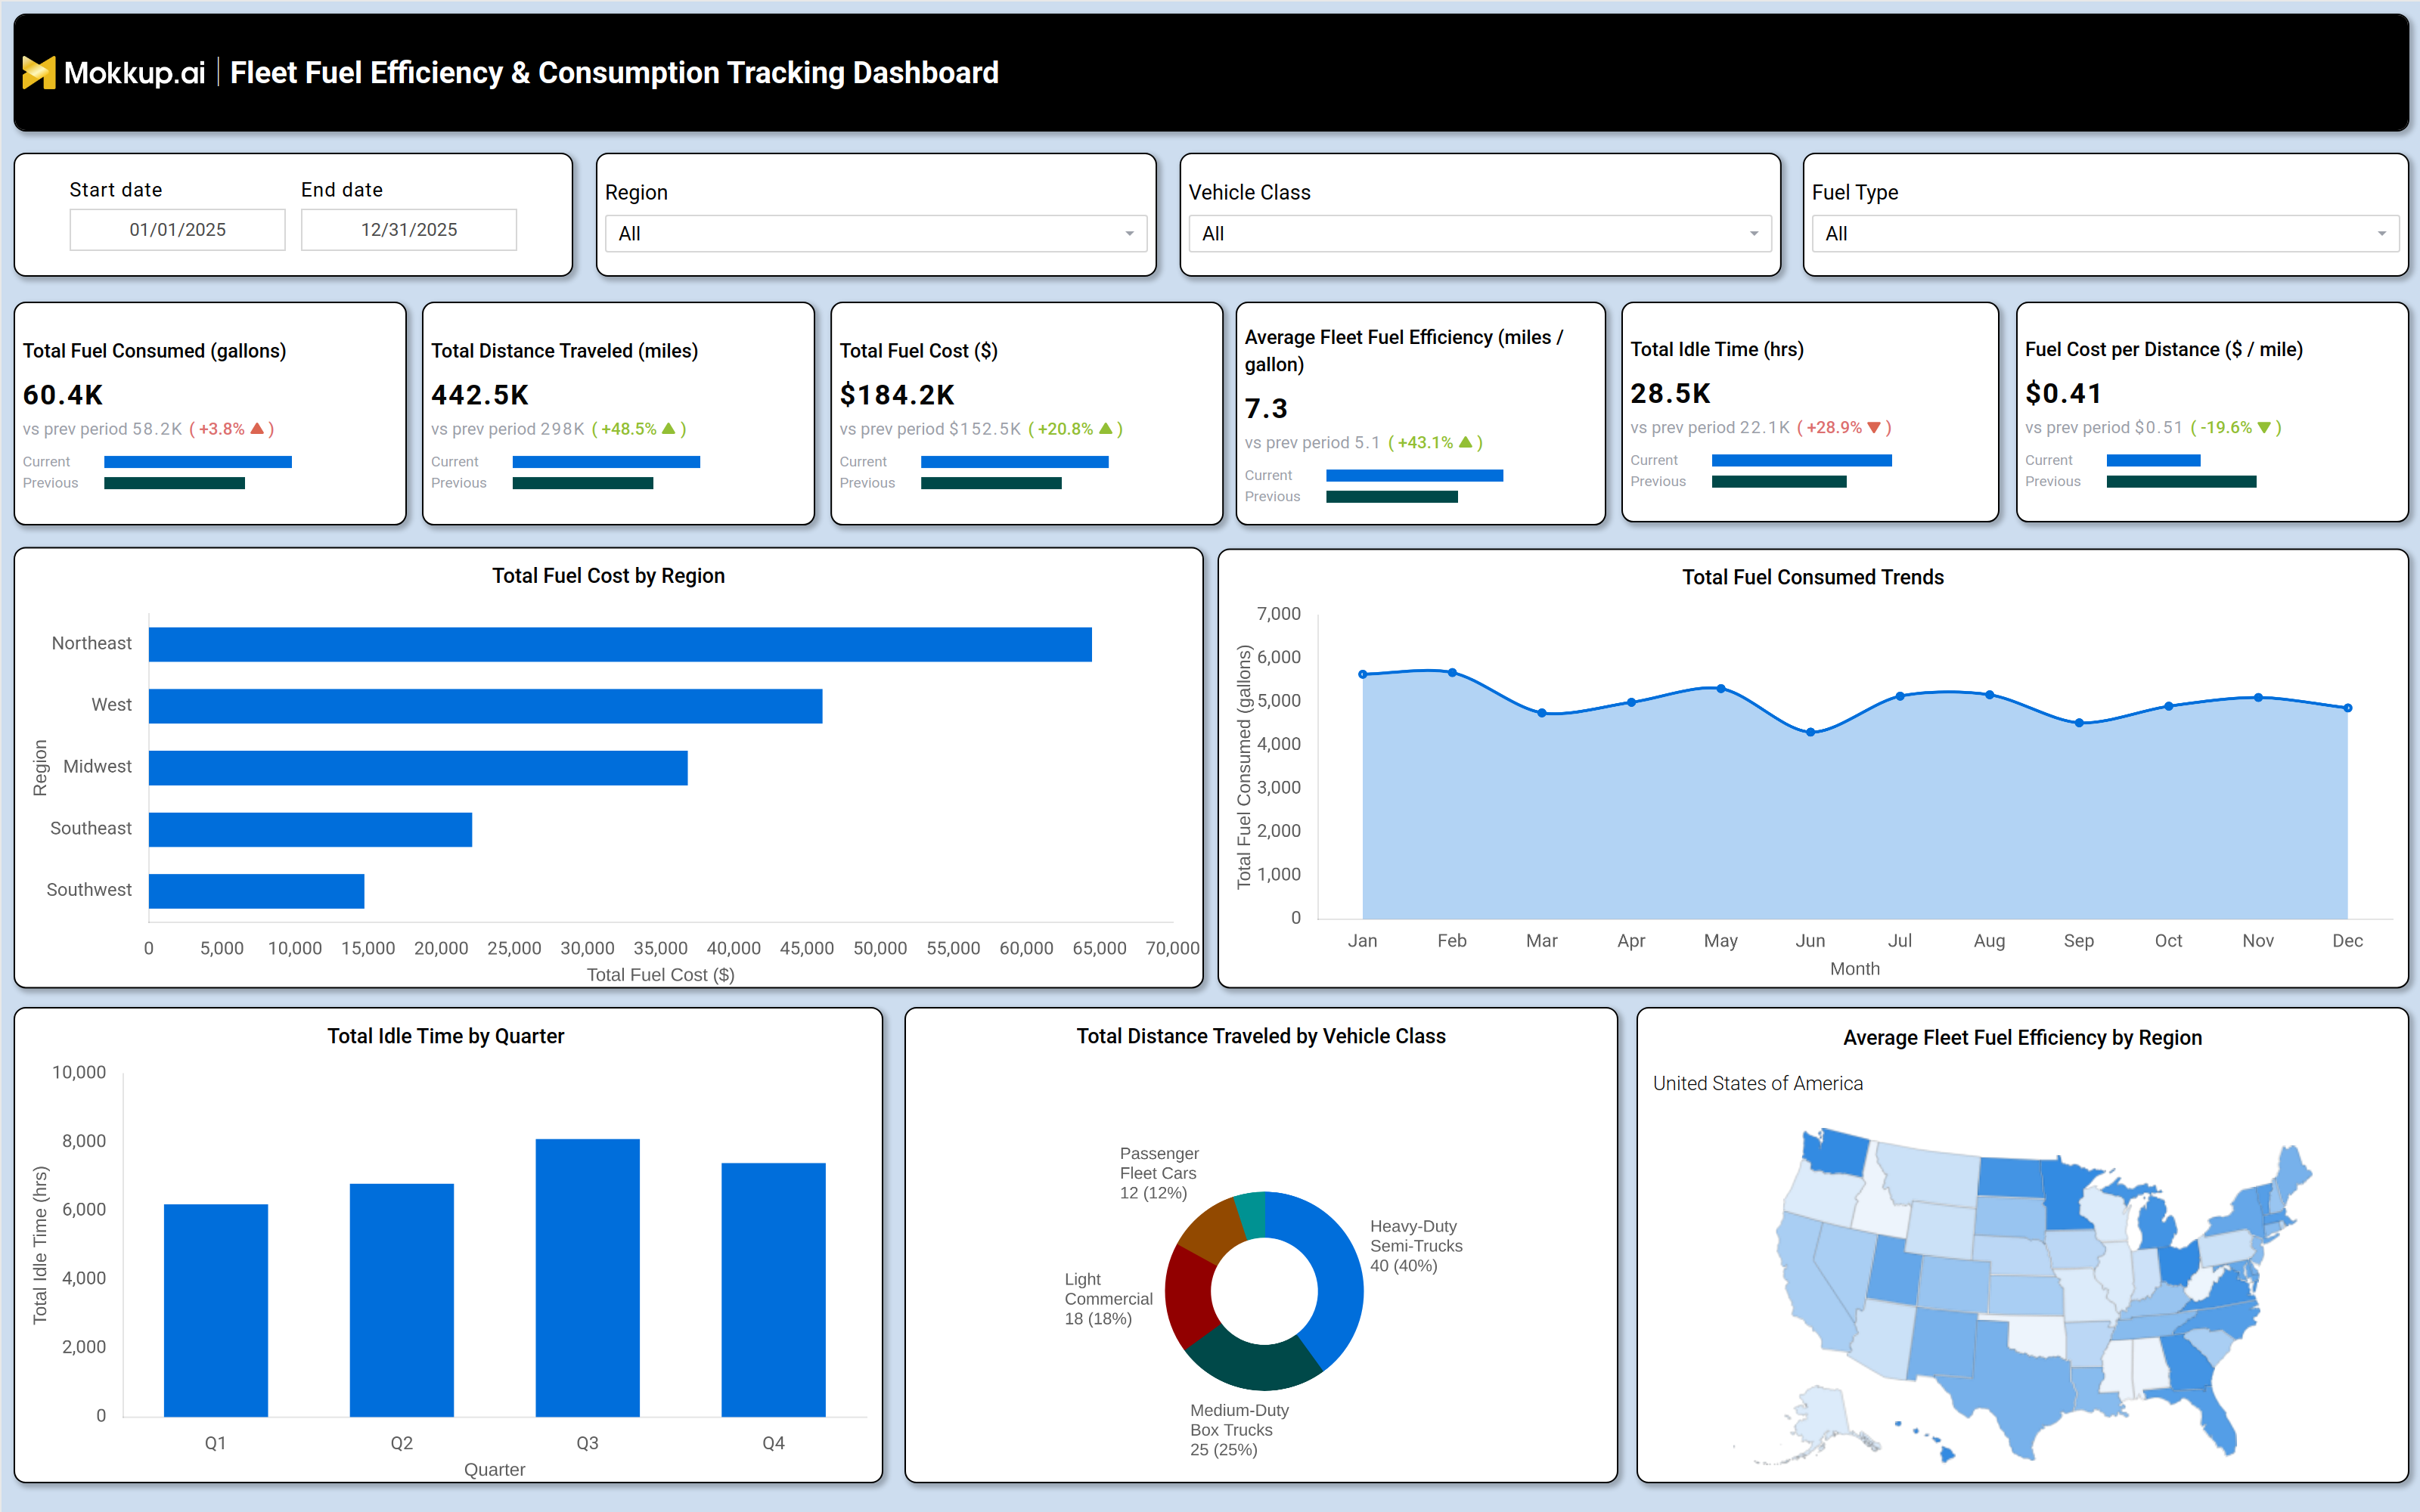
Fleet Fuel Efficiency & Consumption Tracking Dashboard Example
A well-designed telematics analytics dashboard includes interactive filters for date ranges, vehicle classes, regions, and fuel types. Key metrics displayed in tiles include total fuel consumed, total distance traveled, fuel cost, average fleet fuel efficiency, idle time, and fuel cost per mile. Trend charts show monthly fuel consumption patterns, while bar graphs compare fuel costs by region.
A vehicle class breakdown helps identify which types of vehicles (e.g., heavy-duty trucks, light commercial vehicles) consume the most fuel. A geographic heatmap highlights regional variations in fuel efficiency, allowing fleet managers to pinpoint areas needing optimization. Additionally, quarterly idle time analysis helps reduce unnecessary fuel waste, while fuel cost trends provide insights into budgeting and cost control.
How to Analyze Data in a Fleet Fuel Efficiency & Consumption Tracking Dashboard
Here is how you can analyze data from this dashboard:
- Compare Fuel Consumption Trends: Identify inefficiencies across different time periods.
- Monitor Fuel Cost per Mile: Evaluate route and vehicle cost effectiveness.
- Analyze Idle Time: Detect unnecessary fuel waste and improve driver behavior.
- Evaluate Vehicle Efficiency: Compare fuel performance across vehicle classes.
- Track Regional Fuel Costs: Identify cost variations to optimize logistics planning.
- Detect Fuel Anomalies: Compare fuel consumed against distance traveled to spot irregularities.
- Review MPG Trends: Measure the impact of maintenance and driver training programs.
- Monitor Idle Time Quarterly: Use long-term trends to reduce unnecessary fuel usage.
Benefits of a Fleet Fuel Efficiency & Consumption Tracking Dashboard
The following are the benefits of using this fuel cost per mile dashboard:
- Reduced Fuel Costs: Identifies wasteful fuel consumption patterns quickly.
- Improved Efficiency: Supports route optimization and better driving behavior.
- Fuel Theft Prevention: Detects anomalies through detailed consumption tracking.
- Enhanced Vehicle Performance: Monitors key fuel-related KPIs across the fleet.
- Sustainability Support: Helps reduce carbon emissions and fuel waste.
- Better Budget Planning: Improves fuel cost forecasting accuracy.
- Operational Efficiency: Streamlines fleet management and monitoring.
- Actionable Insights: Enables faster, data-driven decision-making.
KPIs to Track in a Fleet Fuel Efficiency & Consumption Tracking Dashboard
The following key KPIs can be tracked by using this dashboard:
- Total Fuel Consumed (Gallons): Measures overall fuel usage across the fleet.
- Total Distance Traveled (Miles): Tracks fleet activity to assess fuel efficiency.
- Total Fuel Cost ($): Monitors fuel expenses for budgeting and cost control.
- Average Fleet Fuel Efficiency (MPG): Evaluates how efficiently vehicles use fuel.
- Total Idle Time (Hours): Identifies wasted fuel due to unnecessary idling.
- Fuel Cost per Distance ($/Mile): Calculates cost effectiveness of fuel usage.
Frequently Asked Questions
Q1. What is an idle time monitoring dashboard used for?
A fleet fuel efficiency tracking dashboard is an analytics tool that monitors fuel consumption, costs, and efficiency metrics to help businesses optimize fleet operations.
Q2. How does a Fleet Fuel Efficiency & Consumption Tracking Dashboard help reduce fuel costs?
Q3. Who should use a fleet fuel efficiency dashboard?
Fleet managers, logistics companies, and transportation businesses looking to reduce fuel costs and improve efficiency.