
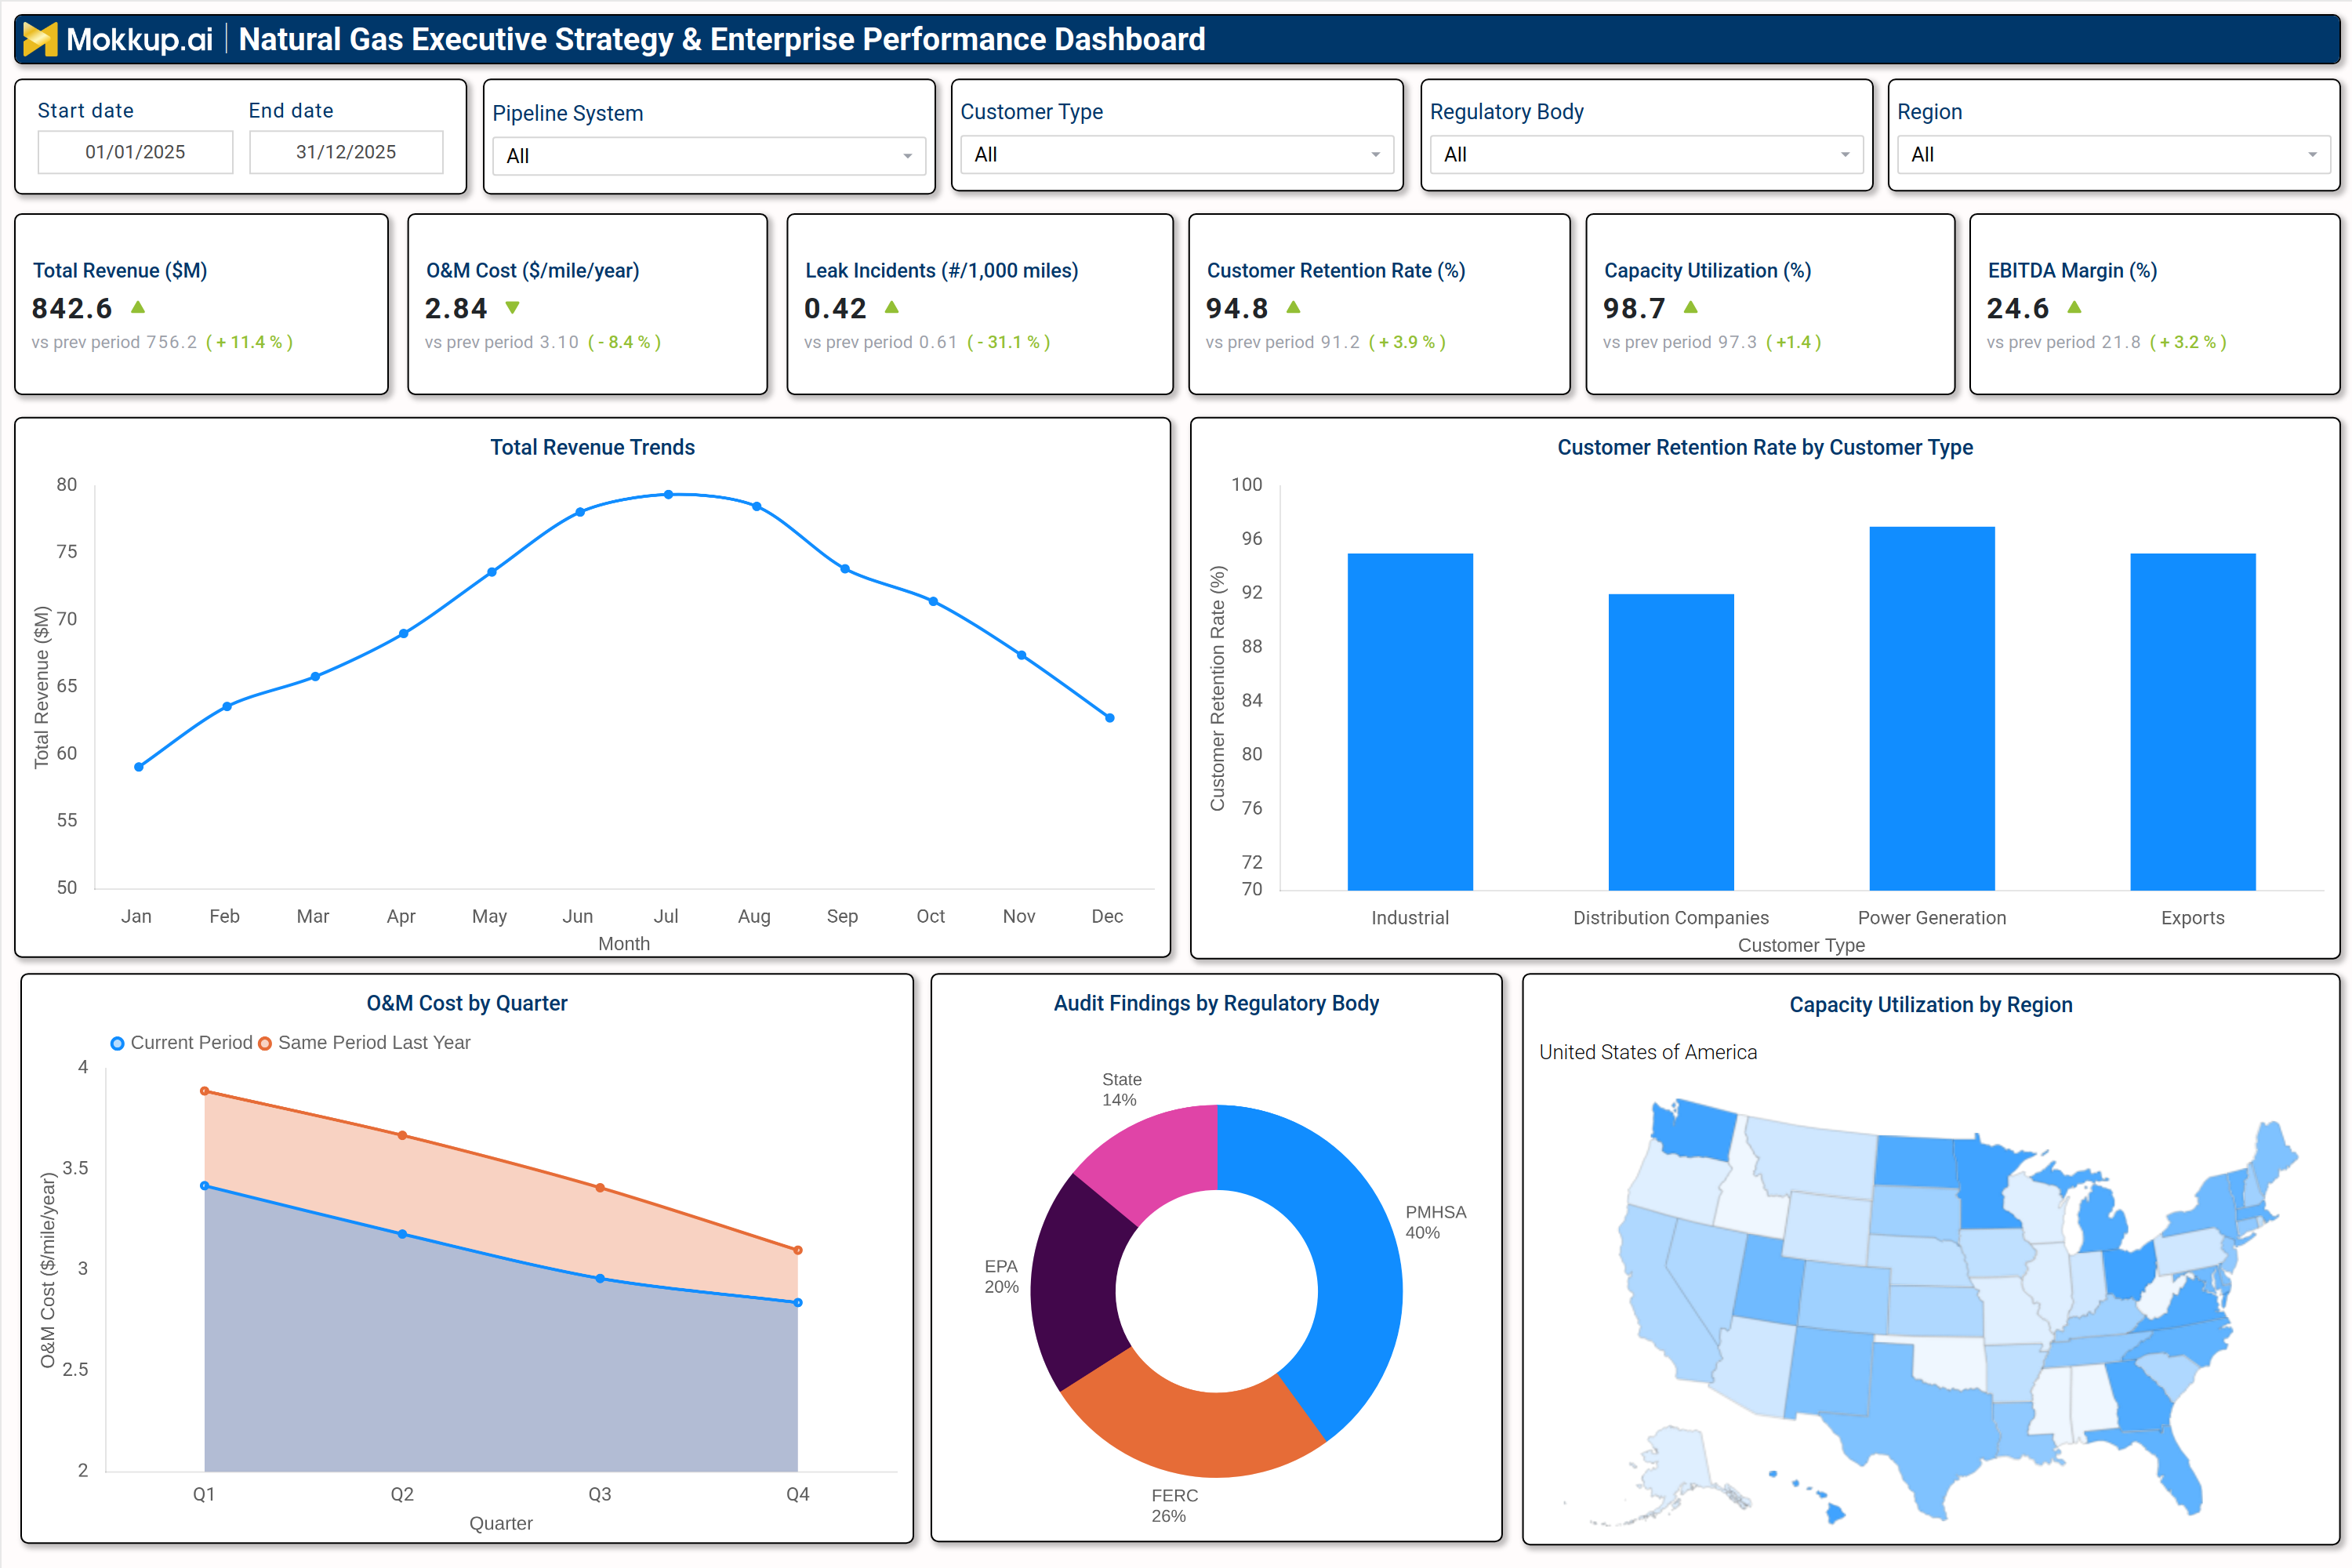
What is a Natural Gas Executive Strategy & Enterprise Performance Dashboard?
A Natural Gas Executive Strategy & Enterprise Performance Dashboard is a centralized analytics tool designed to help energy executives, operations managers, and decision-makers monitor, analyze, and optimize the performance of natural gas utilities and transmission networks. This dashboard consolidates financial, operational, safety, and regulatory data into a single interface, enabling leaders to assess pipeline efficiency, revenue trends, leak incidents, and customer retention. By integrating KPI tracking for natural gas pipeline operations, this dashboard provides actionable insights into gas utility business intelligence reporting tools, allowing executives to align strategic decisions with operational performance. Whether tracking EBITDA margins, capacity utilization, or O&M costs, this tool ensures that natural gas companies maintain regulatory compliance, improve cost efficiency, and enhance service reliability.
How to Create a Natural Gas Executive Strategy & Enterprise Performance Dashboard
You don’t need to build your report from scratch, just start with a ready-to-use dashboard template from Mokkup. Add in your data and export it however you like. Here’s how to do it:
1. Create or Log in to Your Mokkup Account
Start by signing up on Mokkup.ai using your email. If you already have an account, just log in, and you’ll be good to go.
2. Choose and Customize Your Dashboard Template
Find the Natural Gas Executive Strategy & Enterprise Performance Dashboard template in the Templates section. Use the drag-and-drop editor to adjust KPIs, edit filters, or add elements based on your data.
3. Export to Your BI Tool
Once your dashboard wireframe is ready, use the BI Tool Export feature to send it directly to Power BI or Tableau for further analysis and enhancements. You can also download the dashboard as a PDF, PNG, or JPEG, embed it on a platform, or invite your team to collaborate.
Note: This is a Pro template. You’ll need a Pro subscription on Mokkup to use and customize this dashboard wireframe. Upgrade anytime to unlock full access.
Natural Gas Executive Strategy & Enterprise Performance Dashboard Example
A well-designed Natural Gas Executive Strategy & Enterprise Performance Dashboard for gas transmission companies includes interactive filters for date ranges, pipeline systems, customer types, regulatory bodies, and regions. Key performance tiles display total revenue, O&M costs per mile, leak incidents, customer retention rates, capacity utilization, and EBITDA margins, with comparisons against previous periods. Trend charts visualize revenue growth, O&M cost fluctuations, and leak incident reductions over time, while a regulatory audit findings breakdown highlights compliance risks. A capacity utilization heatmap by region helps identify underutilized or overburdened pipeline networks. Additionally, customer retention analytics segmented by industrial, power generation, and distribution companies provide insights into service quality and market demand. Together, these components form a natural gas industry enterprise performance analytics platform that enables executives to monitor financial health, operational efficiency, and regulatory compliance in one unified view.
How to Analyze Data in a Natural Gas Executive Strategy & Enterprise Performance Dashboard
Here is how you can analyze data from this dashboard:
- Review Revenue Trends: Analyze revenue patterns over time to assess financial performance and uncover potential growth opportunities.
- Monitor O&M Costs per Mile: Track operations and maintenance costs per mile to identify inefficiencies in pipeline maintenance and operations.
- Track Leak Incidents: Monitor leak incidents regularly to evaluate safety performance and minimize environmental risks.
- Analyze Customer Retention by Segment: Study retention rates across customer segments to improve service quality and strengthen customer loyalty.
- Assess Capacity Utilization: Evaluate pipeline capacity usage to optimize throughput and prevent operational bottlenecks.
- Compare EBITDA Margins: Benchmark EBITDA margins against industry standards to measure overall profitability and financial health.
- Examine Regulatory Audit Findings: Review audit outcomes to ensure regulatory compliance and reduce potential operational risks.
- Evaluate Regional Performance: Analyze performance across different regions to allocate resources efficiently across service territories.
Benefits of a Natural Gas Executive Strategy & Enterprise Performance Dashboard
The following are the benefits of using this natural gas operations command center dashboard:
- Enhance Strategic Decision-Making: Provide data-driven insights into financial and operational performance to support informed business decisions.
- Improve Pipeline Efficiency: Track gas transmission operational efficiency dashboard metrics to identify performance gaps and improve pipeline operations.
- Reduce Operational Costs: Optimize O&M spending and implement leak prevention strategies to lower overall operational expenses.
- Strengthen Regulatory Compliance: Monitor audit findings and conduct risk assessments to ensure compliance with industry regulations.
- Boost Customer Retention: Identify service gaps through data analysis to improve customer satisfaction and long-term loyalty.
- Support Revenue Growth: Use trend analysis and market demand forecasting to uncover new growth opportunities.
- Enable Proactive Risk Management: Monitor safety incidents and compliance violations to identify risks early and take corrective action.
- Streamline Executive Reporting: Automate KPI tracking and visualization to deliver clear, real-time insights for leadership teams.
KPIs to Track in a Natural Gas Executive Strategy & Enterprise Performance Dashboard
The following key KPIs can be tracked by using this pipeline infrastructure strategy dashboard:
- Total Revenue ($M): Measures overall financial performance and revenue growth.
- O&M Cost ($/mile/year): Tracks operational and maintenance expenses per pipeline mile.
- Leak Incidents (#/1,000 miles): Monitors pipeline safety and environmental compliance.
- Customer Retention Rate (%): Evaluates customer loyalty and service quality.
- Capacity Utilization (%): Assesses pipeline efficiency and demand fulfillment.
- EBITDA Margin (%): Measures profitability before interest, taxes, depreciation, and amortization.
- Regulatory Audit Findings (count): Tracks compliance violations and corrective actions.
Frequently Asked Questions
1. What is an energy sector executive KPI dashboard?
It is a strategic decision-making dashboard for energy executives that consolidates financial, operational, and regulatory data to optimize natural gas utility and transmission performance.
2. Who should use this gas utility strategic planning dashboard?
Executives, operations managers, financial analysts, and regulatory compliance teams in natural gas utilities and transmission companies.
3. What data sources feed this natural gas enterprise performance dashboard?
Pipeline SCADA systems, financial ERP software, regulatory compliance databases, and customer relationship management (CRM) tools.