
What is a Natural Gas Distribution Network Expansion Dashboard?
A natural gas network expansion dashboard is a performance monitoring tool used by gas utilities to track infrastructure growth, pipeline expansion, and new customer connections. It consolidates data across project execution, capital investment, regulatory compliance, and operational progress into a single analytics interface. This gas distribution network expansion analytics dashboard enables utilities to monitor how efficiently expansion projects are progressing across regions and phases. It includes metrics such as pipeline commissioned, new connections added, capex utilization, and regulatory submission performance. The dashboard also supports planning and execution by providing insights into delays, cost variance, and throughput trends. As a result, it helps organizations align expansion strategies with demand growth, regulatory timelines, and infrastructure capacity requirements.
How to Create a Natural Gas Distribution Network Expansion Dashboard?
You don’t need to build your report from scratch; just start with a ready-to-use dashboard template from Mokkup. Add in your data and export it however you like. Here’s how to do it:
1. Create or Log in to Your Mokkup Account
Start by signing up on Mokkup.ai using your email. If you already have an account, just log in, and you’ll be good to go.
2. Choose and Customize Your Dashboard Template
Find the Natural Gas Distribution Network Expansion Dashboard template in the Templates section. Use the drag-and-drop editor to adjust KPIs, edit filters, or add elements based on your data.
3. Export to Your BI Tool
Once your dashboard wireframe is ready, use the BI Tool Export feature to send it directly to Power BI or Tableau for further analysis and enhancements. You can also download the dashboard as a PDF, PNG, or JPEG, embed it on a platform, or invite your team to collaborate.
Note: This is a Pro template. You’ll need a Pro subscription on Mokkup to use and customize this dashboard wireframe. Upgrade anytime to unlock full access.
Natural Gas Distribution Network Expansion Dashboard Example
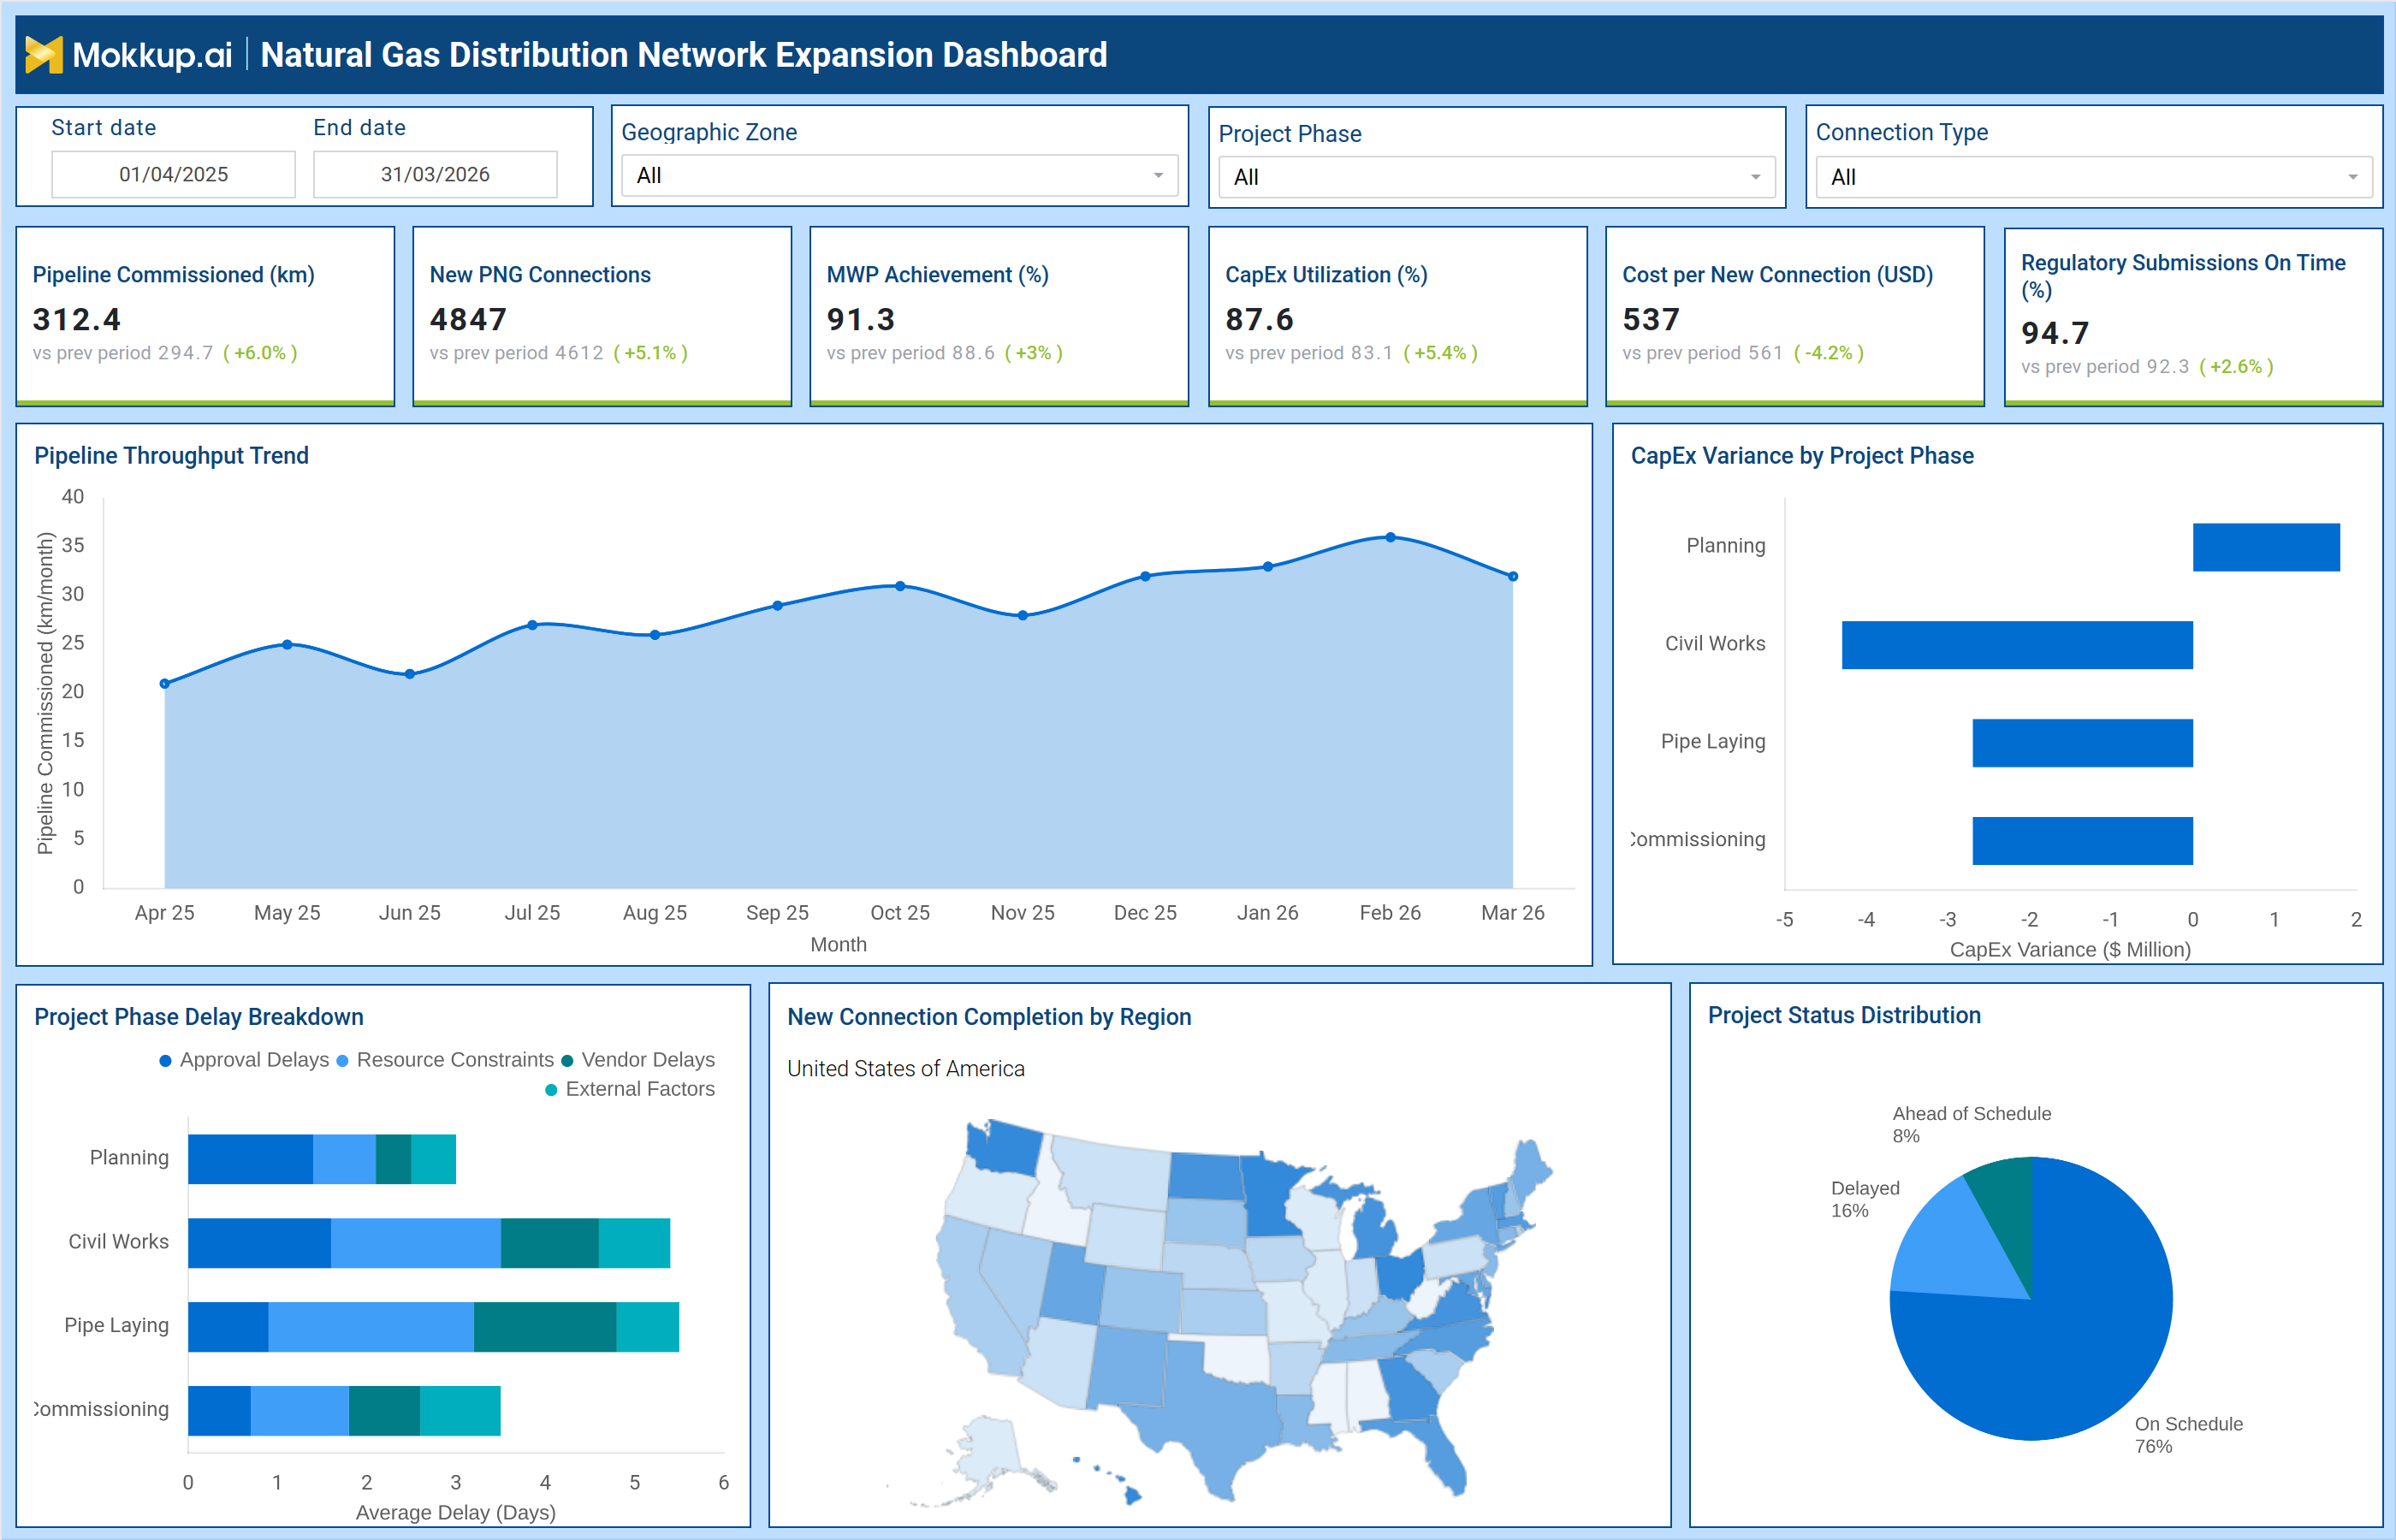
A typical gas utility network growth monitoring dashboard provides a structured view of expansion performance across geographic zones and project phases. For example, the dashboard highlights key KPIs such as total pipeline commissioned (in km), new PNG connections, minimum work program (MWP) achievement, capex utilization, cost per new connection, and regulatory submissions completed on time. Users can filter data by geographic zone, project phase, and connection type to evaluate performance at a granular level. A pipeline throughput trend shows how monthly commissioning activity is progressing, helping identify acceleration or slowdown in expansion.
Project Capex variance by phase provides visibility into budget deviations across planning, civil works, pipe laying, and commissioning. This allows project managers to control costs and identify overspending early. The dashboard also includes a project phase delay breakdown, highlighting delays due to approvals, resource constraints, vendor issues, and external factors. Regional performance is visualized through a map showing new connection completion across different areas. Finally, project status distribution gives a quick view of projects that are on schedule, delayed, or ahead of schedule. This natural gas pipeline expansion tracking dashboard helps utilities ensure timely execution and efficient infrastructure rollout.
How to Analyze Data in Natural Gas Distribution Network Expansion Dashboard
Here is how you can analyze data from this dashboard:
- Track pipeline commissioned trends to assess expansion progress over time
- Compare new connection growth across regions to identify high-demand areas
- Analyze MWP achievement to ensure regulatory targets are met
- Evaluate capex utilization to monitor investment efficiency
- Compare cost per new connection across zones to identify cost optimization opportunities
- Review capex variance by project phase to detect budget overruns
- Analyze delay breakdown by phase to identify bottlenecks in execution
- Track regulatory submission compliance to avoid penalties and delays
- Compare project status distribution to monitor execution health
- Correlate throughput trends with connection growth to assess capacity alignment
Benefits of Natural Gas Distribution Network Expansion Dashboard
The following are the benefits of using this dashboard:
- Provides full visibility into network expansion performance across regions
- Enables better planning and execution of pipeline and connection projects
- Improves capex control through cost monitoring
- Helps identify delays and bottlenecks in project phases
- Supports regulatory compliance through tracking of submission timelines
- Enhances decision-making with data-driven insights on infrastructure growth
- Optimizes resource allocation across expansion projects
- Improves coordination between planning, execution, and operations teams
- Tracks return on infrastructure investments through connection growth
- Strengthens long-term network development strategies
KPIs to Track in Natural Gas Distribution Network Expansion Dashboard
The following key KPIs can be tracked by using this dashboard:
- Pipeline Commissioned (km) – Measures total length of pipeline infrastructure added over a period
- New PNG Connections – Tracks number of new domestic, commercial, or industrial connections added
- MWP Achievement (%) – Indicates progress against regulatory minimum work program targets
- CapEx Utilization (%) – Measures how effectively allocated capital is being used in expansion projects
- Cost per New Connection (USD) – Tracks cost efficiency of customer acquisition through network expansion
- Regulatory Submissions On Time (%) – Measures compliance with regulatory filing deadlines
- Pipeline Throughput Trend – Tracks monthly commissioning activity to assess expansion pace
- CapEx Variance by Project Phase – Identifies budget deviations across planning and execution stages
- Project Phase Delay Breakdown – Highlights causes of delays such as approvals, vendors, or external factors
- Project Status Distribution (%) – Shows proportion of projects on schedule, delayed, or ahead of schedule
Frequently Asked Questions
1. Why is a natural gas network expansion dashboard important?
It provides visibility into infrastructure growth, helping utilities manage expansion efficiently and meet demand and regulatory targets.
2. How does a gas distribution network expansion analytics dashboard improve planning?
It identifies trends in pipeline expansion, connection growth, and delays, enabling better forecasting and resource allocation.
3. What insights does a gas distribution infrastructure expansion dashboard provide?
It offers insights into capex utilization, project delays, regulatory compliance, and regional performance.