What is a Hydropower Project CapEx & Execution Control Dashboard?
A Hydropower Project CapEx & Execution Control Dashboard is a centralized monitoring system used by utilities, EPC teams, and project directors to track financial performance, construction progress, and execution risks across hydropower development projects. This dashboard serves as a control center for hydropower project capital expenditure execution, providing visibility into budget spending, cost variance, milestone progress, workforce readiness, material availability, and risk exposure.
By integrating both cost and execution metrics, it acts as a hydroelectric CapEx planning and execution tracker, allowing stakeholders to understand how CapEx utilization aligns with planned schedules. It also supports variance tracking, procurement efficiency measurement, and contractor performance evaluation, making it a comprehensive tool for managing execution complexity in hydroelectric projects. For electric utilities, this dashboard consolidates project-wide insights into a unified view, enabling accurate planning, timely interventions, and compliance with governance frameworks. As a utility hydro project budget variance analytics and hydropower project schedule and cost control system, it ultimately helps teams reduce overruns, mitigate delays, and improve overall delivery performance.
How to Create a Hydropower Project CapEx & Execution Control Dashboard
You don’t need to build your report from scratch, just start with a ready-to-use dashboard template from Mokkup. Add in your data and export it however you like. Here’s how to do it:
1. Create or Log in to Your Mokkup Account
Start by signing up on Mokkup.ai using your email. If you already have an account, just log in, and you’ll be good to go.
2. Choose and Customize Your Dashboard Template
Find the Hydropower Project CapEx & Execution Control Dashboard template in the Templates section. Use the drag-and-drop editor to adjust KPIs, edit filters, or add elements based on your data.
3. Export to Your BI Tool
Once your dashboard wireframe is ready, use the BI Tool Export feature to send it directly to Power BI or Tableau for further analysis and enhancements. You can also download the dashboard as a PDF, PNG, or JPEG, embed it on a platform, or invite your team to collaborate.
Note: This is a Pro template. You’ll need a Pro subscription on Mokkup to use and customize this dashboard wireframe. Upgrade anytime to unlock full access.
Hydropower Project CapEx & Execution Control Dashboard Example
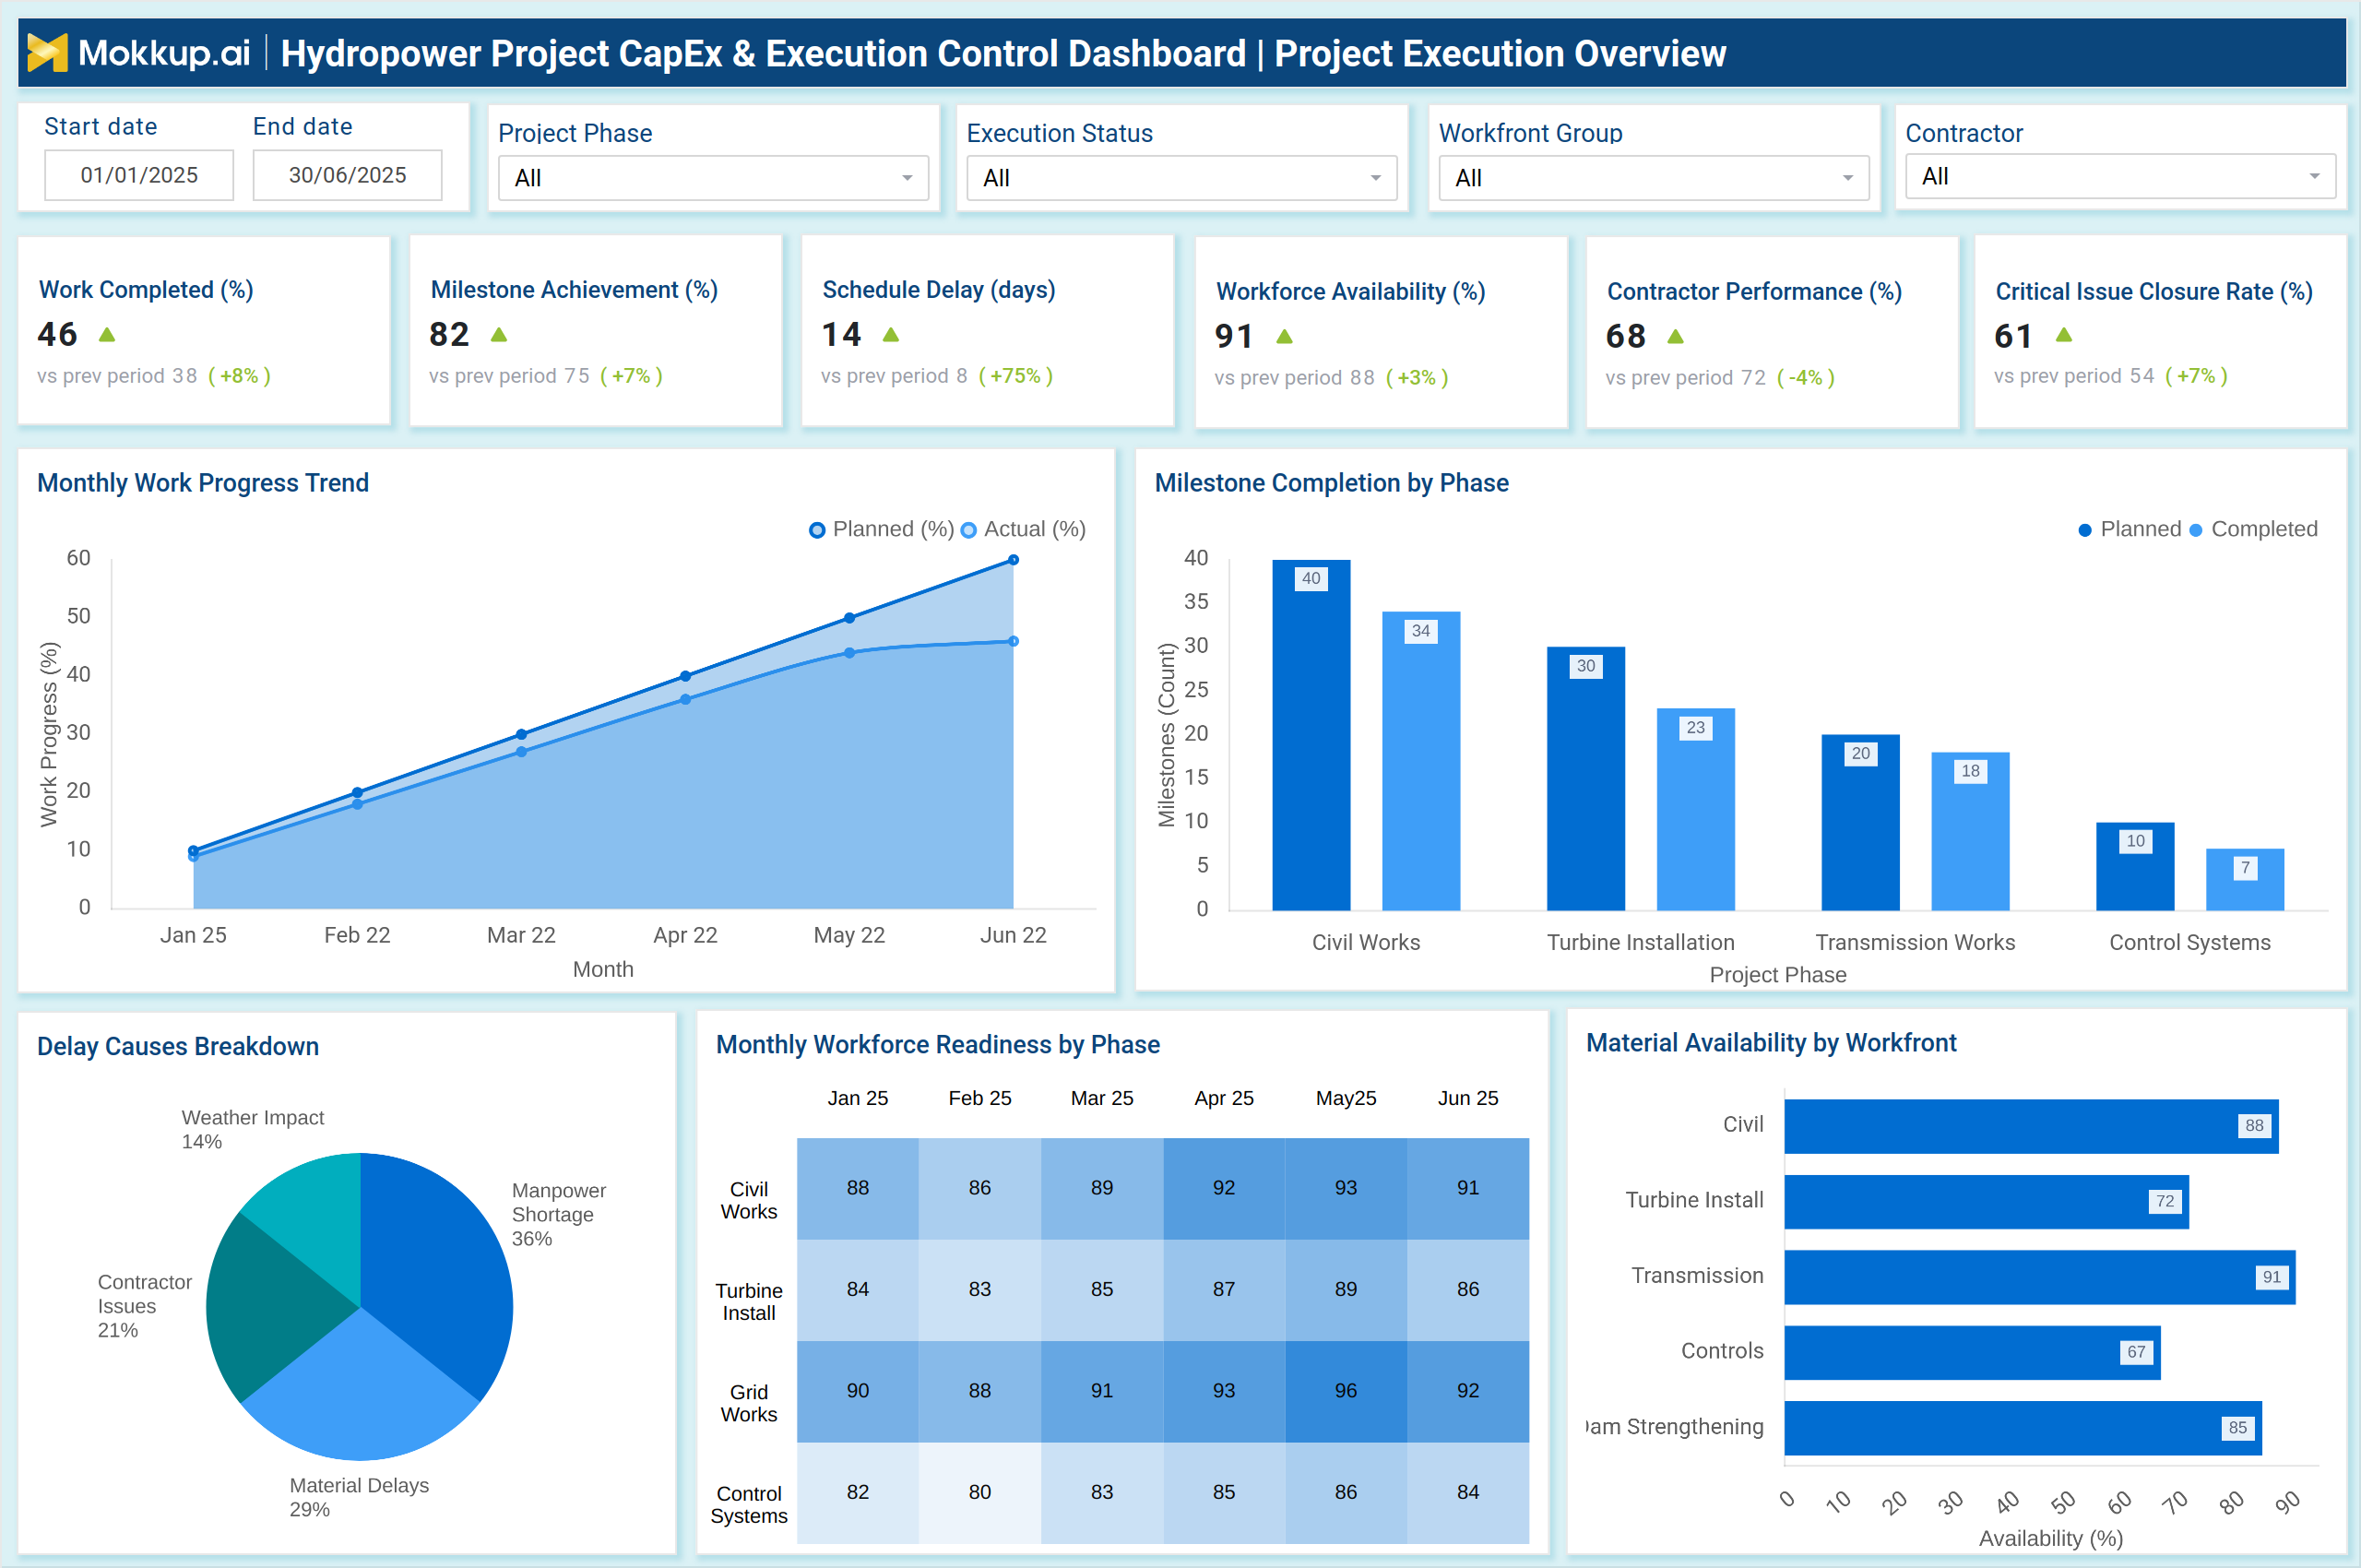
A typical implementation of this dashboard includes two major analytical views: Project Execution Overview and CapEx & Financial Oversight, as shown in the reference visuals. The Project Execution Overview screen summarizes execution progress through KPIs such as Work Completed (%), Milestone Achievement (%), Schedule Delay (days), Workforce Availability (%), Contractor Performance (%), and Critical Issue Closure Rate (%). A monthly work progress trend shows the actual versus planned completion rates, helping managers identify slippages early. Execution teams can track milestone completion across civil works, turbine installation, transmission works, and control systems.
Delays caused by factors such as manpower shortages, material delays, weather conditions, and contractor issues provide clarity on root-cause bottlenecks. Workforce readiness heatmaps and material availability charts strengthen planning accuracy across project phases. The CapEx & Financial Oversight screen focuses on CapEx Spent (%), Budget Utilization (%), Cost Variance (%), Procurement Fulfillment (%), Uncommitted CapEx (%), and Financial Risk Exposure Score. Monthly capital expenditures (CapEx) spending trends help assess whether costs are aligned with planned outflows. Cost variance breakdowns highlight areas like civil works, turbine supply, transmission components, and control systems.
Procurement metrics indicate delivery performance for turbine assemblies, transformers, control panels, and penstocks. Cost structure distribution and risk categories, such as material price escalation, delivery delays, contractor claims, inflation, and funding delays, serve as a robust tool for monitoring renewable hydro construction progress and reporting hydroelectric capital expenditure (capex) utilization and risk. Together, these views enable utilities to maintain strong oversight over both financial and execution dimensions of hydropower development.
How to Analyze Data in a Hydropower Project CapEx & Execution Control Dashboard
Here is how you can analyze data from this hydroelectric capex utilization and risk reporting dashboard:
- Track Work Completed (%) vs. Milestone Achievement (%) to verify execution alignment.
- Compare planned vs. actual progress trends to detect timeline deviations early.
- Review Schedule Delay (days) to assess schedule health across project phases.
- Analyze workforce availability and readiness trends to identify manpower constraints.
- Evaluate contractor performance scores to understand execution reliability.
- Analyze critical issue closure rates to measure responsiveness in field operations.
- Review delays help identify the dominant disruption drivers.
- Monitor material availability to ensure procurement aligns with the planned schedule.
- Monitor CapEx Spent (%) vs. Budget Utilization (%) to assess financial alignment.
- Evaluate cost variance (%) by work component to identify overspending segments.
- Track procurement fulfillment (%) to understand supply chain performance.
- Analyze uncommitted capital expenditures (CapEx) to plan future allocations and avoid bottlenecks.
- Review financial risk exposure scores to assess emerging economic and contractual risks.
Benefits of Hydropower Project CapEx & Execution Control Dashboard
The following are the benefits of using this dashboard:
- This dashboard delivers strategic and operational benefits, including:
- Provides unified visibility into execution progress and CapEx performance.
- Reduces financial overruns through cost variance analysis.
- Improves construction delivery timelines with milestone-based tracking.
- Strengthens workforce planning with readiness and availability analytics.
- Enhances procurement efficiency by monitoring delivery and fulfillment metrics.
- Reduces project delays by identifying root causes early.
- Supports structured governance through risk scoring and issue tracking.
- Enables more accurate forecasting of capital expenditures (CapEx) utilization and project outcomes.
- Improves contractor accountability through performance benchmarking.
- Helps utilities evaluate project health with a single consolidated dashboard.
KPIs to Track in a Hydropower Project CapEx & Execution Control Dashboard
The following key KPIs can be tracked by using this dashboard:
- Work Completed (%) – Measures physical progress across project phases.
- Milestone Achievement (%) – Tracks adherence to scheduled targets.
- Schedule Delay (days) – Indicates deviation from the planned timeline.
- Workforce Availability (%) – Monitors labor readiness on-site.
- Contractor Performance (%) – Evaluates reliability of services delivered.
- Critical Issue Closure Rate (%) – Tracks how quickly issues are resolved.
- CapEx Spent (%) – Shows cumulative capital expenditure progress.
- Budget Utilization (%) – Measures how much of the approved budget is used.
- Cost Variance (%) – Highlights over- or under-spending across components.
- Procurement Fulfillment (%) – Measures the timely delivery of critical equipment.
- Uncommitted CapEx (%) – Tracks budget not yet allocated to specific works.
- Financial Risk Exposure Score – Quantifies financial threats affecting project delivery.
Frequently Asked Questions
1. Who uses a CapEx & Execution Control Dashboard?
Project directors, construction managers, EPC teams, finance controllers, procurement teams, and utility executives.
2. Why is CapEx monitoring essential in hydropower projects?
It prevents budget overruns, supports accurate planning, enhances contract management, and ensures financial discipline throughout the development process.
3. How does this dashboard support project execution?
By combining progress trends, workforce readiness, procurement metrics, cost variance insights, and risk reporting into one integrated platform.