
What is a Natural Gas Distribution Energy Trading Dashboard?
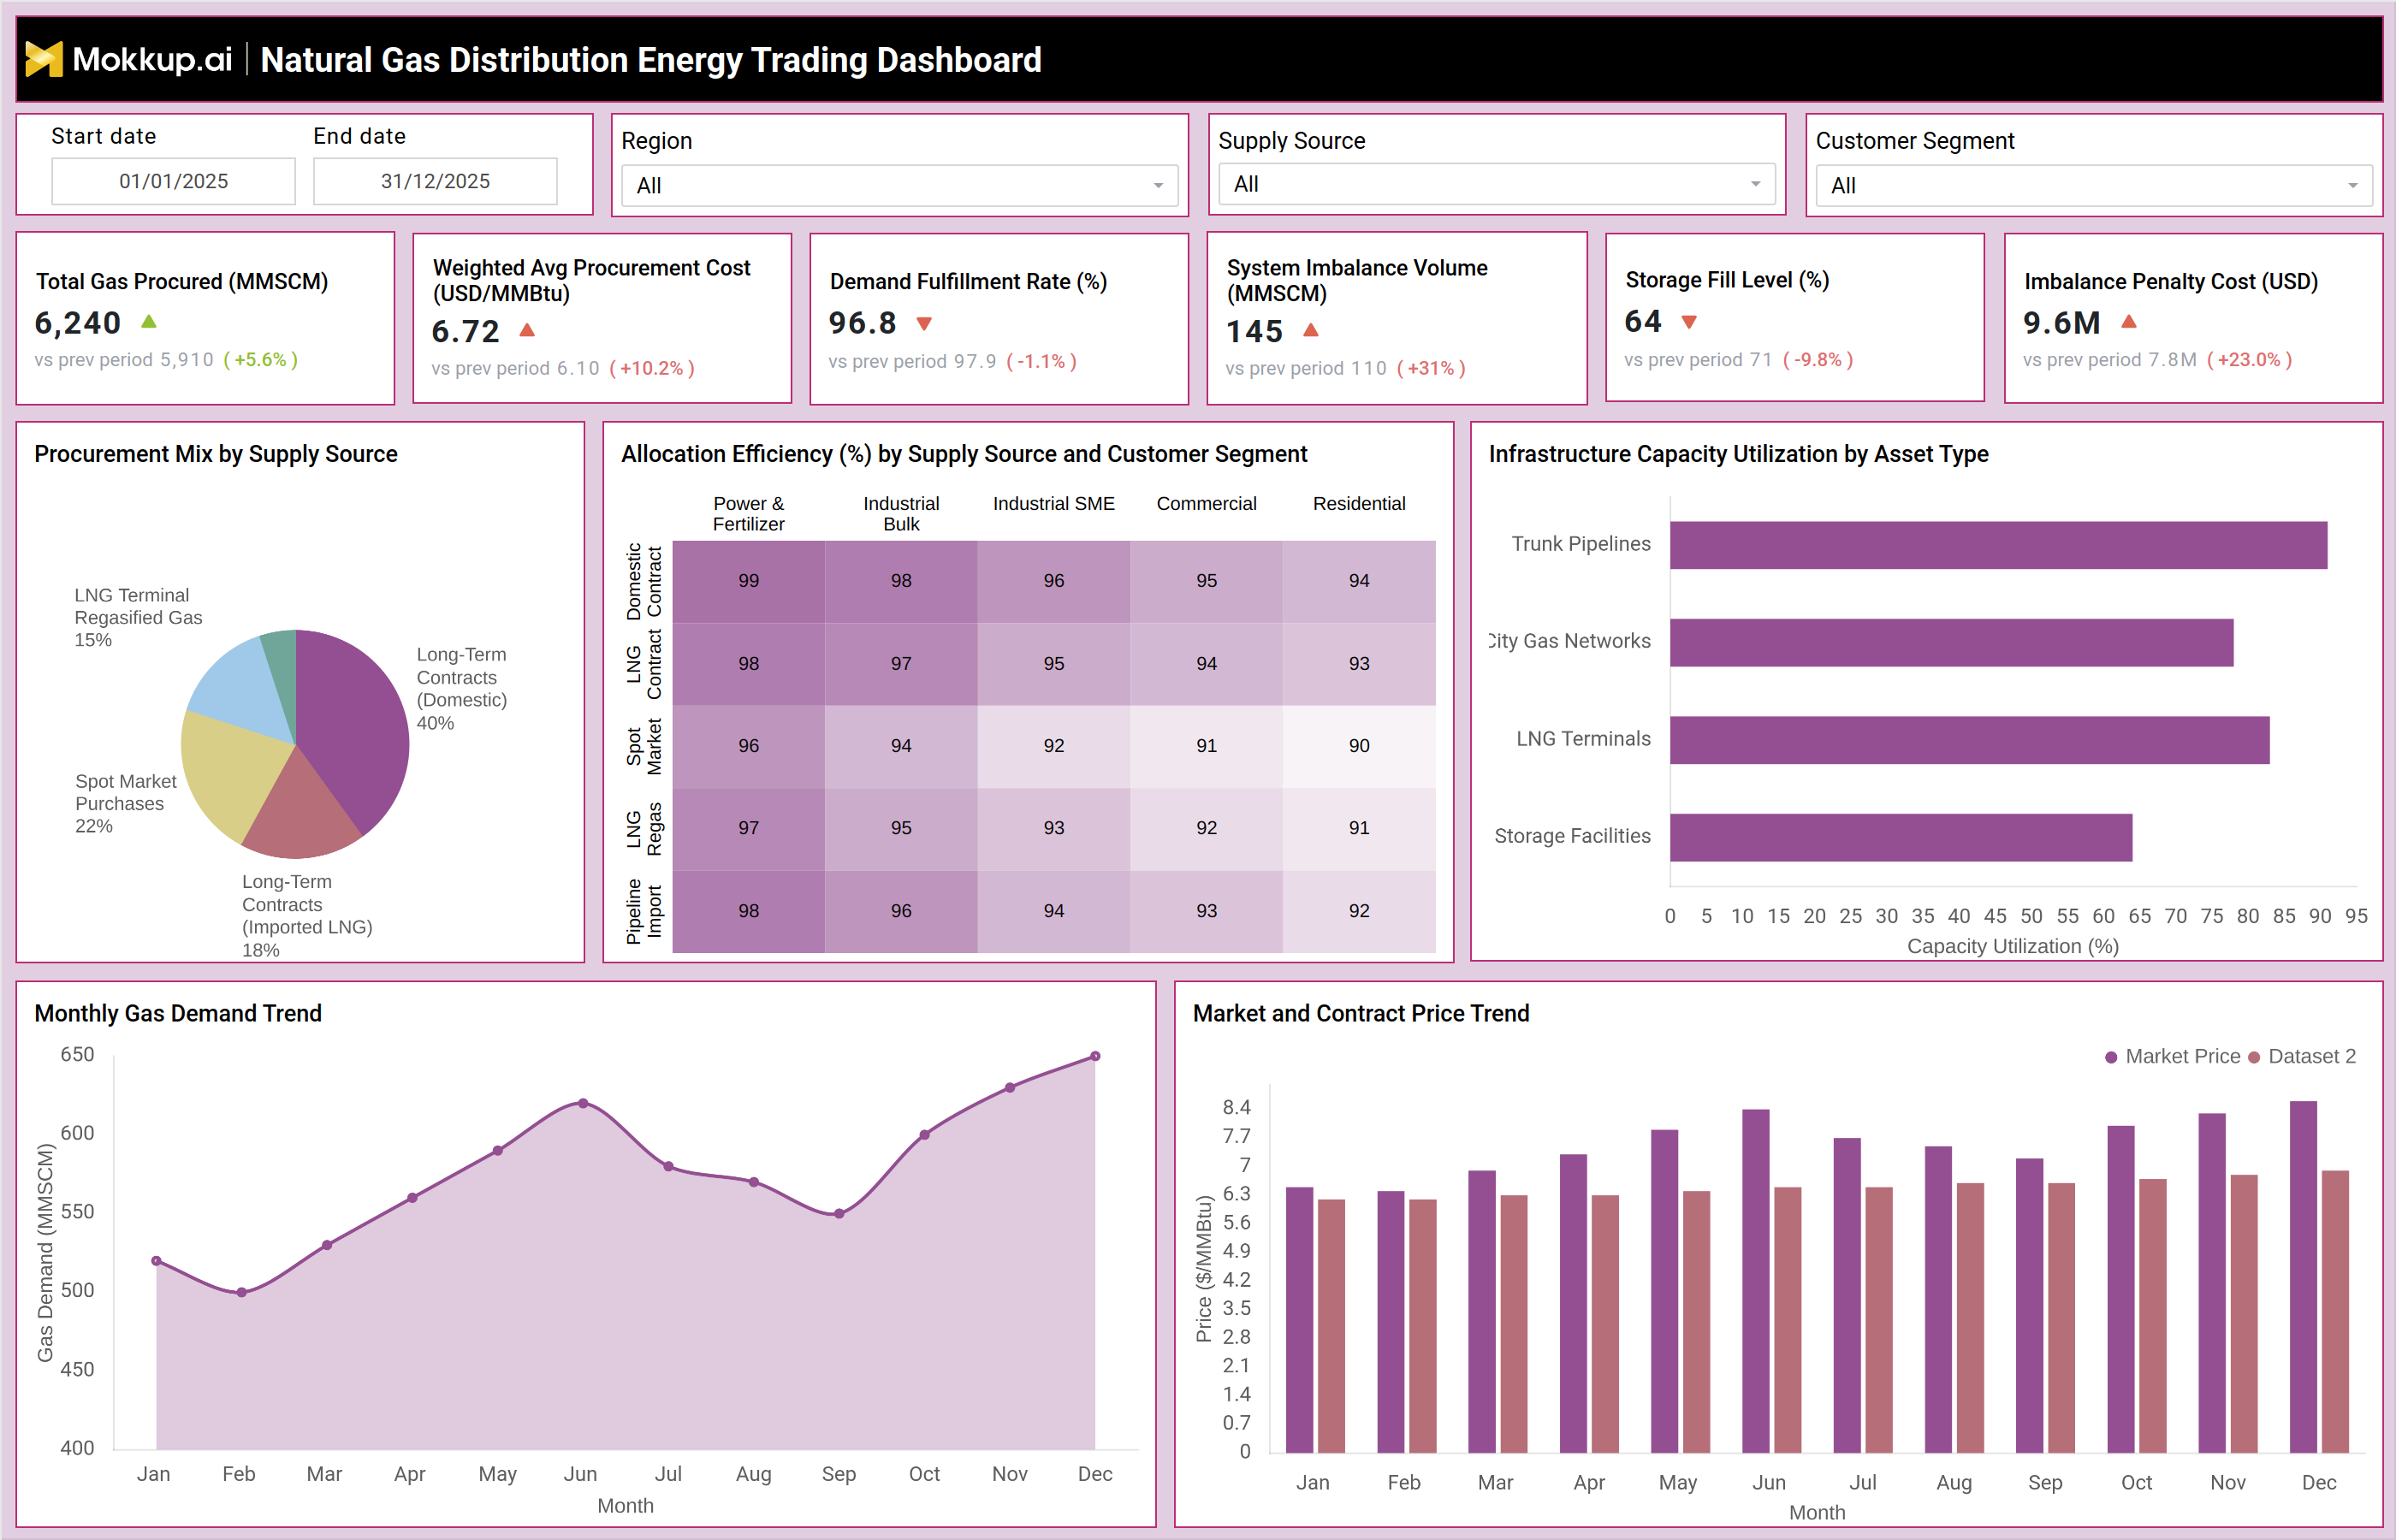
A gas distribution energy trading dashboard is an analytics solution used by gas utilities to monitor procurement, pricing, demand fulfillment, and trading performance across the distribution network. It combines data from supply contracts, market prices, and operational systems to provide a unified view of trading activities. This natural gas trading analytics dashboard helps utilities manage gas sourcing strategies, optimize procurement costs, and balance supply with demand.
The dashboard tracks key metrics such as total gas procured, weighted average procurement cost, demand fulfillment rate, and system imbalance volume. It also highlights storage levels and penalty costs associated with imbalances. A well-designed gas trading performance monitoring dashboard enables operators to make informed decisions on sourcing, pricing, and allocation while maintaining operational efficiency and cost control.
How to Create a Natural Gas Distribution Energy Trading Dashboard
You don’t need to build your report from scratch, just start with a ready-to-use Natural Gas Distribution Energy Trading dashboard template from Mokkup. Add in your data and export it however you like. Here’s how to do it:
1. Create or Log in to Your Mokkup Account
Start by signing up on Mokkup.ai using your email. If you already have an account, just log in, and you’ll be good to go.
2. Choose and Customize Your Dashboard Template
Find the Natural Gas Distribution Energy Trading Dashboard template in the Templates section. Use the drag-and-drop editor to adjust KPIs, edit filters, or add elements based on your data.
3. Export to Your BI Tool
Once your dashboard wireframe is ready, use the BI Tool Export feature to send it directly to Power BI or Tableau for further analysis and enhancements. You can also download the dashboard as a PDF, PNG, or JPEG, embed it on a platform, or invite your team to collaborate.
Note: This is a Pro template. You’ll need a Pro subscription on Mokkup to use and customize this dashboard wireframe. Upgrade anytime to unlock full access.
Natural Gas Distribution Energy Trading Dashboard Example
A typical natural gas trading operations dashboard presents a mix of KPIs and visuals to monitor trading and distribution performance. At the top level, KPIs such as total gas procured and procurement cost provide insights into sourcing efficiency. Demand fulfillment rate indicates how effectively customer demand is met, while system imbalance volume highlights supply-demand mismatches. Visuals such as procurement mix by supply source show dependency on long-term contracts, spot purchases, and LNG imports. Allocation efficiency heatmaps help analyze how effectively gas is distributed across customer segments like industrial, commercial, and residential users.
Infrastructure capacity utilization highlights how well assets such as pipelines, LNG terminals, and storage facilities are used. Trend charts such as monthly gas demand and market vs contract price trends provide insights into consumption patterns and pricing dynamics. This natural gas pricing analytics dashboard enables utilities to align procurement strategies with market conditions and improve trading outcomes.
How to Analyze Data in Natural Gas Distribution Energy Trading Dashboard
Here is how you can analyze data from this dashboard:
- Supply Volume Assessment: Start with total gas procured to understand overall supply volume.
- Procurement Cost Analysis: Analyze weighted average procurement cost to evaluate sourcing efficiency.
- Price Benchmark Comparison: Compare market price vs contract price trends to identify cost optimization opportunities.
- Demand Fulfillment Monitoring: Monitor demand fulfillment rate (%) to ensure customer demand is consistently met.
- Imbalance Detection: Evaluate system imbalance volume to detect supply-demand mismatches.
- Storage Utilization Tracking: Track storage fill level (%) to assess inventory readiness and flexibility.
- Penalty Cost Evaluation: Analyze imbalance penalty cost (USD) to understand the financial impact of inefficiencies.
- Procurement Mix Review: Review procurement mix by supply source to identify dependency on contract types.
- Allocation Efficiency Analysis: Evaluate allocation efficiency by customer segment to ensure optimal distribution.
- Infrastructure Utilization Monitoring: Monitor infrastructure capacity utilization (%) to optimize asset usage.
- Demand Trend Analysis: Analyze monthly gas demand trends to support accurate forecasting.
Benefits of Natural Gas Distribution Energy Trading Dashboard
The following are the benefits of using this dashboard:
- Centralized Trading Visibility: Provides a unified view of gas trading and procurement performance.
- Cost Optimization: Improves cost control through procurement and pricing insights.
- Balanced Supply Planning: Enables better supply-demand alignment and forecasting.
- Reduced Financial Risk: Minimizes imbalance penalties and associated costs.
- Optimized Sourcing Strategy: Supports efficient gas procurement decisions.
- Improved Allocation Efficiency: Enhances distribution across customer segments.
- Better Asset Utilization: Maximizes use of pipeline, storage, and LNG infrastructure.
- Data-Driven Trading Decisions: Enables informed decisions using market trends.
- Operational Efficiency: Strengthens responsiveness and execution in trading operations.
- Profitability Improvement: Drives overall financial performance of gas distribution operations.
KPIs to Track in Natural Gas Distribution Energy Trading Dashboard
The following key KPIs can be tracked by using this dashboard:
- Total Gas Procured (MMSCM): Tracks total volume of gas sourced across all supply channels
- Weighted Avg Procurement Cost (USD/MMBtu): Measures average cost of gas procurement
- Demand Fulfillment Rate (%): Indicates how effectively demand is met across customer segments
- System Imbalance Volume (MMSCM): Measures mismatch between supply and demand
- Storage Fill Level (%): Tracks available storage capacity utilization
- Imbalance Penalty Cost (USD): Quantifies financial impact of supply-demand imbalance
- Procurement Mix by Supply Source (%): Shows distribution of sourcing across contracts and markets
- Allocation Efficiency (%): Measures efficiency of gas distribution across customer segments
- Infrastructure Capacity Utilization (%): Indicates usage efficiency of pipelines, terminals, and storage
- Monthly Gas Demand (MMSCM): Tracks demand trends over time
- Market vs Contract Price ($/MMBtu): Compares market prices with contract prices for cost optimization
Frequently Asked Questions
Q1. What is the purpose of a gas distribution energy trading dashboard?
It helps utilities monitor procurement, pricing, and demand fulfillment to optimize trading performance and reduce costs.
Q2. How does this dashboard improve cost efficiency?
By comparing procurement costs with market prices and identifying better sourcing opportunities.
Q3. What is system imbalance in gas trading?
It is the difference between gas supplied and gas consumed, which can lead to penalties if not managed properly.