
What is a Natural Gas Distribution CSR & Public Outreach Dashboard?
A natural gas CSR performance dashboard is a centralized analytics tool used by gas utilities to track, measure, and optimize corporate social responsibility (CSR) initiatives and public outreach programs. It consolidates data across community engagement activities, media sentiment, grievance handling, campaign reach, and CSR investments into a single view. This gas distribution public outreach dashboard helps utilities understand how effectively they engage with communities, manage stakeholder relationships, and improve brand perception. It integrates operational metrics such as outreach program count, grievance resolution rate, and engagement levels with financial indicators like CSR spend. In addition, a gas utility CSR analytics dashboard enables performance monitoring across regions, program types, and communication channels. It supports data-driven decisions to improve social impact, regulatory alignment, and public trust.
How to Create a Natural Gas Distribution CSR & Public Outreach Dashboard
You don’t need to build your report from scratch, just start with a ready-to-use dashboard template from Mokkup. Add in your data and export it however you like. Here’s how to do it:
1. Create or Log in to Your Mokkup Account
Start by signing up on Mokkup.ai using your email. If you already have an account, just log in, and you’ll be good to go.
2. Choose and Customize Your Dashboard Template
Find the Natural Gas Distribution CSR & Public Outreach Dashboard template in the Templates section. Use the drag-and-drop editor to adjust KPIs, edit filters, or add elements based on your data.
3. Export to Your BI Tool
Once your dashboard wireframe is ready, use the BI Tool Export feature to send it directly to Power BI or Tableau for further analysis and enhancements. You can also download the dashboard as a PDF, PNG, or JPEG, embed it on a platform, or invite your team to collaborate.
Note: This is a Pro template. You’ll need a Pro subscription on Mokkup to use and customize this dashboard wireframe. Upgrade anytime to unlock full access.
Natural Gas Distribution CSR & Public Outreach Dashboard
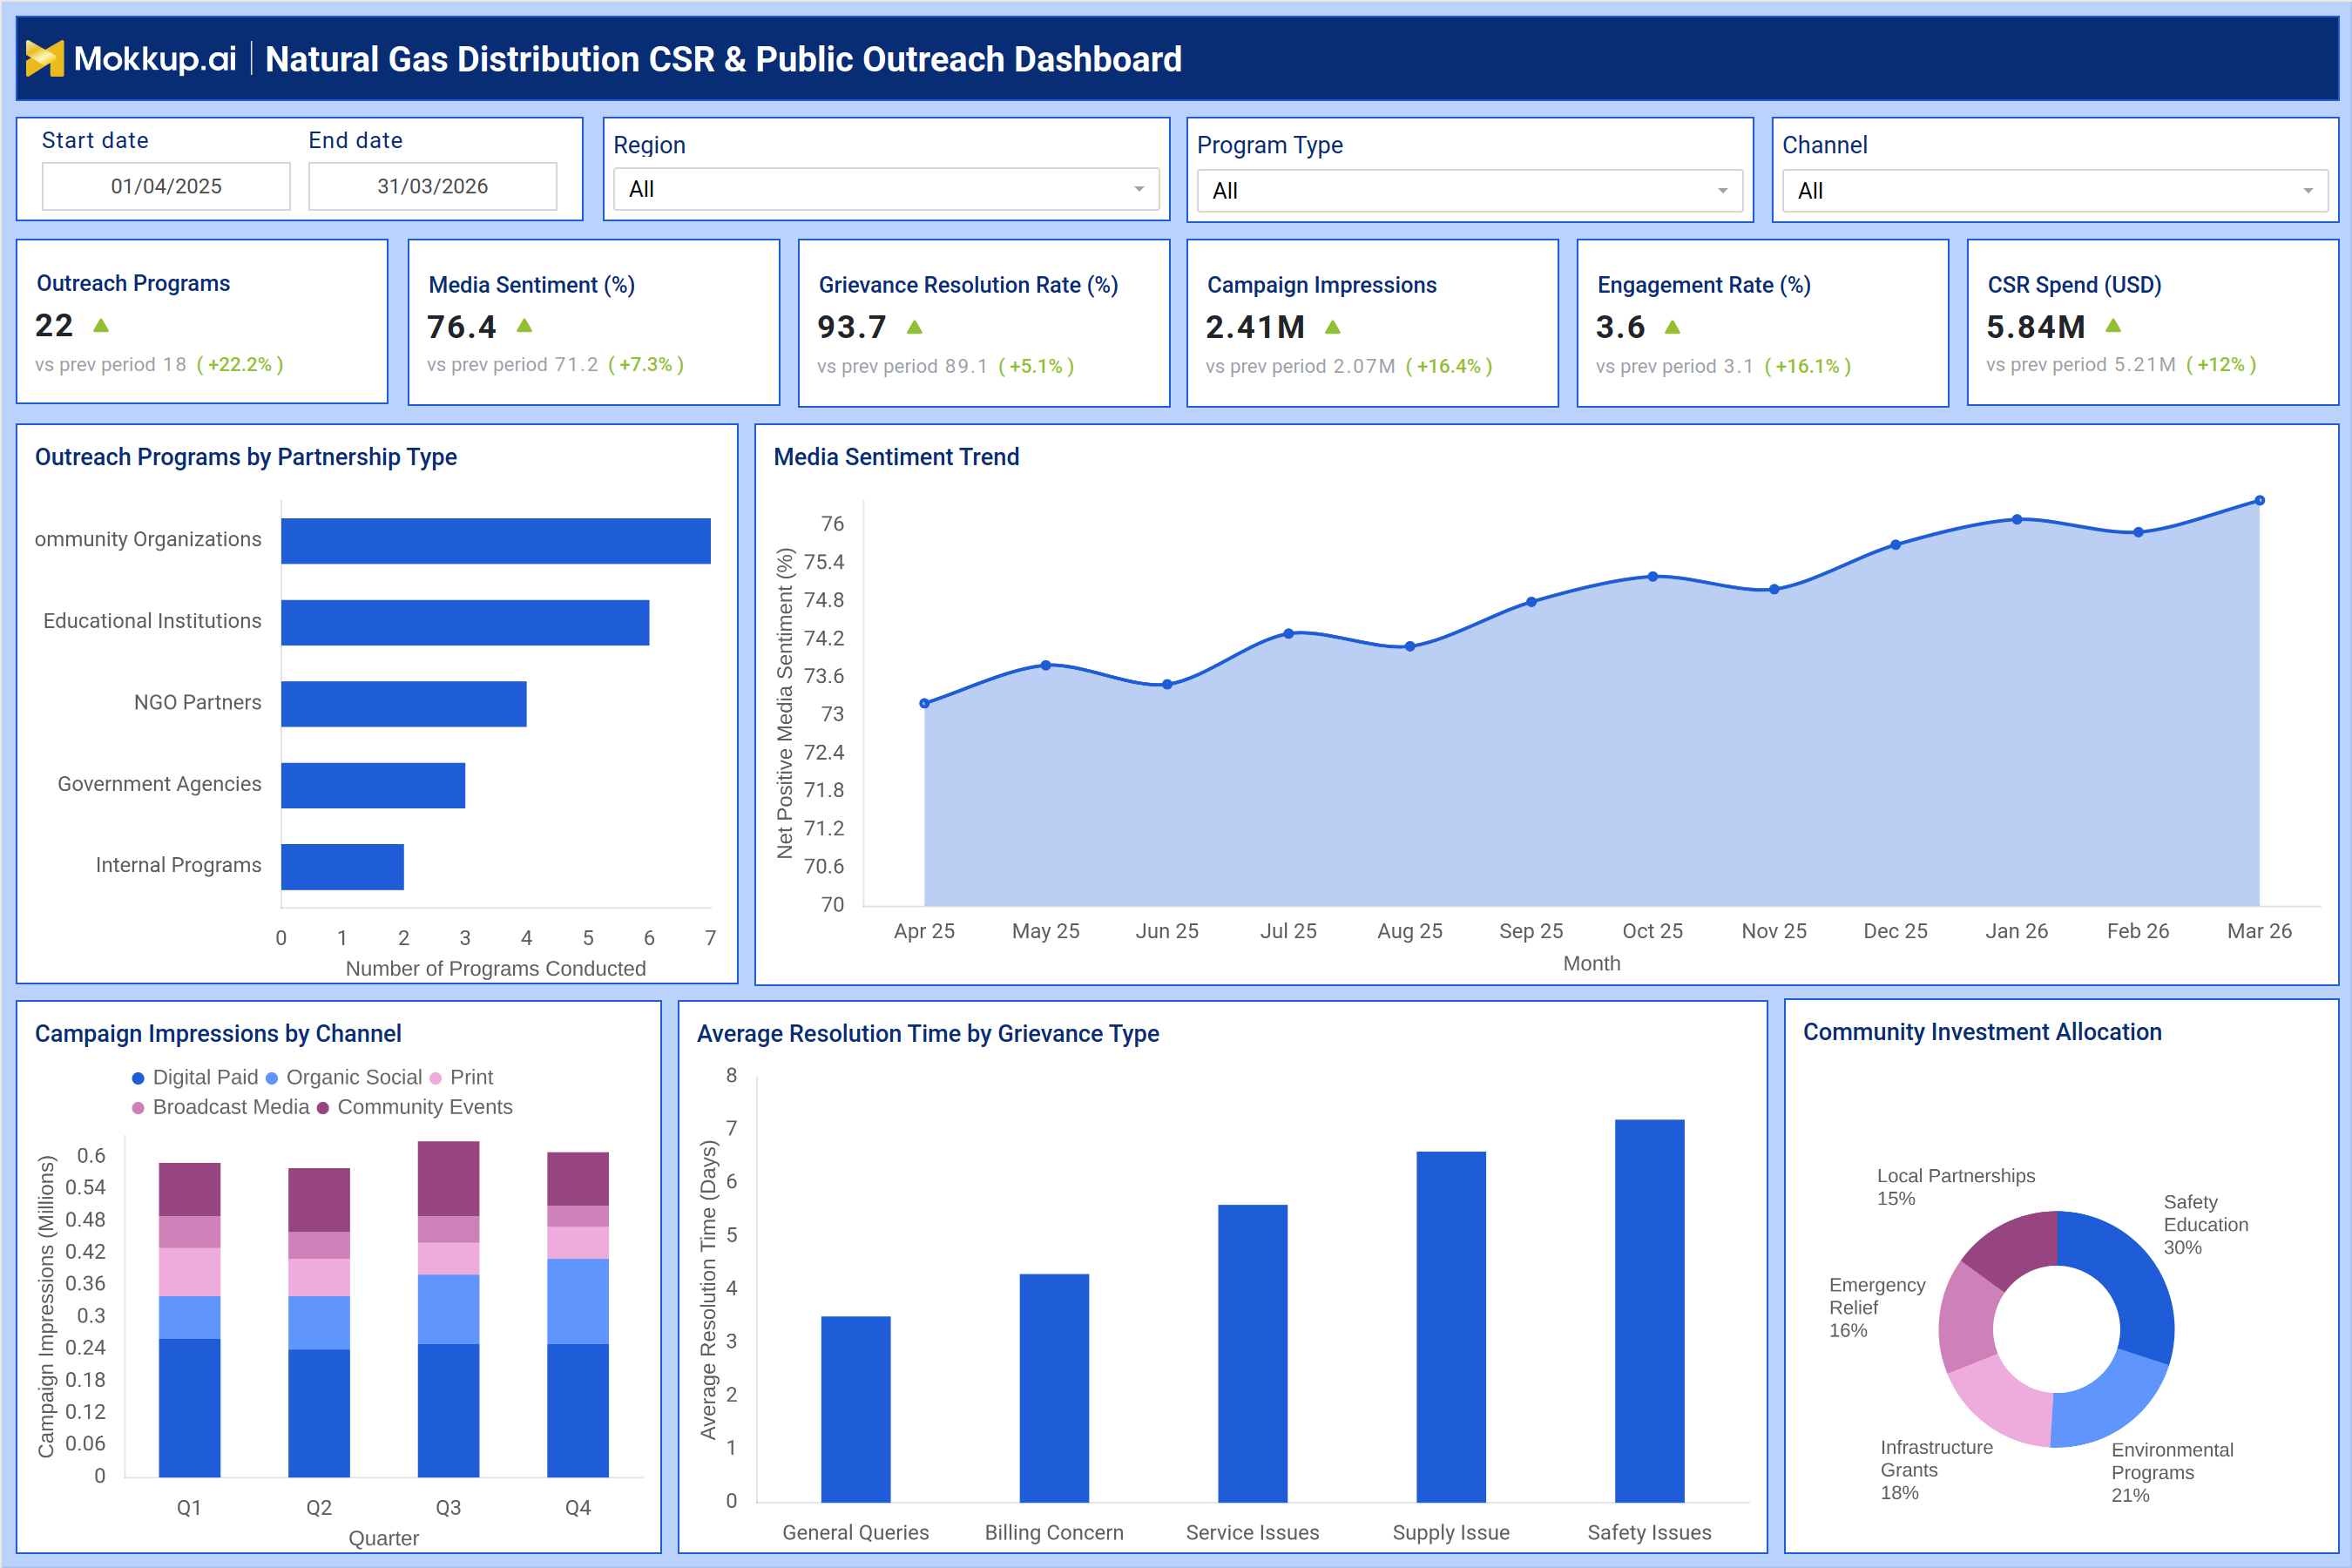
A typical natural gas community engagement dashboard provides a structured view of outreach and CSR performance across multiple dimensions. For example, the dashboard highlights key KPIs such as outreach programs conducted, media sentiment score, grievance resolution rate, campaign impressions, engagement rate, and total CSR spend. Users can filter data by region, program type, and communication channel to evaluate performance across different operational areas. The dashboard also includes visual insights such as outreach programs by partnership type, showing collaboration with community organizations, educational institutions, NGOs, and government agencies.
Trend analysis plays a critical role. Media sentiment trends over time indicate how public perception evolves based on outreach initiatives. Campaign impressions by channel help identify the most effective communication platforms, such as digital media, broadcast, or community events. Operational efficiency is tracked through grievance resolution metrics, including average resolution time by issue type. Finally, CSR investment allocation is visualized to show how funds are distributed across safety education, environmental programs, infrastructure support, and emergency relief. This gas distribution social impact dashboard enables utilities to align CSR strategies with measurable outcomes and stakeholder expectations.
How to Analyze Data in Natural Gas Distribution CSR & Public Outreach Dashboard
Here is how you can analyze data from this dashboard:
- Evaluate outreach program growth trends to assess expansion of community initiatives
- Compare media sentiment trends to measure improvement in public perception
- Analyze grievance resolution rate and resolution time to identify service gaps
- Track campaign impressions by channel to identify high-performing outreach platforms
- Compare engagement rates across campaigns to optimize communication strategies
- Assess CSR spend versus engagement outcomes to measure return on social investment
- Analyze partnership distribution to identify the most effective collaboration models
- Review community investment allocation to ensure alignment with strategic priorities
- Identify regional variations in outreach performance for targeted improvements
- Correlate outreach activities with sentiment and engagement metrics
Benefits of Natural Gas Distribution CSR & Public Outreach Dashboard
The following are the benefits of using this dashboard:
- Improves visibility into CSR and outreach performance across regions and programs
- Enables data-driven decision-making for community engagement strategies
- Enhances stakeholder trust through measurable and transparent reporting
- Optimizes allocation of CSR budgets based on impact and performance
- Identifies gaps in grievance handling and service responsiveness
- Improves campaign effectiveness by tracking channel-wise performance
- Supports regulatory and ESG reporting requirements
- Aligns outreach initiatives with corporate sustainability goals
- Enhances collaboration with external partners and community organizations
- Strengthens brand reputation through continuous sentiment monitoring
KPIs to Track in Natural Gas Distribution CSR & Public Outreach Dashboard
The following key KPIs can be tracked by using this dashboard:
- Outreach Programs Conducted – Tracks the total number of CSR and outreach initiatives executed across regions
- Media Sentiment (%) – Measures public perception based on media coverage and sentiment analysis
- Grievance Resolution Rate (%) – Indicates the percentage of customer or community issues resolved successfully
- Campaign Impressions – Tracks total reach of outreach campaigns across communication channels
- Engagement Rate (%) – Measures audience interaction with campaigns, including clicks, participation, and responses
- CSR Spend (USD) – Monitors total investment in CSR activities and outreach programs
- Outreach Programs by Partnership Type – Evaluates collaboration effectiveness across NGOs, institutions, and agencies
- Campaign Impressions by Channel – Identifies performance across digital, print, broadcast, and events
- Average Resolution Time by Grievance Type – Tracks efficiency in handling different issue categories
- Community Investment Allocation (%) – Shows distribution of CSR funds across key focus areas
Frequently Asked Questions
1. Why is a natural gas CSR performance dashboard important?
It provides a structured way to track CSR impact, improve transparency, and align outreach programs with business and regulatory goals.
2. How does a gas distribution public outreach dashboard improve engagement?
It identifies high-performing channels and programs, enabling utilities to focus on strategies that deliver better community interaction.
3. What insights can a gas utility CSR analytics dashboard provide?
It offers insights into sentiment trends, campaign performance, grievance handling efficiency, and CSR investment impact.