What is a Natural Gas Distribution & City Gate Performance Dashboard?
A Natural Gas Distribution & City Gate Performance Dashboard is a centralized analytics tool that monitors the efficiency, safety, and operational performance of natural gas distribution networks. It consolidates key metrics from city gate stations where high-pressure transmission pipelines reduce pressure for local distribution into a single view. This dashboard helps utilities track natural gas flow measurement techniques, pressure regulation, leak repairs, and unaccounted for gas (UFG) rates to ensure reliable and cost-effective distribution. By integrating data from city gate station monitoring, pipeline sensors, and customer outage reports, the dashboard provides actionable insights for optimizing natural gas pipeline performance. Utility operators use it to detect inefficiencies, reduce downtime, and improve energy efficiency improvements in natural gas distribution.
How to Create a Natural Gas Distribution & City Gate Performance Dashboard
You don't need to build your report from scratch, just start with a ready-to-use dashboard template from Mokkup. Add in your data and export it however you like. Here's how to do it:
1. Create or Log in to Your Mokkup Account
Start by signing up on Mokkup.ai using your email. If you already have an account, just log in, and you'll be good to go.
2. Choose and Customize Your Dashboard Template
Find the Natural Gas Distribution & City Gate Performance Dashboard template in the Templates section. Use the drag-and-drop editor to adjust KPIs, edit filters, or add elements based on your data.
3. Export to Your BI Tool
Once your dashboard wireframe is ready, use the BI Tool Export feature to send it directly to Power BI or Tableau for further analysis and enhancements. You can also download the dashboard as a PDF, PNG, or JPEG, embed it on a platform, or invite your team to collaborate.
Note: This is a Pro template. You'll need a Pro subscription on Mokkup to use and customize this dashboard wireframe. Upgrade anytime to unlock full access.
Natural Gas Distribution & City Gate Performance Dashboard Example
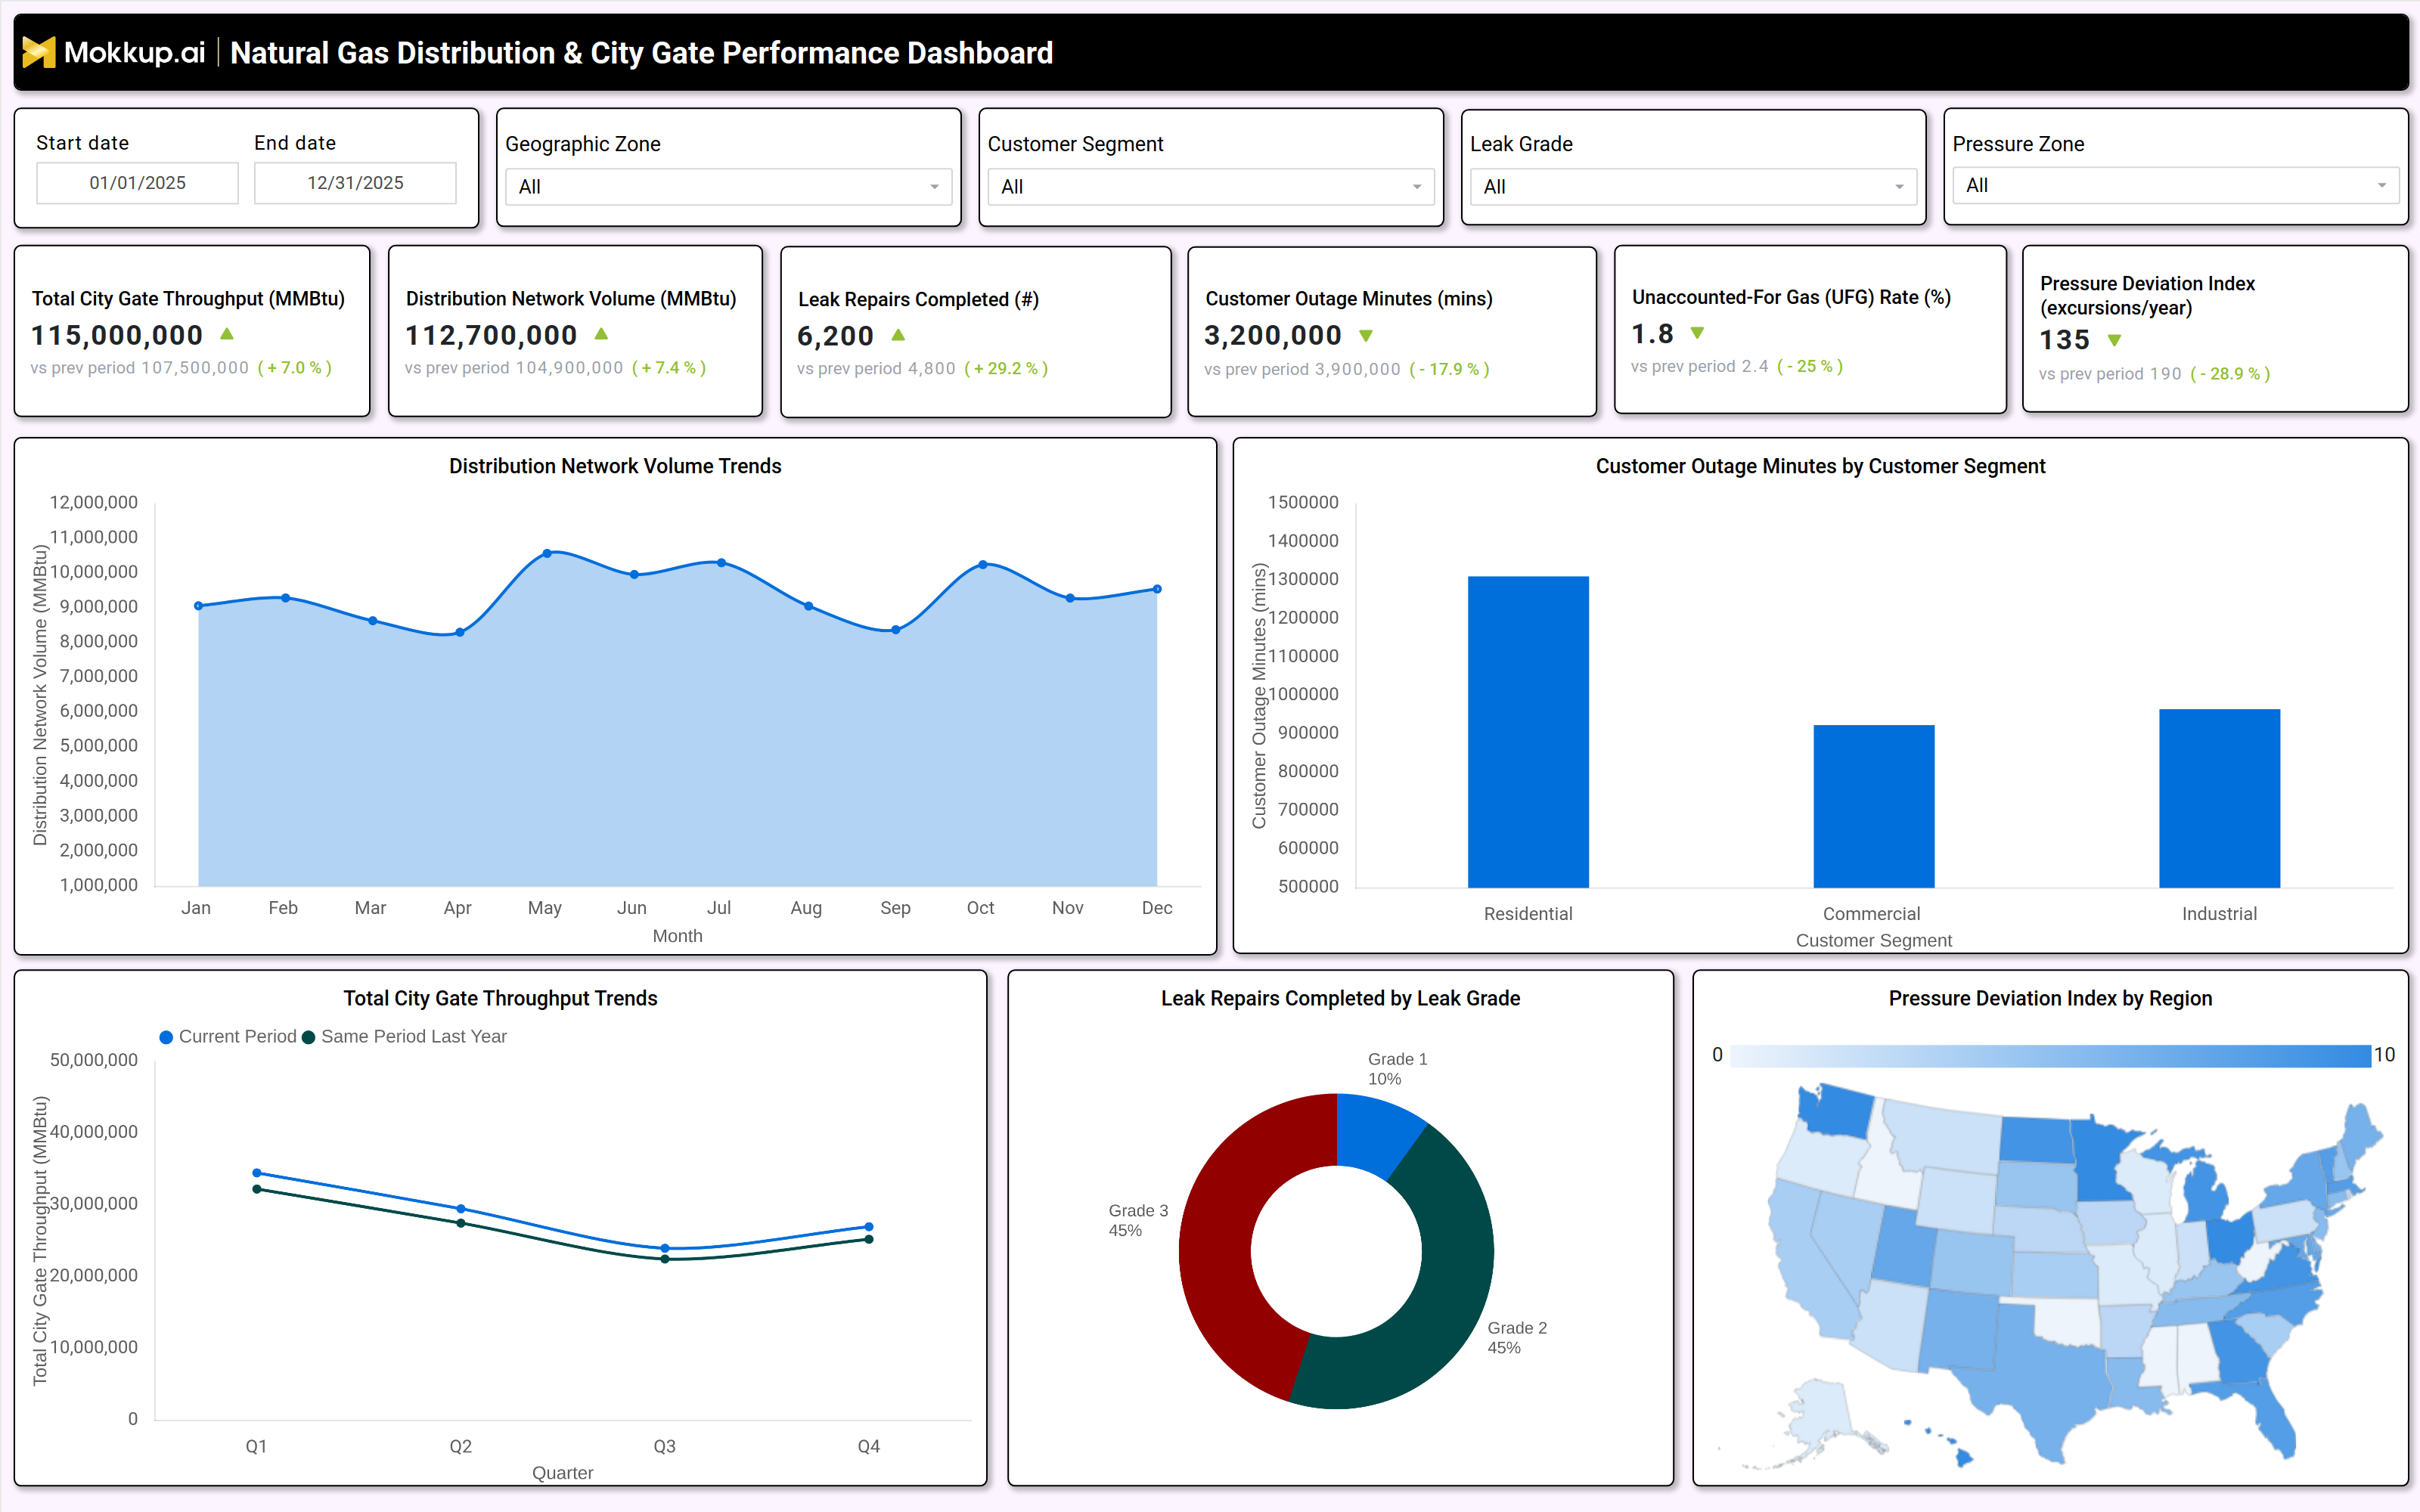
A typical natural gas distribution & city gate performance dashboard includes interactive filters for date ranges, geographic zones, customer segments, leak grades, and pressure zones. Key performance tiles display total city gate throughput (MMBtu), distribution network volume (MMBtu), leak repairs completed, customer outage minutes, unaccounted for gas (UFG) rate, and pressure deviation index. Trend charts compare current performance against historical data, showing distribution network volume trends and city gate throughput fluctuations by quarter. A leak repair breakdown by grade (Grade 1, 2, 3) helps prioritize maintenance, while a pressure deviation map highlights regions with frequent pressure excursions. Customer outage minutes are segmented by residential, commercial, and industrial users to identify service reliability gaps. Together, these components form a city gate station monitoring for gas utilities system that enables data-driven decision-making.
How to Analyze Data in a Natural Gas Distribution & City Gate Performance Dashboard
Here is how you can analyze data from this dashboard:
- Monitor Total City Gate Throughput: Assess pipeline capacity utilization and track natural gas demand trends across the distribution network.
- Track Distribution Network Volume: Analyze gas distribution volumes to identify seasonal consumption patterns and regional demand variations.
- Review Leak Repairs by Grade: Monitor completed leak repairs by severity level to prioritize maintenance activities and address high-risk pipeline segments.
- Analyze Customer Outage Minutes by Segment: Evaluate outage durations across customer segments to improve service reliability, especially for critical users.
- Measure Unaccounted-for Gas (UFG) Rate: Identify gas losses, leaks, theft, or metering inefficiencies that impact operational performance and revenue.
- Evaluate Pressure Deviation Index: Track pressure fluctuations within the network to prevent safety risks and maintain stable gas delivery.
- Compare Current and Historical Performance: Benchmark operational metrics against historical data to identify improvements, declines, and long-term performance trends.
- Use Geographic Filters for Regional Analysis: Assess regional differences in natural gas distribution performance to support targeted operational improvements and resource allocation.
Benefits of a Natural Gas Distribution & City Gate Performance Dashboard
The following are the benefits of using this utility operational efficiency dashboard:
- Enhances Pipeline Efficiency: Tracks natural gas flow measurements and Unaccounted-for Gas (UFG) rates to improve pipeline performance and operational efficiency.
- Improves Safety and Risk Management: Enables real-time monitoring of city gate stations and leak detection to enhance safety and reduce operational risks.
- Reduces Operational Costs: Optimizes pressure regulation and minimizes gas losses, improving cost efficiency across pipeline operations.
- Boosts Service Reliability: Analyzes customer outage trends and pressure deviations to maintain a consistent gas supply and improve service quality.
- Supports Regulatory Compliance: Simplifies compliance reporting by providing accurate data on leak repairs, pipeline performance, and operational metrics.
- Enables Data-Driven Maintenance Planning: Identifies high-risk pipeline segments and infrastructure vulnerabilities to support proactive maintenance strategies.
- Optimizes Workforce Allocation: Uses leak repair activities and outage response data to improve workforce planning and resource deployment efficiency.
KPIs to Track in a Natural Gas Distribution & City Gate Performance Dashboard
The following key KPIs can be tracked by using this gas leak detection dashboard:
- Total City Gate Throughput (MMBtu): Measures the volume of natural gas entering the distribution network.
- Distribution Network Volume (MMBtu): Tracks the total gas delivered to end users.
- Leak Repairs Completed (count): Counts the number of pipeline leaks fixed, segmented by severity (Grade 1, 2, 3).
- Customer Outage Minutes (mins): Measures service disruptions by customer segment (residential, commercial, industrial).
- Unaccounted For Gas Rate (%): Indicates gas losses due to leaks, theft, or measurement errors.
- Pressure Deviation Index (excursions/year): Tracks instances of abnormal pressure levels in the distribution network.
Frequently Asked Questions
1. What is a natural gas distribution dashboard used for?
It provides city gate station monitoring, leak detection, and pressure regulation insights to optimize pipeline efficiency and reduce downtime.
2. What data sources feed into this city gate performance dashboard?
Pipeline sensors, SCADA systems, leak detection reports, customer outage logs, and pressure monitoring tools.
3. Who should use a pipeline pressure monitoring dashboard?
Utility operators, pipeline engineers, regulatory compliance teams, and energy efficiency analysts.