
What is a Natural Gas Distribution and City Gate Facility Operations Dashboard?
A natural gas distribution operations dashboard is a business intelligence tool used to monitor and manage the performance of gas distribution networks and city gate facilities. It provides visibility into operational metrics such as station uptime, compression efficiency, capacity utilization, and maintenance performance. This city gate facility operations dashboard helps utilities ensure consistent gas supply, maintain system reliability, and optimize operational efficiency. The dashboard integrates data from SCADA systems, maintenance logs, and operational platforms to deliver a unified view of network performance. A natural gas city gate monitoring dashboard enables operators to track facility availability, detect downtime patterns, and analyze cost efficiency across stations. It plays a critical role in improving infrastructure utilization, reducing operational risks, and supporting data-driven decision-making in gas utilities.
How to Create a Natural Gas Distribution and City Gate Facility Operations Dashboard
You don’t need to build your report from scratch, just start with a ready-to-use dashboard template from Mokkup. Add in your data and export it however you like. Here’s how to do it:
1. Create or Log in to Your Mokkup Account
Start by signing up on Mokkup.ai using your email. If you already have an account, just log in, and you’ll be good to go.
2. Choose and Customize Your Dashboard Template
Find the Natural Gas Distribution and City Gate Facility Operations Dashboard template in the Templates section. Use the drag-and-drop editor to adjust KPIs, edit filters, or add elements based on your data.
3. Export to Your BI Tool
Once your dashboard wireframe is ready, use the BI Tool Export feature to send it directly to Power BI or Tableau for further analysis and enhancements. You can also download the dashboard as a PDF, PNG, or JPEG, embed it on a platform, or invite your team to collaborate.
Note: This is a Pro template. You’ll need a Pro subscription on Mokkup to use and customize this dashboard wireframe. Upgrade anytime to unlock full access.
Natural Gas Distribution and City Gate Facility Operations Dashboard Example
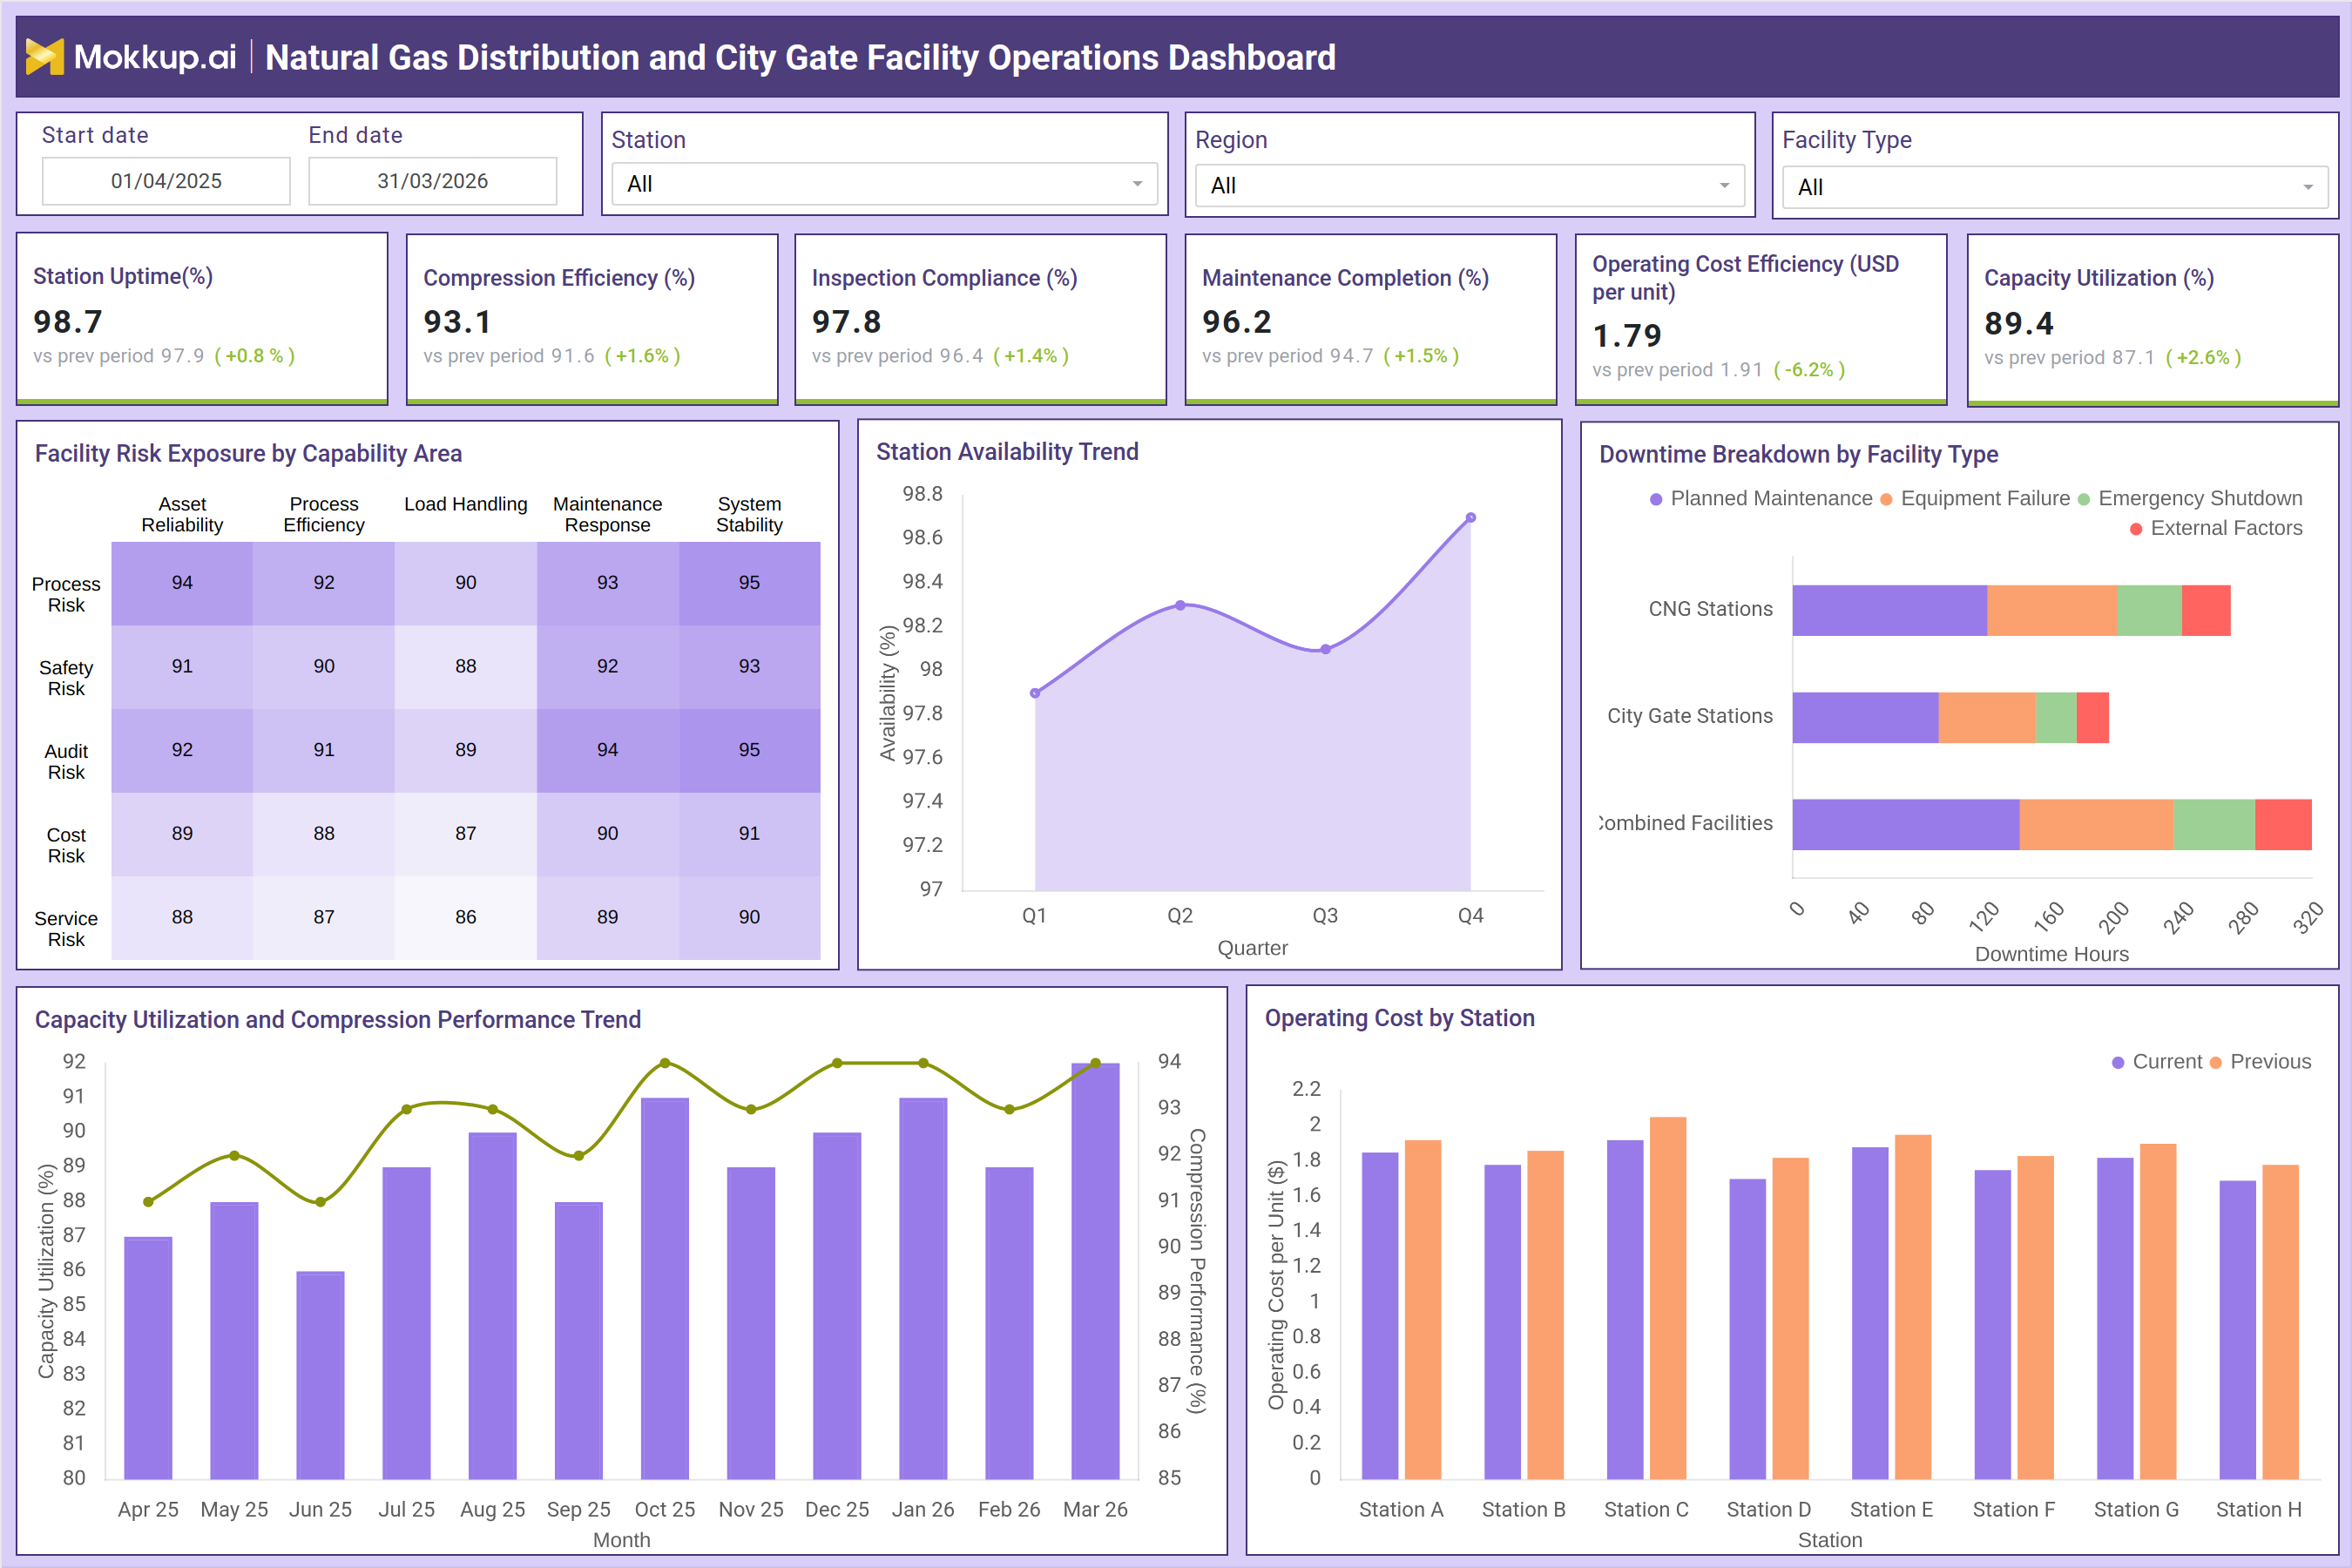
A typical gas distribution network operations dashboard presents key operational KPIs across stations, regions, and facility types. For example, the dashboard highlights station uptime at 98.7%, compression efficiency at 93.1%, and inspection compliance at 97.8%, indicating strong operational performance. Maintenance completion at 96.2% reflects effective asset management, while capacity utilization at 89.4% shows efficient infrastructure usage. The dashboard also includes a station availability trend, showing quarterly performance improvements, and a downtime breakdown by facility type, identifying causes such as planned maintenance, equipment failure, and external disruptions. This helps operators understand downtime drivers and take corrective actions. Risk exposure is analyzed through a capability-based heatmap covering process risk, safety risk, audit risk, and service risk across key operational areas. Additionally, cost analysis by station highlights variations in operating cost efficiency, enabling benchmarking and cost optimization. This gas utility distribution operations analytics approach ensures end-to-end visibility into distribution and city gate performance.
How to Analyze Data in Natural Gas Distribution and City Gate Facility Operations Dashboard
Here is how you can analyze data from this dashboard:
- Station Uptime Trends: Monitor uptime over time to ensure a consistent and reliable gas supply across all stations.
- Compression Efficiency: Analyze how effectively compressors are performing to optimize equipment efficiency and reduce energy waste.
- Inspection Compliance Rates: Track adherence to inspection schedules and standards to maintain regulatory compliance.
- Maintenance Completion Metrics: Evaluate how timely and effectively maintenance activities are completed to ensure proper asset upkeep.
- Capacity Utilization Trends: Identify underutilized infrastructure and optimize resource allocation across stations.
- Downtime Breakdown by Facility Type: Analyze downtime patterns across different facility types to uncover root causes and recurring issues.
- Station Availability Trends: Measure availability consistency to ensure stable and uninterrupted operations.
- Operating Cost Efficiency by Station: Compare costs across stations to identify inefficiencies and high-cost outliers.
- Risk Exposure Heatmaps: Visualize operational risks to proactively detect vulnerabilities and prioritize mitigation efforts.
- Downtime vs. Maintenance Correlation: Link downtime events with maintenance and performance data to understand cause-and-effect relationships.
Benefits of Natural Gas Distribution and City Gate Facility Operations Dashboard
The following are the benefits of using this dashboard:
- Improved Operational Visibility: Gain a clear, centralized view of gas distribution activities for better control and oversight.
- Enhanced Facility Performance Monitoring: Track performance across city gate stations to identify inefficiencies and optimize operations.
- Reduced Downtime & Disruptions: Detect issues early and take corrective actions to minimize operational interruptions.
- Data-Driven Maintenance Planning: Use performance insights to plan maintenance activities more effectively and prevent failures.
- Better Capacity Utilization: Optimize infrastructure usage by identifying underutilized assets and balancing load across stations.
- Cost Optimization Across Stations: Monitor and compare operating costs to identify savings opportunities and eliminate inefficiencies.
- Stronger Risk Identification & Mitigation: Proactively detect operational risks and implement strategies to reduce potential impact.
- Regulatory Compliance Assurance: Maintain compliance by tracking inspections and ensuring adherence to required standards.
- Centralized, Insight-Driven Decision-Making: Leverage unified analytics to make faster, more informed operational decisions.
- Proactive Monitoring with Dashboard Insights: Use city gate gas flow monitoring dashboards to identify trends, risks, and opportunities in real time.
KPIs to Track in Natural Gas Distribution and City Gate Facility Operations Dashboard
This dashboard allows you to track the following key KPIs:
- Station Uptime (%) – Measures the percentage of time stations are operational, indicating system reliability
- Compression Efficiency (%) – Tracks the performance of compressors in maintaining gas pressure and flow efficiency
- Inspection Compliance (%) – Measures adherence to scheduled inspections and regulatory requirements
- Maintenance Completion (%) – Indicates the percentage of completed maintenance activities against planned schedules
- Operating Cost Efficiency (USD per unit) – Tracks cost efficiency of operations across stations for benchmarking
- Capacity Utilization (%) – Measures how effectively infrastructure capacity is being used
- Facility Risk Exposure Score – Evaluates risk levels across process, safety, audit, and service dimensions
- Station Availability Trend (%) – Tracks availability performance over time to ensure consistency
- Downtime Hours by Facility Type – Measures total downtime and categorizes it by cause for root cause analysis
- Operating Cost by Station – Compares cost variations across stations to identify inefficiencies
Frequently Asked Questions
1. Why is a natural gas distribution operations dashboard important?
It provides insights into network performance, helping utilities improve reliability, efficiency, and operational control.
2. What is the role of a city gate facility operations dashboard?
It monitors gas flow, pressure, and operational performance at city gate stations to ensure consistent supply and system stability.
3. How does this dashboard improve operational efficiency?
By tracking performance metrics, identifying inefficiencies, and enabling proactive maintenance and cost optimization.