What is a Dental Finance & Revenue Dashboard?
A Dental Finance & Revenue Dashboard is a centralized tool that helps dental hospitals and clinics monitor and manage their financial performance in real time. It works like a healthcare dental finance analytics dashboard, consolidating revenue, costs, insurance claims, and patient acquisition data in a single interface, allowing administrators and finance teams to make informed decisions quickly. By integrating multiple data sources, the dashboard highlights key metrics such as total revenue, gross margin, and patient lifetime value.
This dashboard enables strategic financial planning by visualizing trends, forecasting revenue, and identifying high-value procedures. Visualizations like stacked column charts, waterfall charts, and heatmaps make complex financial data easy to interpret. For dental institutions, it provides actionable insights to optimize revenue streams, reduce costs, and improve overall operational efficiency.
How to Create a Dental Finance & Revenue Dashboard
You don’t need to build your report from scratch—just start with a ready-to-use Dental finance and revenue dashboard template from Mokkup. Add in your data and export it however you like. Here’s how to do it:
1. Create or Log in to Your Mokkup Account
Start by signing up on Mokkup.ai using your email. If you already have an account, just log in, and you’ll be good to go.
2. Choose and Customize Your Dashboard Template
Find the Dental Finance & Revenue Dashboard template in the Templates section. Use the drag-and-drop editor to adjust KPIs, edit filters, or add elements based on your data.
3. Export to Your BI Tool
Once your dashboard wireframe is ready, use the BI Tool Export feature to send it directly to Power BI or Tableau for further analysis and enhancements. You can also download the dashboard as a PDF, PNG, or JPEG, embed it on a platform, or invite your team to collaborate.
Note: This is a Pro template. You’ll need a Pro subscription on Mokkup to use and customize this dashboard wireframe. Upgrade anytime to unlock full access.
Dental Finance & Revenue Dashboard Example
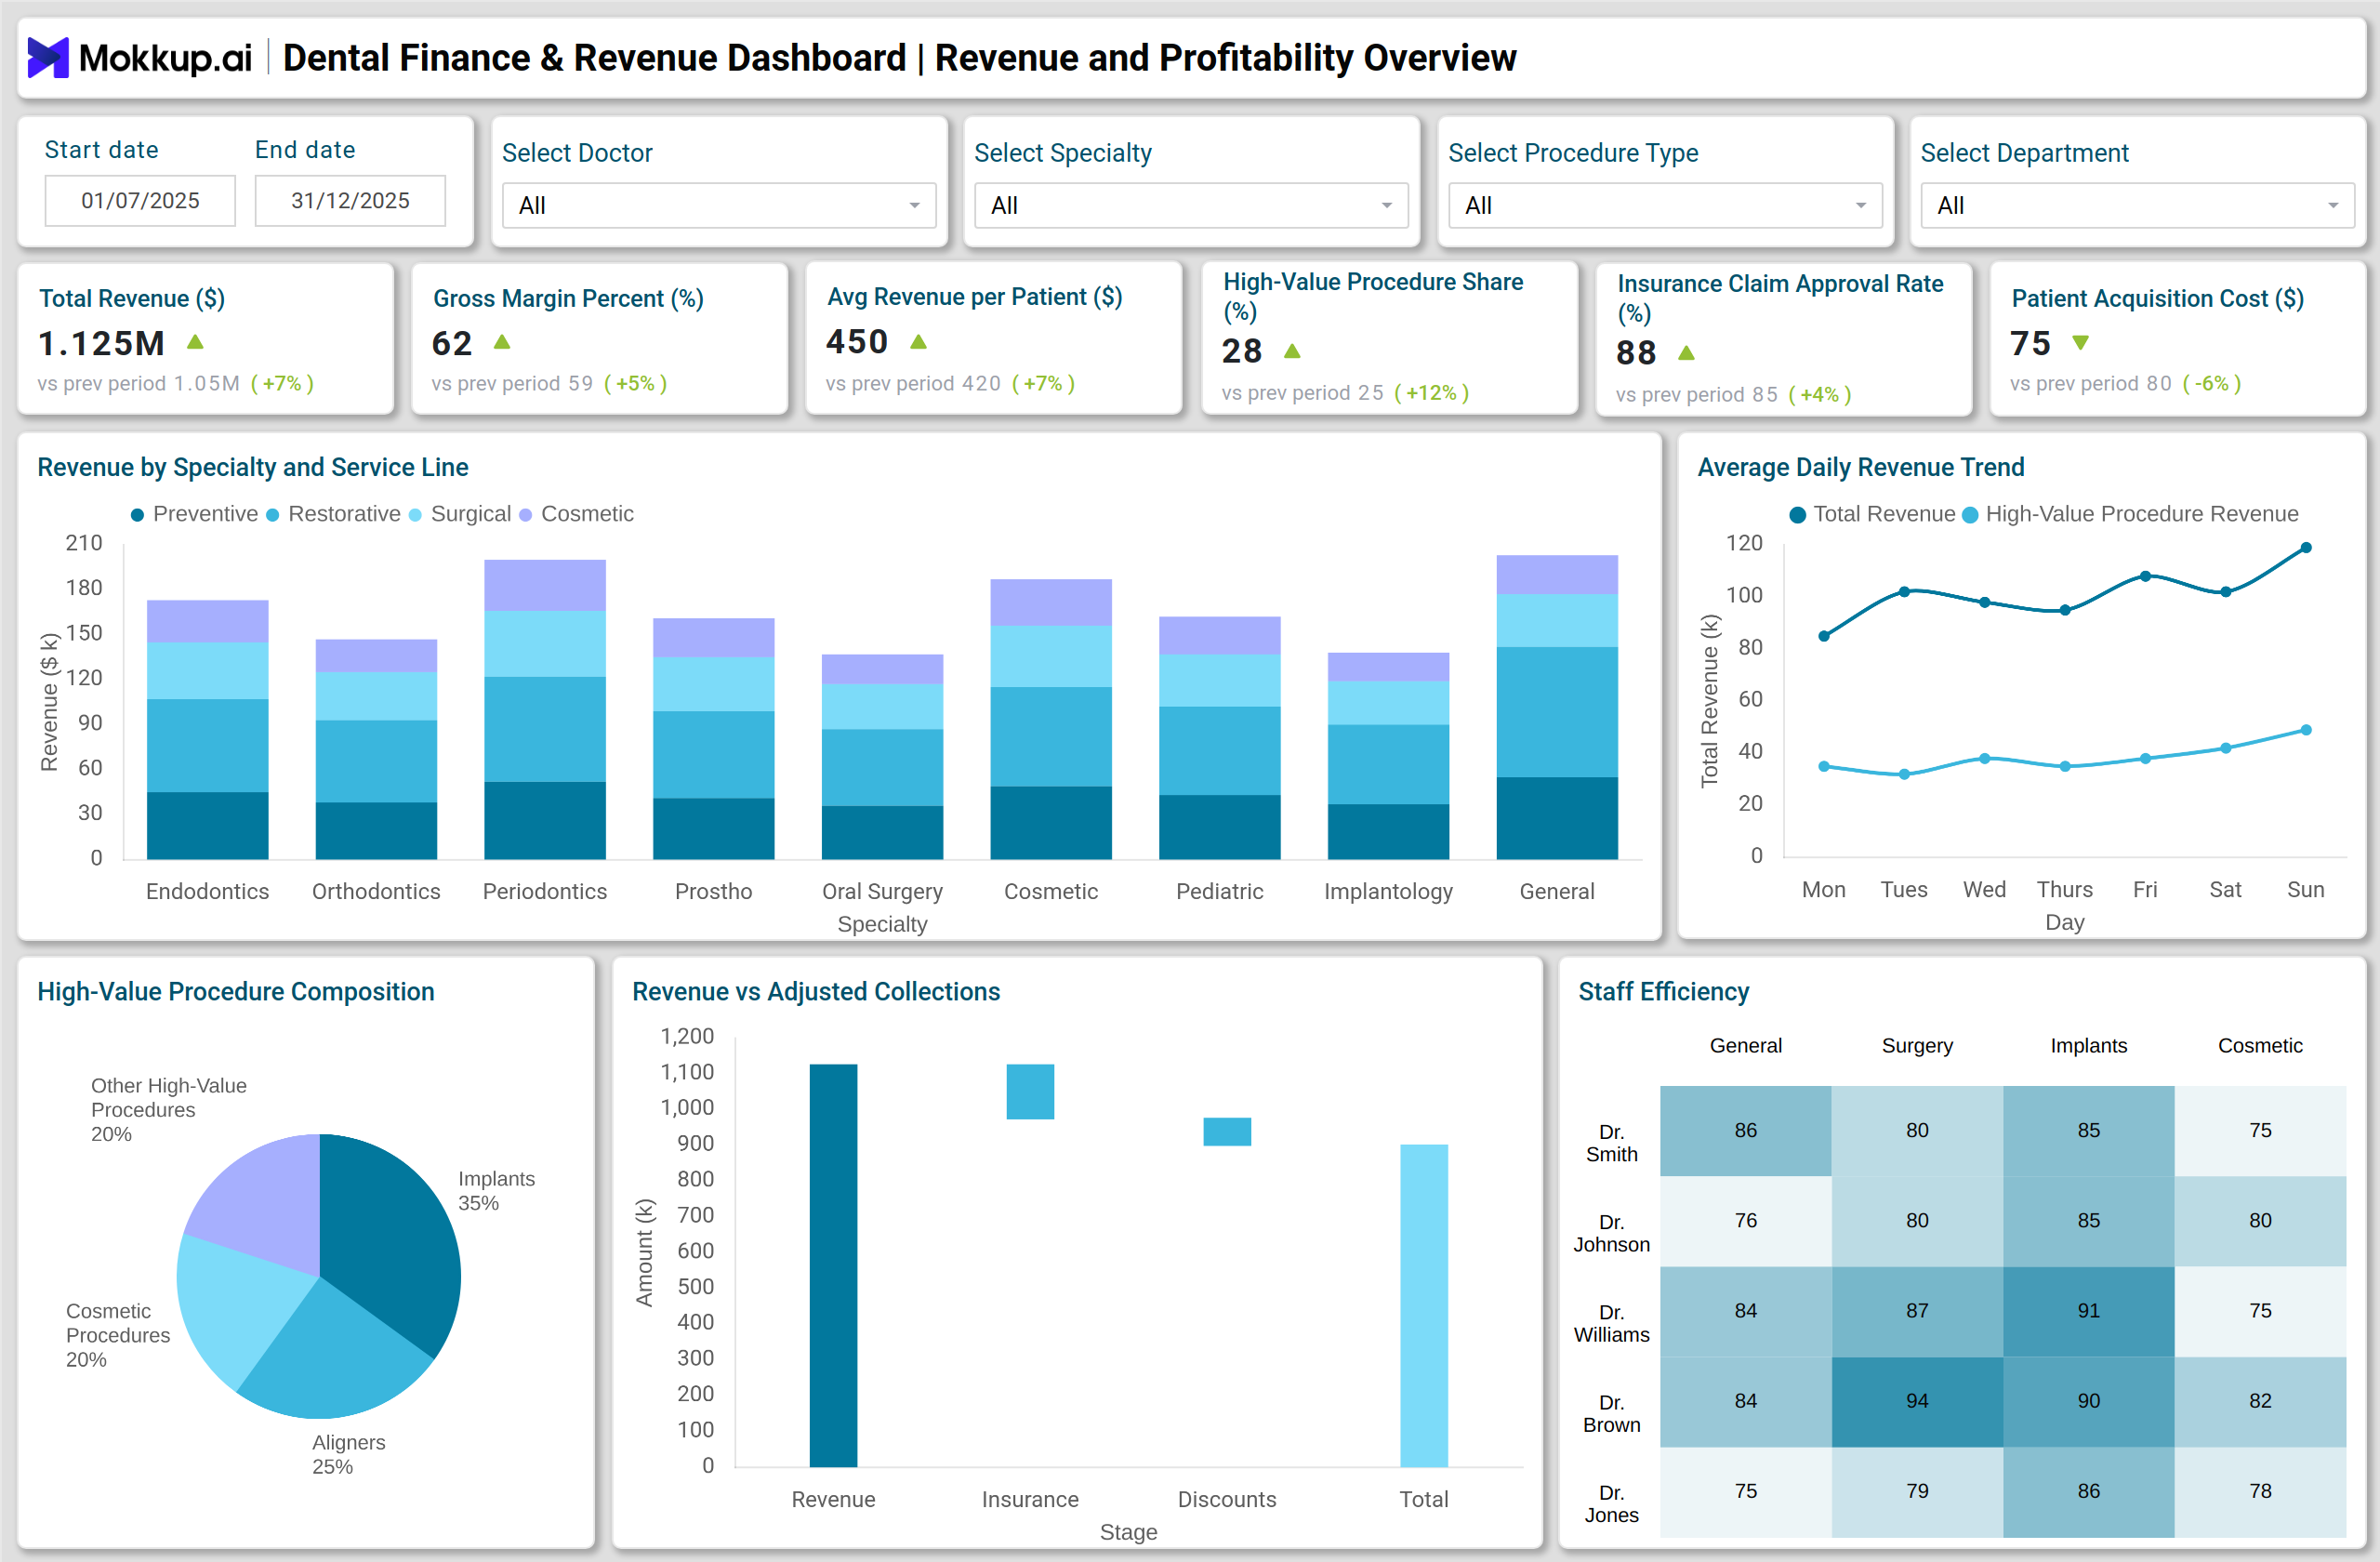
A Dental Finance & Revenue Dashboard typically brings together multiple views of a clinic’s financial performance in one place. It might start with a stacked column chart that breaks down revenue by specialty and service line to show which treatments drive the most income. Line charts can track daily revenue trends for both total earnings and high-value procedures, while pie or donut charts visualize how much revenue comes from different patient segments.
A waterfall chart helps compare total revenue with adjusted collections to reveal gaps in expected income. Heatmaps are often used to show staff wages as a percentage of collections, making it easier to manage labor costs. Funnel charts track patient acquisition and treatment conversion rates to highlight any drop-offs in the process. Combo charts can compare marketing spend with generated revenue, and stacked area charts separate income from insurance and self-pay patients. Finally, hierarchy tables display patient lifetime value alongside revenue from high-value procedures, helping shape targeted financial strategies.
How to Analyze Data in Dental Finance & Revenue Dashboards
To get real value from a dental finance analytics dashboard, focus on these core areas:
- Monitor Revenue Trends: Do a total and high-value procedure revenue analysis using line and area charts.
- Evaluate Procedure Performance: Identify which procedures contribute most to revenue and track conversion rates.
- Optimize Patient Acquisition Costs: Analyze cost per new patient and acquisition rates to improve marketing efficiency.
- Track Insurance Impact: Monitor approval and denial rates to reduce delays in reimbursements.
- Segment Revenue Streams: Compare revenue from insurance vs. self-pay and by patient segments to prioritize profitable areas.
- Assess Staff Efficiency: Heatmaps help evaluate wages relative to collections and identify areas to optimize labor costs.
- Forecast Financial Growth: Estimate patient lifetime value and future revenue using historical trends and high-value procedure data.
Benefits of Dental Finance & Revenue Dashboards
- Real-Time Financial Visibility: Access up-to-date revenue, costs, and margins instantly with a Real-time dental finance and revenue dashboard.
- Boost High-Value Procedures: Focus on services that generate maximum revenue.
- Improve Insurance Management: Reduce claim delays and denials to prevent revenue loss.
- Maximize Marketing ROI: Track revenue generated per marketing campaign to optimize spend.
- Reduce Operational Costs: Identify inefficiencies in staffing and workflow.
- Support Strategic Planning: Use predictive analytics to forecast revenue and plan growth.
- Increase Patient Lifetime Value: Focus on profitable patient segments and treatments.
KPIs to Track in Dental Finance & Revenue Dashboards
For effective dental practice revenue tracking, monitor these essential metrics:
- Total Revenue – overall income generated.
- Gross Margin (%) – profitability after deducting service costs.
- Average Revenue per Patient – revenue efficiency per patient.
- High-Value Procedure Share (%) – contribution of premium procedures to revenue.
- Insurance Claim Approval Rate (%) – percentage of approved insurance claims.
- Cost per New Patient – marketing and acquisition expenditure.
- New Patient Acquisition Rate – growth in patient inflow.
Frequently Asked Questions
1. Who should use a Dental Finance & Revenue Dashboard?
Dental administrators, finance managers, and executive teams in hospitals or clinics seeking a comprehensive view of revenue, costs, and patient metrics should use a Dental finance and revenue dashboard.
2. How frequently should the dashboard be updated?
Ideally, data should update in real time or daily to maintain accuracy for financial decision-making.
4. Which visuals are most effective for revenue tracking?
Line charts for daily trends, stacked area charts for insurance vs. self-pay, and waterfall charts for collections analysis.
5. How does this dashboard improve profitability?
By identifying high-value procedures, monitoring costs, optimizing patient acquisition, and reducing revenue leakage from denied insurance claims.