
What is a Mental Health Crisis Management Dashboard?
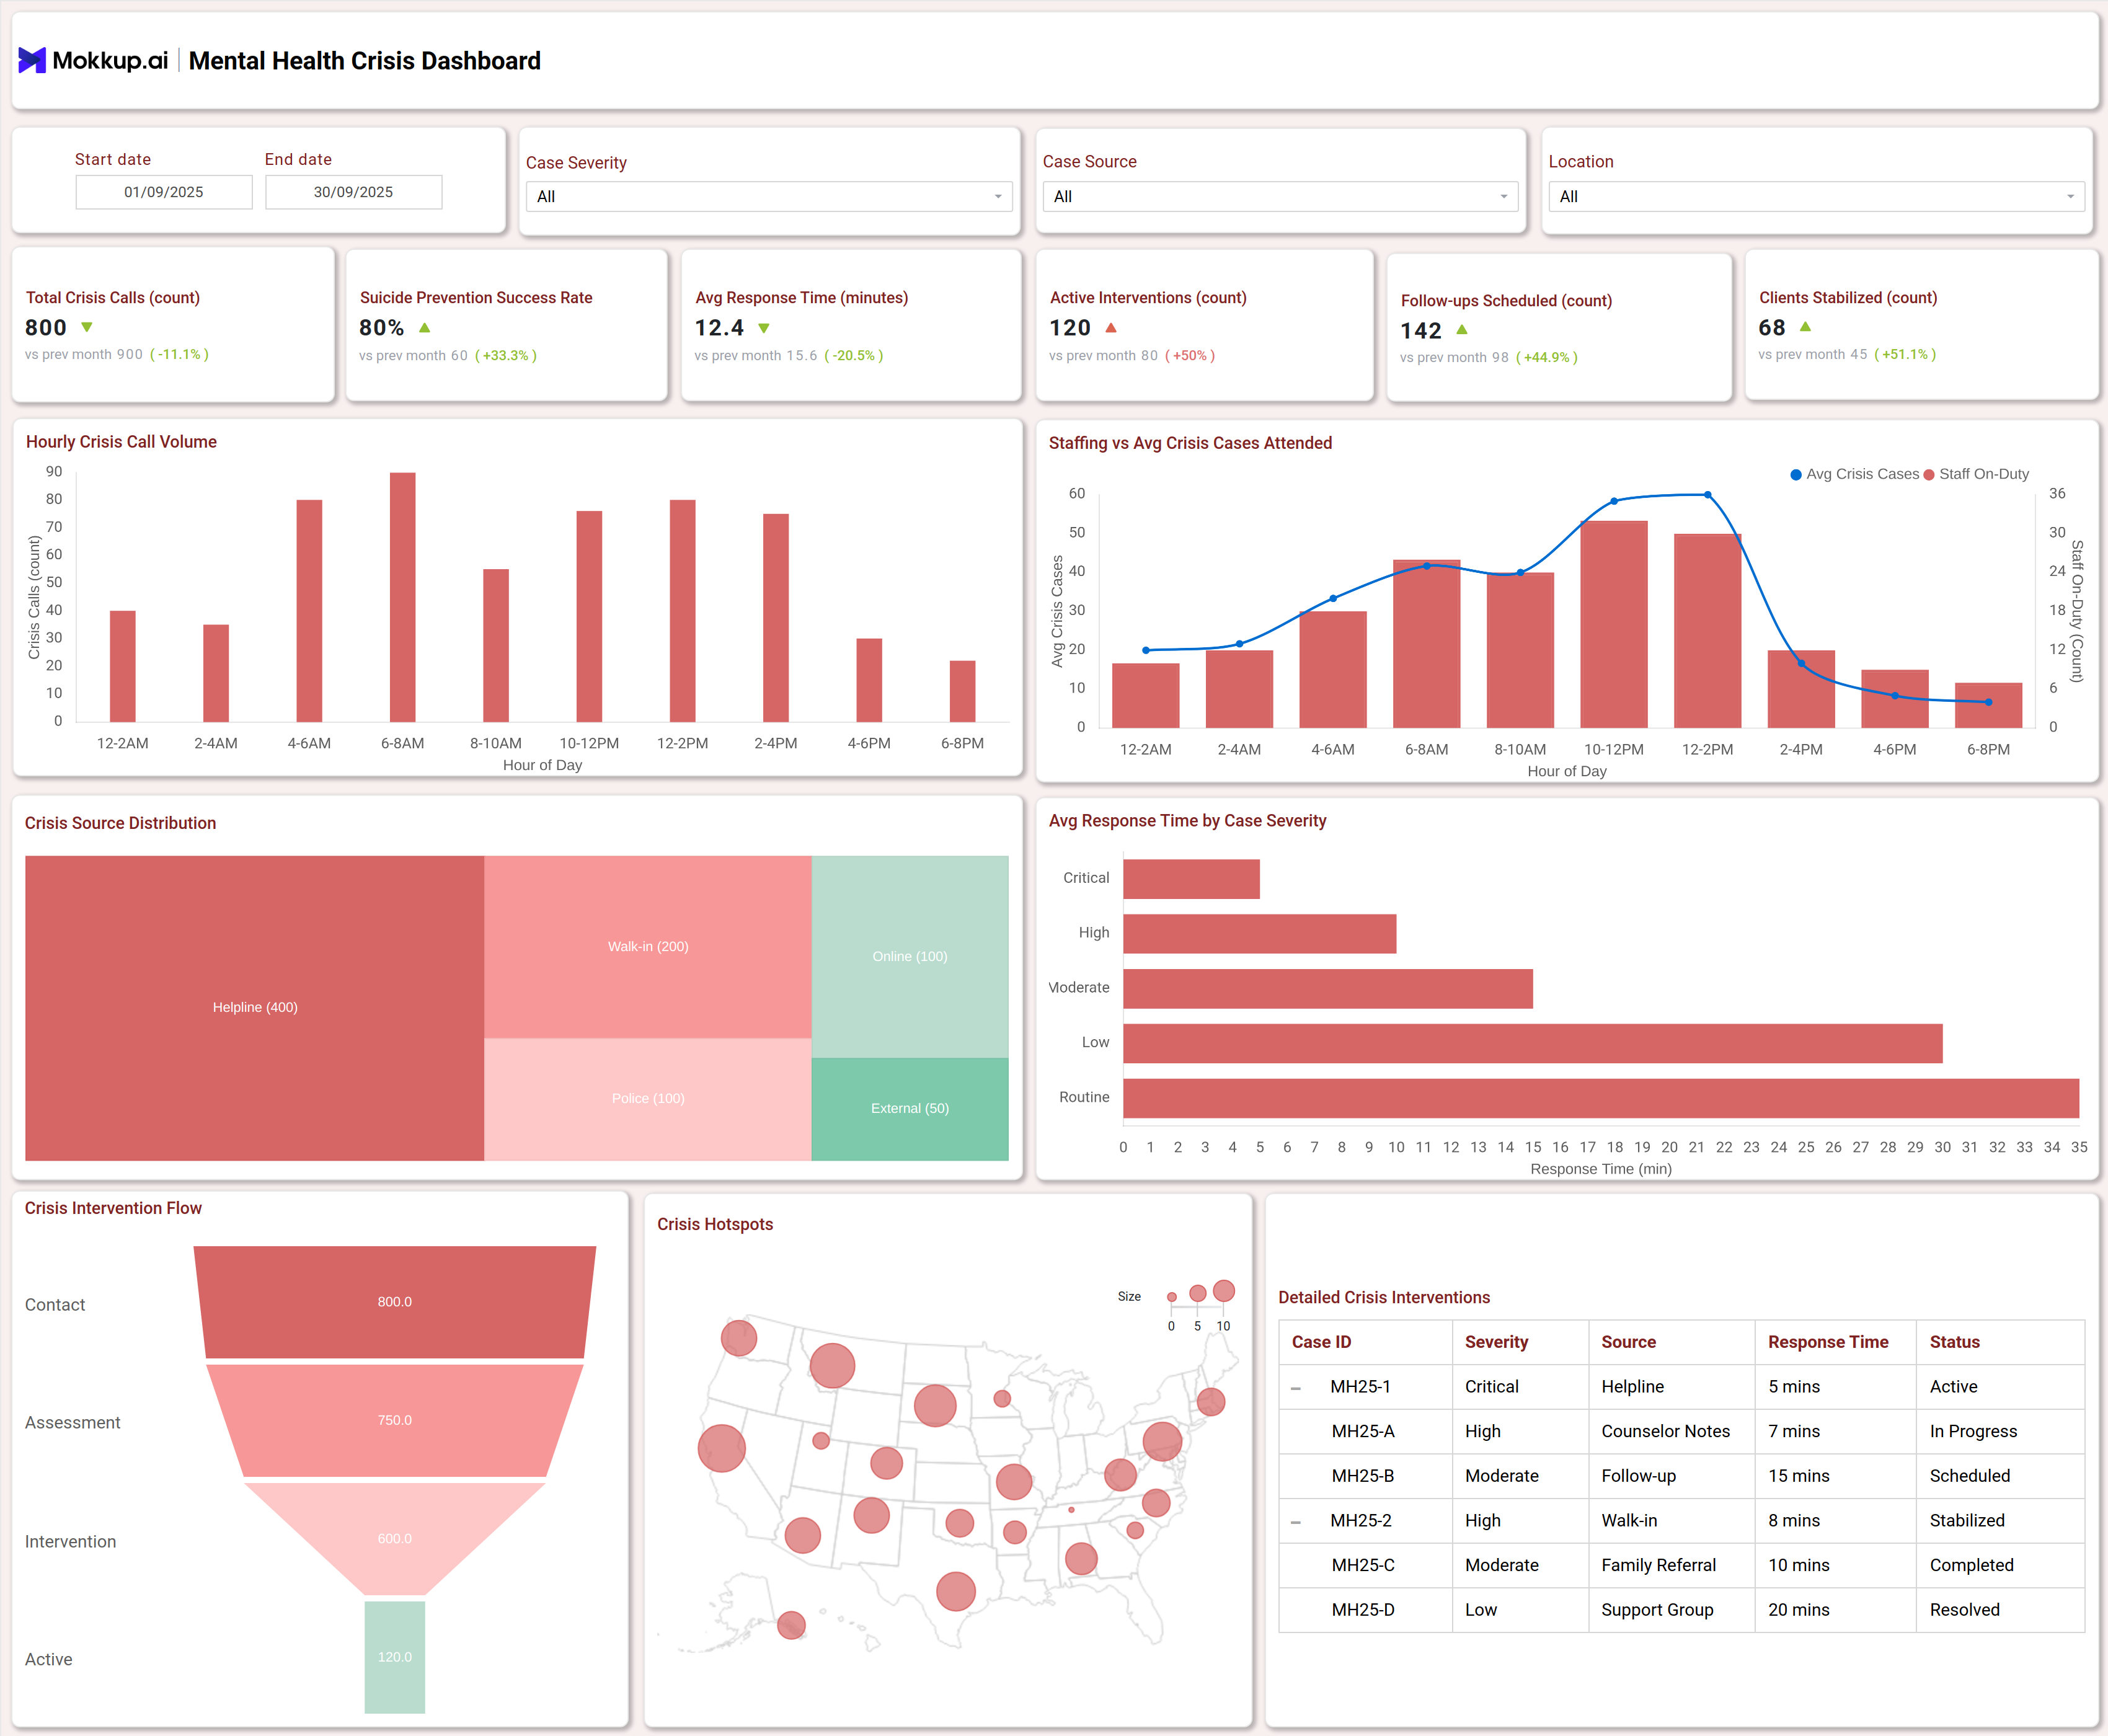
A Mental Health Crisis Management Dashboard is a digital tool that centralizes real-time emergency data and key metrics to support clinics in identifying, responding to, and monitoring mental health crises. This dashboard tracks emergency cases, patient outcomes, intervention timelines, and resource usage, offering decision-makers actionable insights at every stage: contact, assessment, intervention, and stabilization. Using data from helplines, walk-ins, police referrals, and other sources, emergency departments improve collaboration, care delivery, and operational efficiency through comprehensive emergency response analytics.
How to Create a Mental Health Crisis Management Dashboard
You don’t need to build your report from scratch—just start with a ready-to-use Mental Health Crisis Management dashboard template from Mokkup. Add in your data and export it however you like. Here’s how to do it:
1. Create or Log in to Your Mokkup Account
Start by signing up on Mokkup.ai using your email. If you already have an account, just log in, and you’ll be good to go.
2. Choose and Customize Your Dashboard Template
Find the Mental Health Crisis Management template in the Templates section. Use the drag-and-drop editor to adjust KPIs, edit filters, or add elements based on your data.
3. Export to Your BI Tool
Once your dashboard wireframe is ready, use the BI Tool Export feature to send it directly to Power BI or Tableau for further analysis and enhancements. You can also download the dashboard as a PDF, PNG, or JPEG, embed it on a platform, or invite your team to collaborate.
Note: This is a Pro template. You’ll need a Pro subscription on Mokkup to use and customize this dashboard wireframe. Upgrade anytime to unlock full access.
Mental Health Crisis Management Dashboard Example
A standard dashboard consolidates case details, response times, staffing patterns, client stabilization rates, and crisis hotspots onto a single interface. Such dashboards often display live metrics like total crisis calls, suicide prevention success rates, follow-up schedules, and staffing vs. call volume by hour. Visualization tools like funnels, maps, and bar charts help clinics understand bottlenecks in emergency care and optimize rapid response analytics. Role-based access means clinicians, directors, and crisis teams tailor views to daily operations or strategic planning.
How to Analyze Data in Mental Health Crisis Management Dashboards
Here is how you can analyze data in this dashboard and ensure that mental health clinic performance is stabilized for enhanced care quality:
- Identify peak call times and high-volume crisis periods using hourly and daily breakdowns.
- Track average response times segmented by case severity to locate service gaps.
- Monitor the distribution of crisis sources—helplines, police, walk-ins, online referrals—for outreach planning.
- Compare staff levels with crisis rates to ensure sufficient coverage for emergencies.
- Assess intervention flow to measure drop-offs between contact, assessment, and stabilization stages.
- Use crisis hotspots on geographic maps to efficiently allocate rapid response teams and resources.
- Review real-time trends for follow-up scheduling and case resolution to improve client outcomes.
Benefits of Mental Health Crisis Management Dashboards
Here are a few benefits of using this dashboard:
- Enables real-time emergency monitoring for immediate escalation and intervention.
- Centralizes emergency care dashboard metrics for quick decision-making.
- Provides actionable insights to optimize resource allocation during crises.
- Improves coordination between clinicians, first responders, and support staff.
- Tracks emergency intervention KPIs for continuous quality improvement.
- Enhances visibility into client stabilization and suicide prevention success outcomes.
- Facilitates compliance and reporting with regulatory standards using structured analytics.
KPIs to Track in Mental Health Crisis Management Dashboards
The key KPIs include
- Total crisis calls received: Number of crisis calls logged daily and hourly for workload insight.
- Suicide prevention success rate: Percentage of cases successfully stabilized to measure intervention effectiveness.
- Average response time by severity: Time taken to respond, categorized by case urgency.
- Active interventions count: Number of ongoing emergency cases requiring attention.
- Scheduled follow-ups count: Number of planned follow-ups ensuring continued patient care.
- Clients stabilized count: Number of clients whose conditions have been successfully managed.
Frequently Asked Questions
1. How is a crisis management dashboard different from a standard clinic dashboard?
It focuses on rapid response analytics, emergency KPIs, and real-time case tracking specific to mental health emergencies, while a standard dashboard covers broader clinical operations.
2. What data sources feed a mental health crisis dashboard?
Crisis hotlines, police and EMS records, walk-in registers, clinical notes, and online referral forms all feed live data into the dashboard.
3. Can the dashboard improve emergency outcomes?
Yes, it supports faster care and better stabilization rates by highlighting response gaps, tracking intervention status, and optimizing resource deployment.