Freight Operation Analytics refers to the process of collecting and analyzing data and metrics related to freight operations to gain insights and make data-driven decisions aimed at optimizing efficiency, reducing costs, and improving overall performance in the freight industry. This includes analyzing various aspects of freight operations such as transportation, logistics, warehousing, and distribution.
Freight Operations Analytics 1
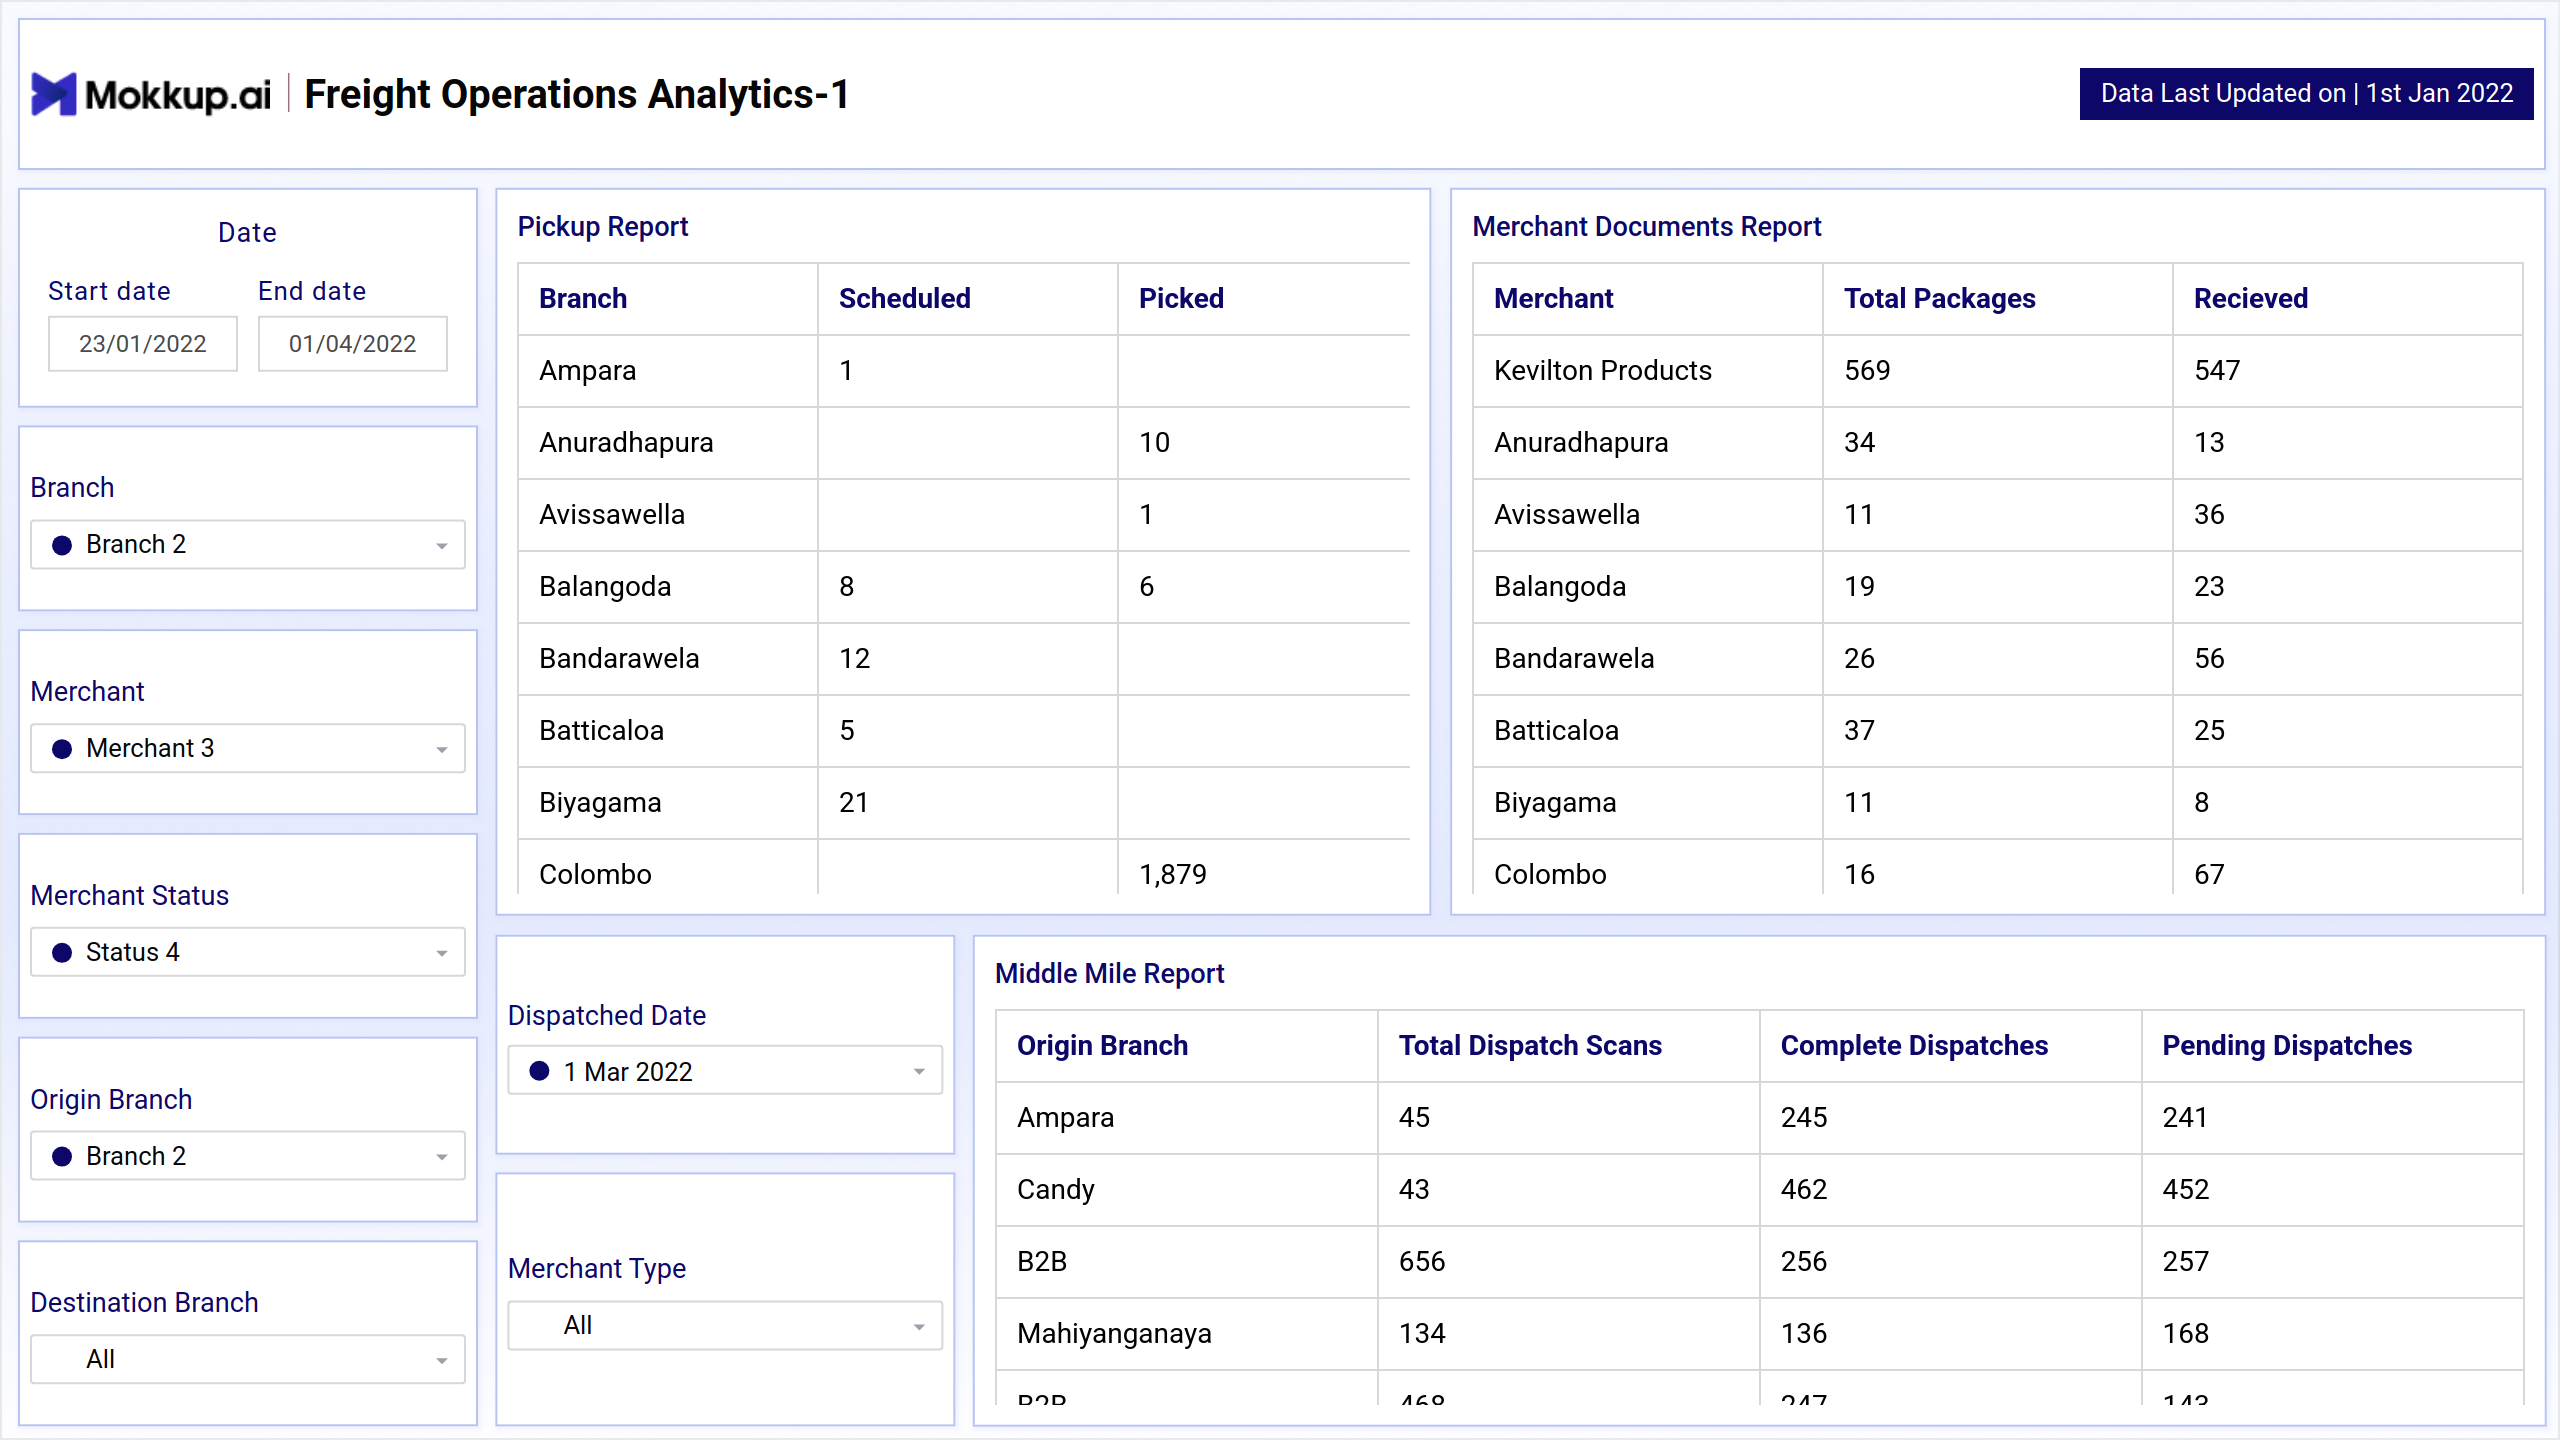
The 1st screen offers insights into key aspects of freight operations, including pickup performance, documentation management for merchants, and efficiency in the middle mile logistics segment.
Key Terms to Know
- Pickup Report: Provides insights into pickup operations, including branch-wise breakdowns of scheduled pickups and the actual number of pickups completed.
- Merchant Documents Report: Offers detailed information on merchant transactions, displaying data such as the merchant name, total number of packages, and packages received.
- Middle Mile Report: Focuses on middle mile operations, presenting data on origin branches, total dispatch scans, completed dispatches, and pending dispatches.
By analyzing data from these reports, businesses can optimize processes, enhance transparency, and improve overall efficiency in freight operations.
Freight Operations Analytics 2
The second screen of freight operational analytics offers real-time insights into mobile and web updates, lost and damaged items tracking, and aging analysis, providing stakeholders with valuable data for optimizing operations and mitigating risks.
Key Terms to Know
- Mobile vs. Web Updates: Compares updates made through mobile devices versus web platforms, providing insights into the preferred mode of operation and usage patterns.
- Real-time Updates Mobile-wise: Tracks real-time updates made via mobile devices, offering visibility into current operations and allowing for prompt responses to changing circumstances.
- Lost & Damaged Items Table: Displays data on lost and damaged items, including branch-wise details, scheduled pickups, and items that have been picked up.
- Aging Analysis: Analyzes the aging of shipments, categorizing them based on the number of days elapsed since dispatch (e.g., 3-5 days, 6-10 days, 11-14 days).
These components collectively provide comprehensive insights into various aspects of freight operations, facilitating monitoring, analysis, and decision-making to optimize operational efficiency and enhance customer satisfaction.
Dashboard Template Insights
Let’s have a look at the critical insights to optimize efficiency and address challenges in logistics.
- The dashboard wireframe provides enhanced visibility into pickup performance, document tracking, and middle-mile operations.
- Real-time updates facilitate prompt responses to changing circumstances.
- Monitoring lost and damaged items helps prevent losses and improve customer experience.
- Aging analysis identifies potential delays and issues in the transportation process.
Conclusion
The freight operational analytics dashboard template offers valuable insights to enhance business operations, mitigate losses, and ensure punctual delivery, ultimately boosting efficiency and customer satisfaction within the freight industry.