What is a LNG Terminal Asset Health & Reliability Dashboard
An LNG Terminal Asset Health & Reliability Dashboard is a data‑driven visual management tool that consolidates critical equipment health, maintenance performance, and operational reliability metrics for liquefied natural gas (LNG) terminals. It aggregates historical data on key indicators such as Asset Health Index, Mean Time Between Failures (MTBF), unplanned outages, condition monitoring alerts, and asset utilization.
By integrating LNG terminal asset health monitoring, predictive maintenance KPIs, and reliability-centered maintenance (RCM) analytics, this dashboard enables asset managers, maintenance leads, and reliability engineers to extend equipment life, reduce downtime, and optimize maintenance spend. It serves as a single source of truth for condition‑based maintenance, failure trend analysis, and capital planning across pumps, compressors, turbines, valves, and other terminal assets.
How to Create a LNG Terminal Asset Health & Reliability Dashboard
You don’t need to build your report from scratch—just start with a ready-to-use LNG Terminal Asset Health & Reliability dashboard template from Mokkup. Add in your data and export it however you like. Here’s how to do it:
1. Create or Log in to Your Mokkup Account
Start by signing up on Mokkup.ai using your email. If you already have an account, just log in, and you’ll be good to go.
2. Choose and Customize Your Dashboard Template
Find the LNG Terminal Asset Health & Reliability Dashboard template in the Templates section. Use the drag-and-drop editor to adjust KPIs, edit filters, or add elements based on your data.
3. Export to Your BI Tool
Once your dashboard wireframe is ready, use the BI Tool Export feature to send it directly to Power BI or Tableau for further analysis and enhancements. You can also download the dashboard as a PDF, PNG, or JPEG, embed it on a platform, or invite your team to collaborate.
Note: This is a Pro template. You’ll need a Pro subscription on Mokkup to use and customize this dashboard wireframe. Upgrade anytime to unlock full access.
LNG Terminal Asset Health & Reliability Dashboard Example
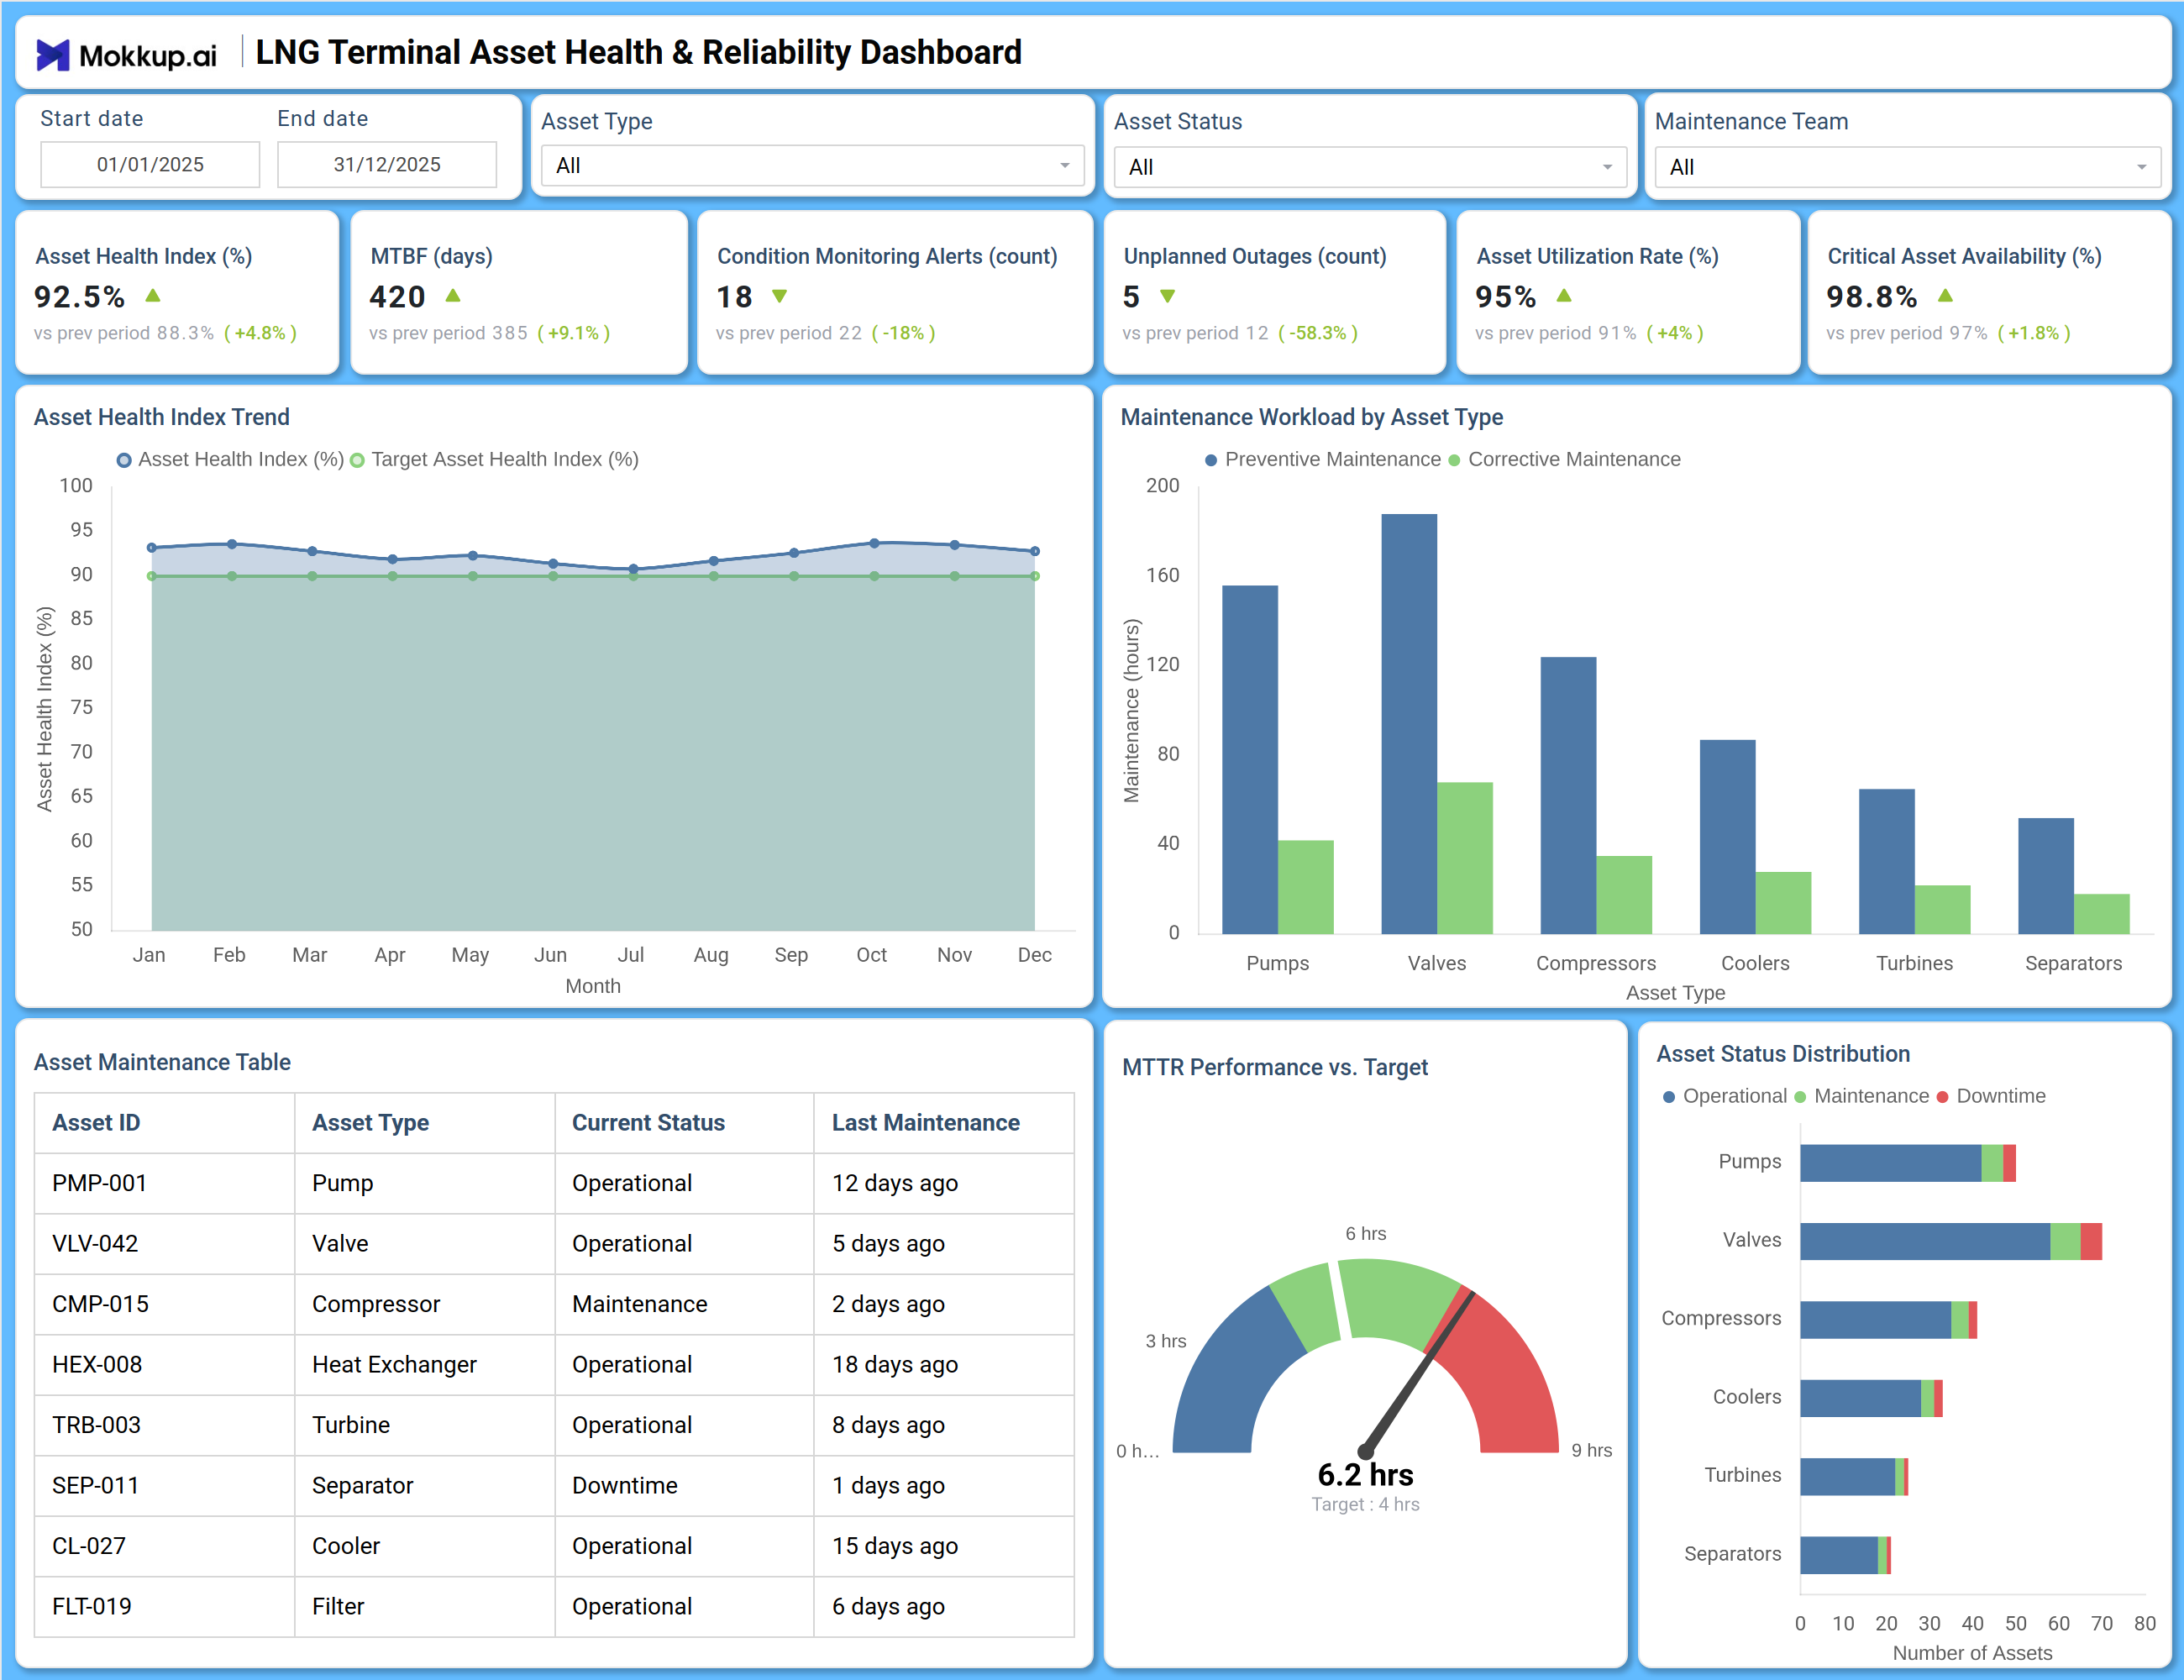
This dashboard wireframe provides a complete operational picture of asset integrity and maintenance performance across an LNG terminal. The Overview screen highlights six top‑level KPIs: Asset Health Index at 92.5% (up 4.8%), MTBF of 420 days (9.1% improvement), Condition Monitoring Alerts reduced to 18, Unplanned Outages cut by over half to 5, Asset Utilization Rate at 95%, and Critical Asset Availability at 98.8%. A monthly trend chart tracks the Asset Health Index against a target, revealing seasonal or operational patterns. The Maintenance Workload by Asset Type bar chart breaks down preventive vs. corrective maintenance hours for pumps, valves, compressors, coolers, turbines, and separators—helping teams shift from reactive to proactive strategies.
How to Analyze Data in a LNG Terminal Asset Health & Reliability Dashboard
Here is how you can analyze data from this dashboard:
- Asset Health Trend Monitoring: Monitor Asset Health Index (%) over time to detect degradation trends and validate maintenance effectiveness.
- Reliability Performance Analysis: Review MTBF (days) to identify assets with declining reliability and prioritize root cause analysis.
- Condition Alert Prioritization: Track Condition Monitoring Alerts by volume and severity to schedule inspections and prevent failures.
- Unplanned Outage Assessment: Analyze frequency and duration of unplanned outages to quantify reliability improvements and avoided losses.
- Utilization Performance Review: Compare Asset Utilization Rate against targets to ensure production assets maintain expected availability.
- Maintenance Workload Balance: Drill into Maintenance Workload by Asset Type to balance preventive and corrective maintenance activities.
- Service Status Monitoring: Use the Asset Maintenance Table to identify overdue assets or equipment currently in downtime status.
- Repair Efficiency Evaluation: Evaluate MTTR performance against targets to detect repair process bottlenecks and improve response time.
- Overall Asset Status Overview: Assess Asset Status Distribution to quickly understand the overall health condition of terminal equipment.
Benefits of a LNG Terminal Asset Health & Reliability Dashboard
The following are the benefits of using this dashboard:
- Centralized Asset Visibility: Provides a real time view of asset health across the LNG terminal.
- Predictive Maintenance Enablement: Highlights early warning signals through condition monitoring alerts.
- Reduced Downtime: Minimizes unplanned outages and associated production losses through proactive maintenance.
- Better Capital Planning: Supports asset investment decisions using reliability trends and lifecycle insights.
- Optimized Maintenance Strategy: Shifts maintenance from reactive to preventive and predictive approaches.
- Improved Operational Safety: Ensures critical equipment operates within safe design limits.
- Compliance & Audit Support: Maintains detailed maintenance and performance records for regulatory audits.
- Cross Team Collaboration: Enhances coordination between operations, maintenance, and reliability teams.
KPIs to Track in a LNG Terminal Asset Health & Reliability Dashboard
The following key KPIs can be tracked by using this dashboard:
- Asset Health Index (%): Composite score reflecting the overall condition of terminal assets.
- Mean Time Between Failures (MTBF) (days): Average operating time between equipment failures.
- Condition Monitoring Alerts: Number of active alerts from vibration, temperature, or pressure sensors.
- Unplanned Outages: Count of unexpected shutdowns attributable to asset failure.
- Asset Utilization Rate (%): Actual operating time as a percentage of maximum available time.
- Critical Asset Availability (%): Percentage of time that mission‑critical equipment is ready for service.
- Mean Time To Repair (MTTR) (hours): Average time required to restore a failed asset to operation.
- Preventive vs. Corrective Maintenance Ratio: Proportion of maintenance hours spent on planned vs. unplanned work.
- Maintenance Backlog: Number of work orders past their scheduled due date.
- Asset Status Distribution: Percentage of assets in operational, maintenance, or downtime states.
Frequently Asked Questions
Q1. What is the difference between Asset Health Index and Asset Utilization?
Asset Health Index measures the physical condition and degradation level of equipment, while Asset Utilization tracks how much the asset is actually used relative to its maximum capacity.
Q2. How often should asset health data be updated?
For effective condition monitoring, sensor‑based data should stream in real time or at least daily. Manual inspection data can be updated weekly or after each maintenance event.
Q3. Can this dashboard integrate with existing CMMS or EAM systems?
Yes. Mokkup dashboards can connect to leading Computerized Maintenance Management Systems (CMMS) and Enterprise Asset Management (EAM) platforms via CSV uploads, APIs, or BI tool connectors.
Q4. How does the dashboard help reduce unplanned outages?
By surfacing condition monitoring alerts early and highlighting assets with declining MTBF or health index, the dashboard enables teams to schedule corrective work before failure occurs.
Q5. Is this dashboard suitable for other industrial sectors?
Absolutely. While tailored for LNG terminals, the same KPIs and visual framework apply to refineries, power plants, pipelines, chemical facilities, and any capital‑intensive industry.