What is an LNG Service Reliability & Curtailment Impact Dashboard?
An LNG Service Reliability & Curtailment Impact Dashboard is a centralized analytics solution designed to monitor the reliability of LNG supply operations and quantify the operational and financial impact of service disruptions. It provides visibility into delivery performance, plant availability, curtailment events, and contract compliance across LNG value chains. This type of LNG service reliability dashboard enables operators to track how consistently LNG is delivered against contractual commitments while identifying risks related to downtime and supply interruptions. The dashboard integrates operational, commercial, and contractual data to create a unified LNG operations reliability monitoring dashboard. It allows stakeholders to analyze curtailment causes such as equipment failure, maintenance, regulatory constraints, or demand fluctuations. By combining performance metrics with financial exposure indicators like revenue at risk and penalty exposure, it acts as a complete LNG curtailment impact dashboard for decision-making.
How to Create an LNG Service Reliability & Curtailment Impact Dashboard
You don’t need to build your report from scratch; just start with a ready-to-use dashboard template from Mokkup. Add in your data and export it however you like. Here’s how to do it:
1. Create or Log in to Your Mokkup Account
Start by signing up on Mokkup.ai using your email. If you already have an account, just log in, and you’ll be good to go.
2. Choose and Customize Your Dashboard Template
Find the LNG Service Reliability & Curtailment Impact Dashboard template in the Templates section. Use the drag-and-drop editor to adjust KPIs, edit filters, or add elements based on your data.
3. Export to Your BI Tool
Once your dashboard wireframe is ready, use the BI Tool Export feature to send it directly to Power BI or Tableau for further analysis and enhancements. You can also download the dashboard as a PDF, PNG, or JPEG, embed it on a platform, or invite your team to collaborate.
Note: This is a Pro template. You’ll need a Pro subscription on Mokkup to use and customize this dashboard wireframe. Upgrade anytime to unlock full access.
LNG Service Reliability & Curtailment Impact Dashboard Example
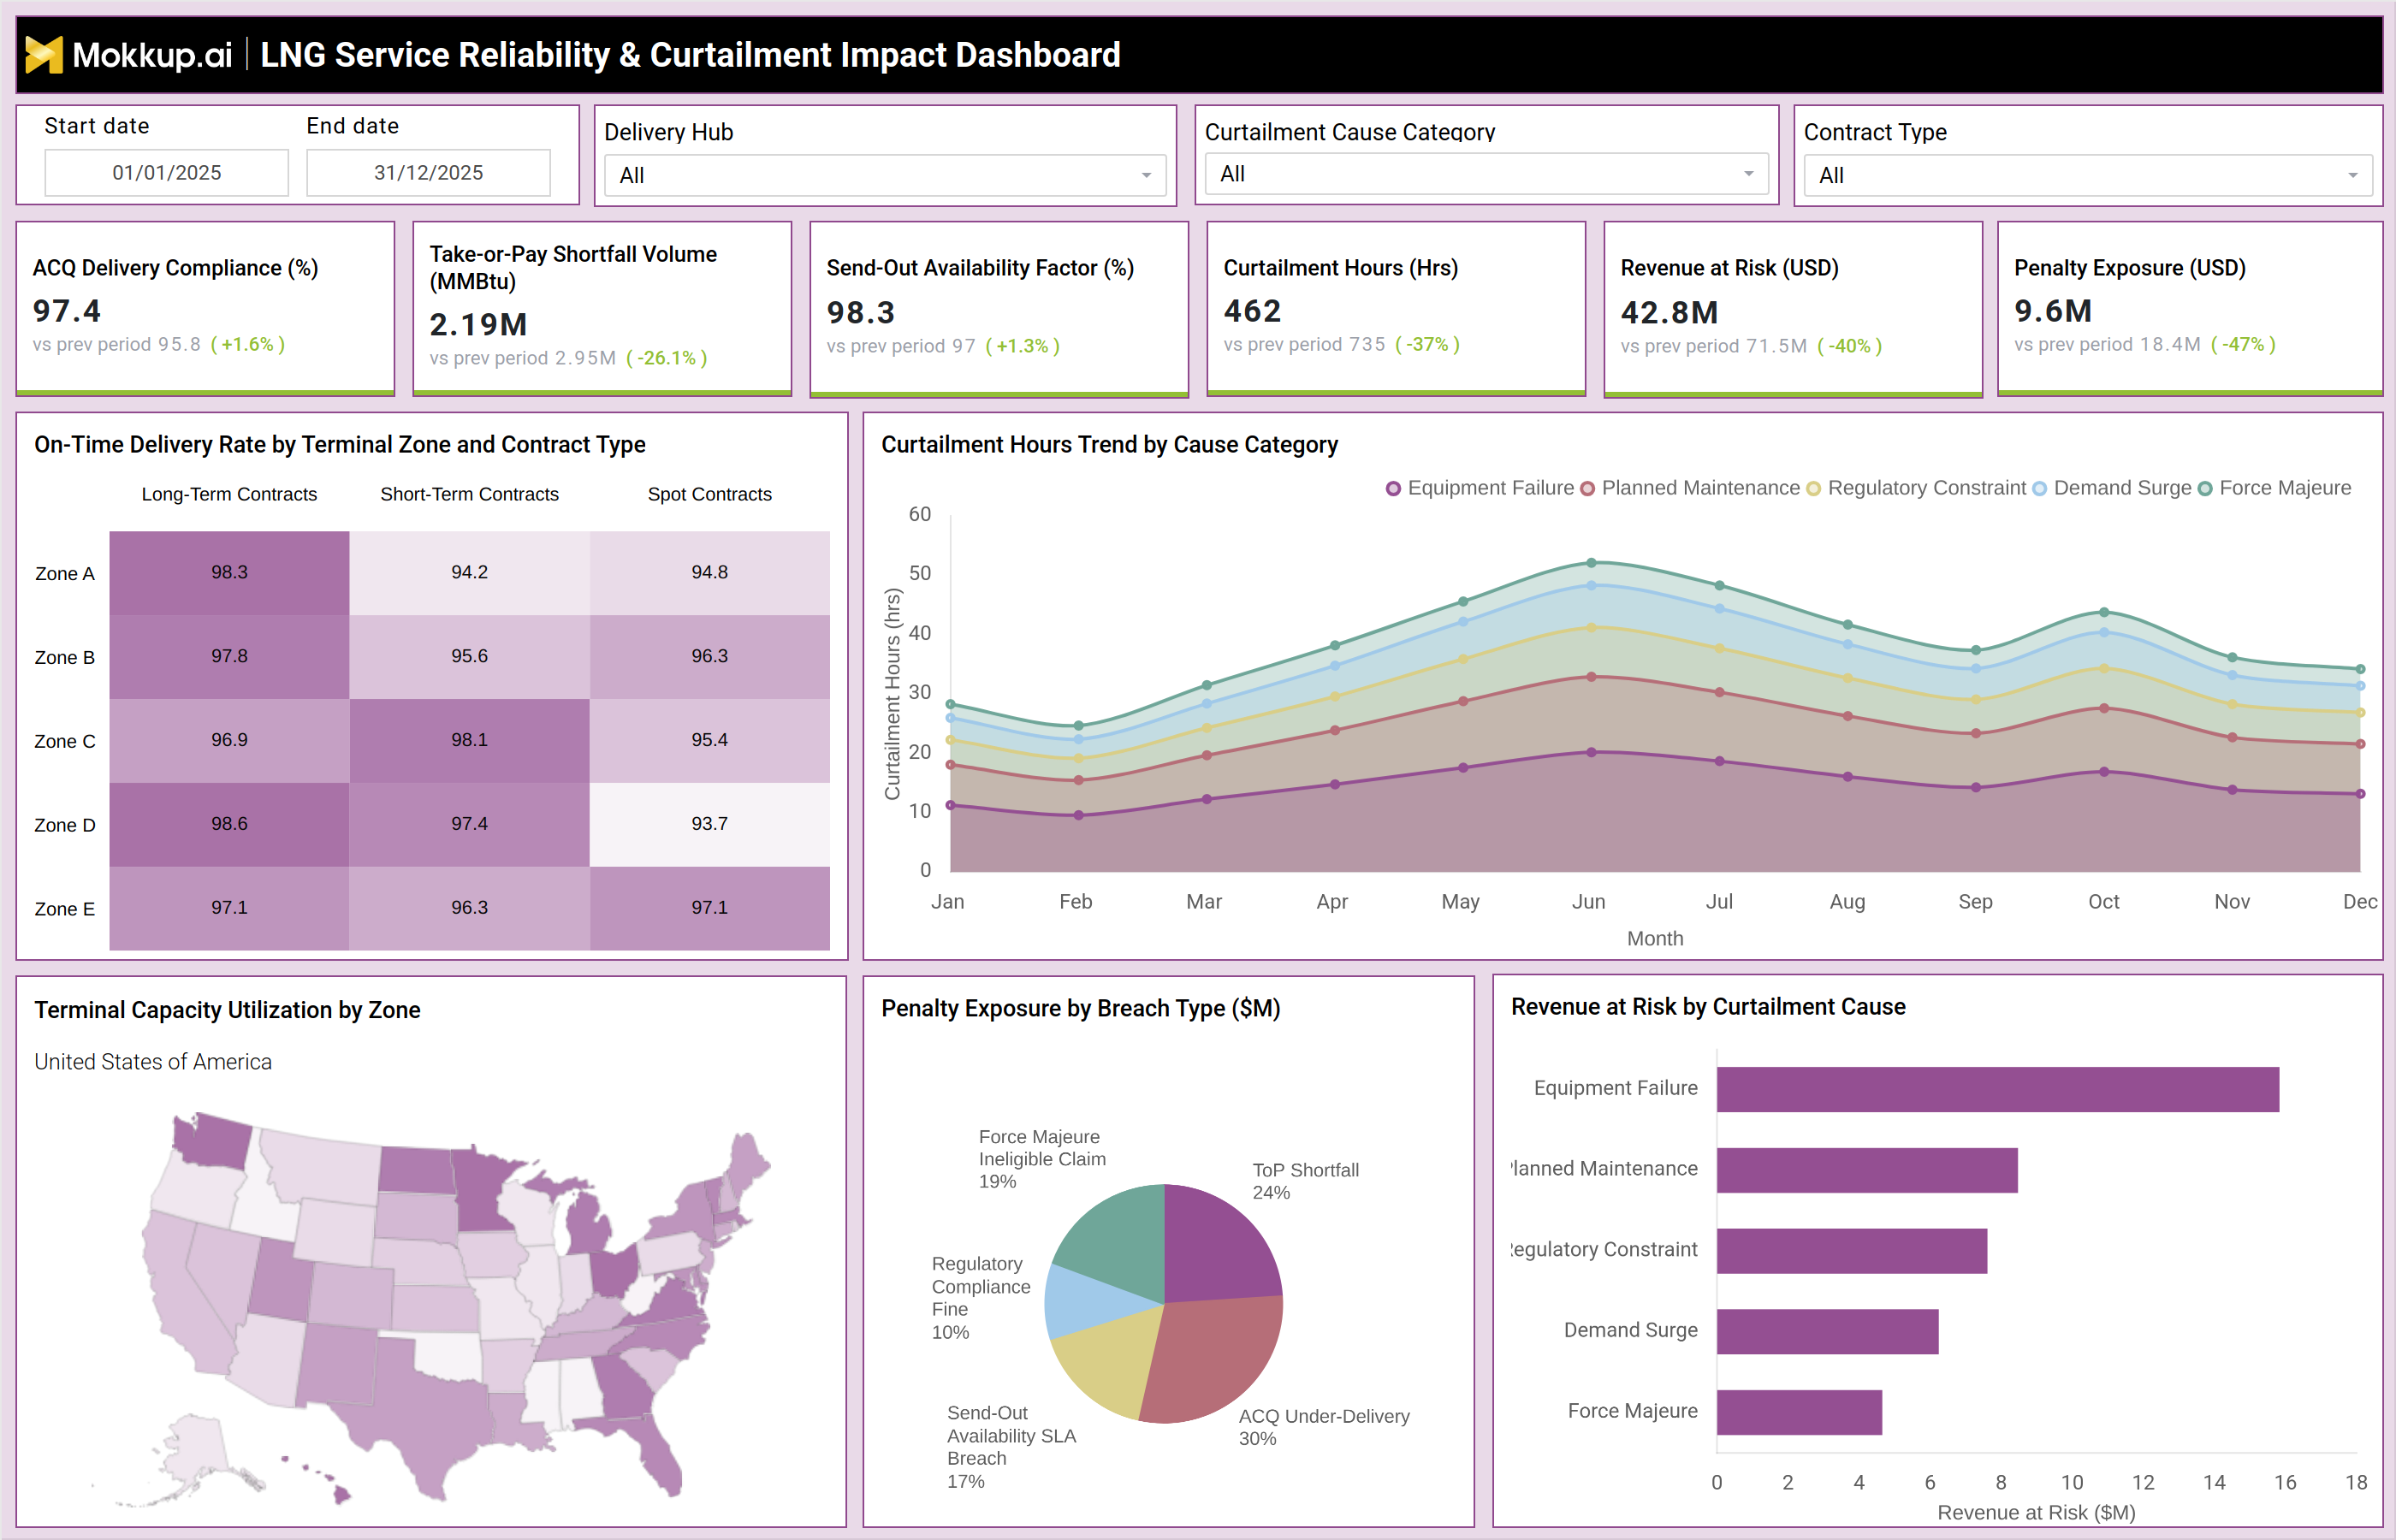
A typical LNG supply reliability analytics dashboard presents a comprehensive view of delivery performance and curtailment risks. At the top level, key KPIs such as ACQ delivery compliance, take-or-pay shortfall volume, send-out availability factor, curtailment hours, revenue at risk, and penalty exposure provide a snapshot of operational and financial performance. The dashboard includes a detailed view of on-time delivery rates across terminal zones and contract types, helping operators identify underperforming regions or contract categories.
A trend analysis of curtailment hours by cause category highlights patterns in operational disruptions, such as increased downtime due to equipment failure or planned maintenance. Geographic visualizations of terminal capacity utilization provide insights into regional demand-supply balance, while charts analyzing penalty exposure and revenue at risk help quantify the financial impact of service disruptions. Together, these components form a complete LNG downtime and curtailment dashboard, enabling proactive risk management and operational optimization.
How to Analyze Data in LNG Service Reliability & Curtailment Impact Dashboard
Here is how you can analyze data from this dashboard:
- Monitor ACQ delivery compliance (%) to assess adherence to contractual delivery commitments
- Track curtailment hours (hrs) to evaluate the extent of service interruptions
- Analyze send-out availability factor (%) to measure plant operational readiness
- Review take-or-pay shortfall volume to identify contractual under-delivery risks
- Examine curtailment trends by cause to identify root causes, such as equipment failure or regulatory constraints
- Compare on-time delivery rates by terminal and contract type to detect performance gaps
- Evaluate revenue at risk (USD) to quantify financial exposure from curtailments
- Analyze penalty exposure (USD) to understand compliance and contractual risks
- Review terminal capacity utilization to identify underutilized or overloaded assets
- Correlate operational metrics with financial KPIs to prioritize corrective actions
Benefits of LNG Service Reliability & Curtailment Impact Dashboard
The following are the benefits of using this dashboard:
- Improves visibility into LNG delivery performance using a LNG service reliability dashboard
- Enables proactive risk management with a LNG curtailment impact dashboard
- Enhances operational decision-making through a LNG operations reliability monitoring dashboard
- Reduces downtime by identifying key causes of curtailment
- Minimizes financial losses by tracking revenue at risk and penalty exposure
- Supports contract compliance by monitoring delivery obligations
- Improves asset utilization through capacity and availability insights
- Enhances coordination between operations, commercial, and trading teams
- Enables faster response to disruptions with analytics
- Provides a unified LNG plant reliability performance dashboard for end-to-end monitoring
KPIs to Track in LNG Service Reliability & Curtailment Impact Dashboard
The following key KPIs can be tracked by using this dashboard:
- ACQ Delivery Compliance (%) – Measures adherence to contractual LNG delivery volumes
- Take-or-Pay Shortfall Volume – Tracks volume shortfalls against contractual obligations
- Send-Out Availability Factor (%) – Indicates plant operational availability
- Curtailment Hours (hrs) – Measures duration of supply disruptions
- Revenue at Risk (USD) – Quantifies financial exposure due to curtailments
- Penalty Exposure (USD) – Tracks penalties from contract breaches or non-compliance
- On-Time Delivery Rate (%) – Measures delivery performance across terminals
- Terminal Capacity Utilization (%) – Indicates efficiency of LNG infrastructure usage
- Curtailment Incidents by Cause – Identifies root causes of disruptions
Frequently Asked Questions
1. Who uses an LNG Service Reliability & Curtailment Impact Dashboard?
LNG operators, natural gas utilities, commercial teams, and operations managers use this dashboard to monitor supply reliability and manage curtailment risks.
2. How does this dashboard improve LNG reliability?
It provides visibility into delivery performance, plant availability, and disruption causes, enabling proactive corrective actions.
3. What causes LNG curtailment?
Common causes include equipment failure, planned maintenance, regulatory constraints, demand surges, and force majeure events.