
What is an LNG Price Exposure & Hedging Risk Dashboard?
An LNG price exposure and hedging risk dashboard is a monitoring tool used by LNG traders and natural gas utilities to track market-driven financial risk. It helps teams measure how LNG price movements affect contracts, portfolio value, and hedge performance. LNG trading is exposed to commodity volatility, benchmark movements, and regional spread changes. An LNG price risk management analytics dashboard combines hedge coverage, valuation, and market price indicators in one view.
This allows risk teams to monitor exposure without relying on disconnected reports. It also works as an LNG market price exposure monitoring system for tracking portfolio sensitivity to external price changes. Teams can review mark-to-market value, value at risk, and price variance together. The dashboard supports faster response to changing energy market conditions. It improves hedging discipline and strengthens trading risk control across LNG portfolios.
How to Create an LNG Price Exposure & Hedging Risk Dashboard
You don’t need to build your report from scratch, just start with a ready-to-use LNG Price Exposure & Hedging Risk dashboard template from Mokkup. Add in your data and export it however you like. Here’s how to do it:
1. Create or Log in to Your Mokkup Account
Start by signing up on Mokkup.ai using your email. If you already have an account, just log in, and you’ll be good to go.
2. Choose and Customize Your Dashboard Template
Find the LNG Price Exposure & Hedging Risk Dashboard template in the Templates section. Use the drag-and-drop editor to adjust KPIs, edit filters, or add elements based on your data.
3. Export to Your BI Tool
Once your dashboard wireframe is ready, use the BI Tool Export feature to send it directly to Power BI or Tableau for further analysis and enhancements. You can also download the dashboard as a PDF, PNG, or JPEG, embed it on a platform, or invite your team to collaborate.
Note: This is a Pro template. You’ll need a Pro subscription on Mokkup to use and customize this dashboard wireframe. Upgrade anytime to unlock full access.
LNG Price Exposure & Hedging Risk Dashboard Example
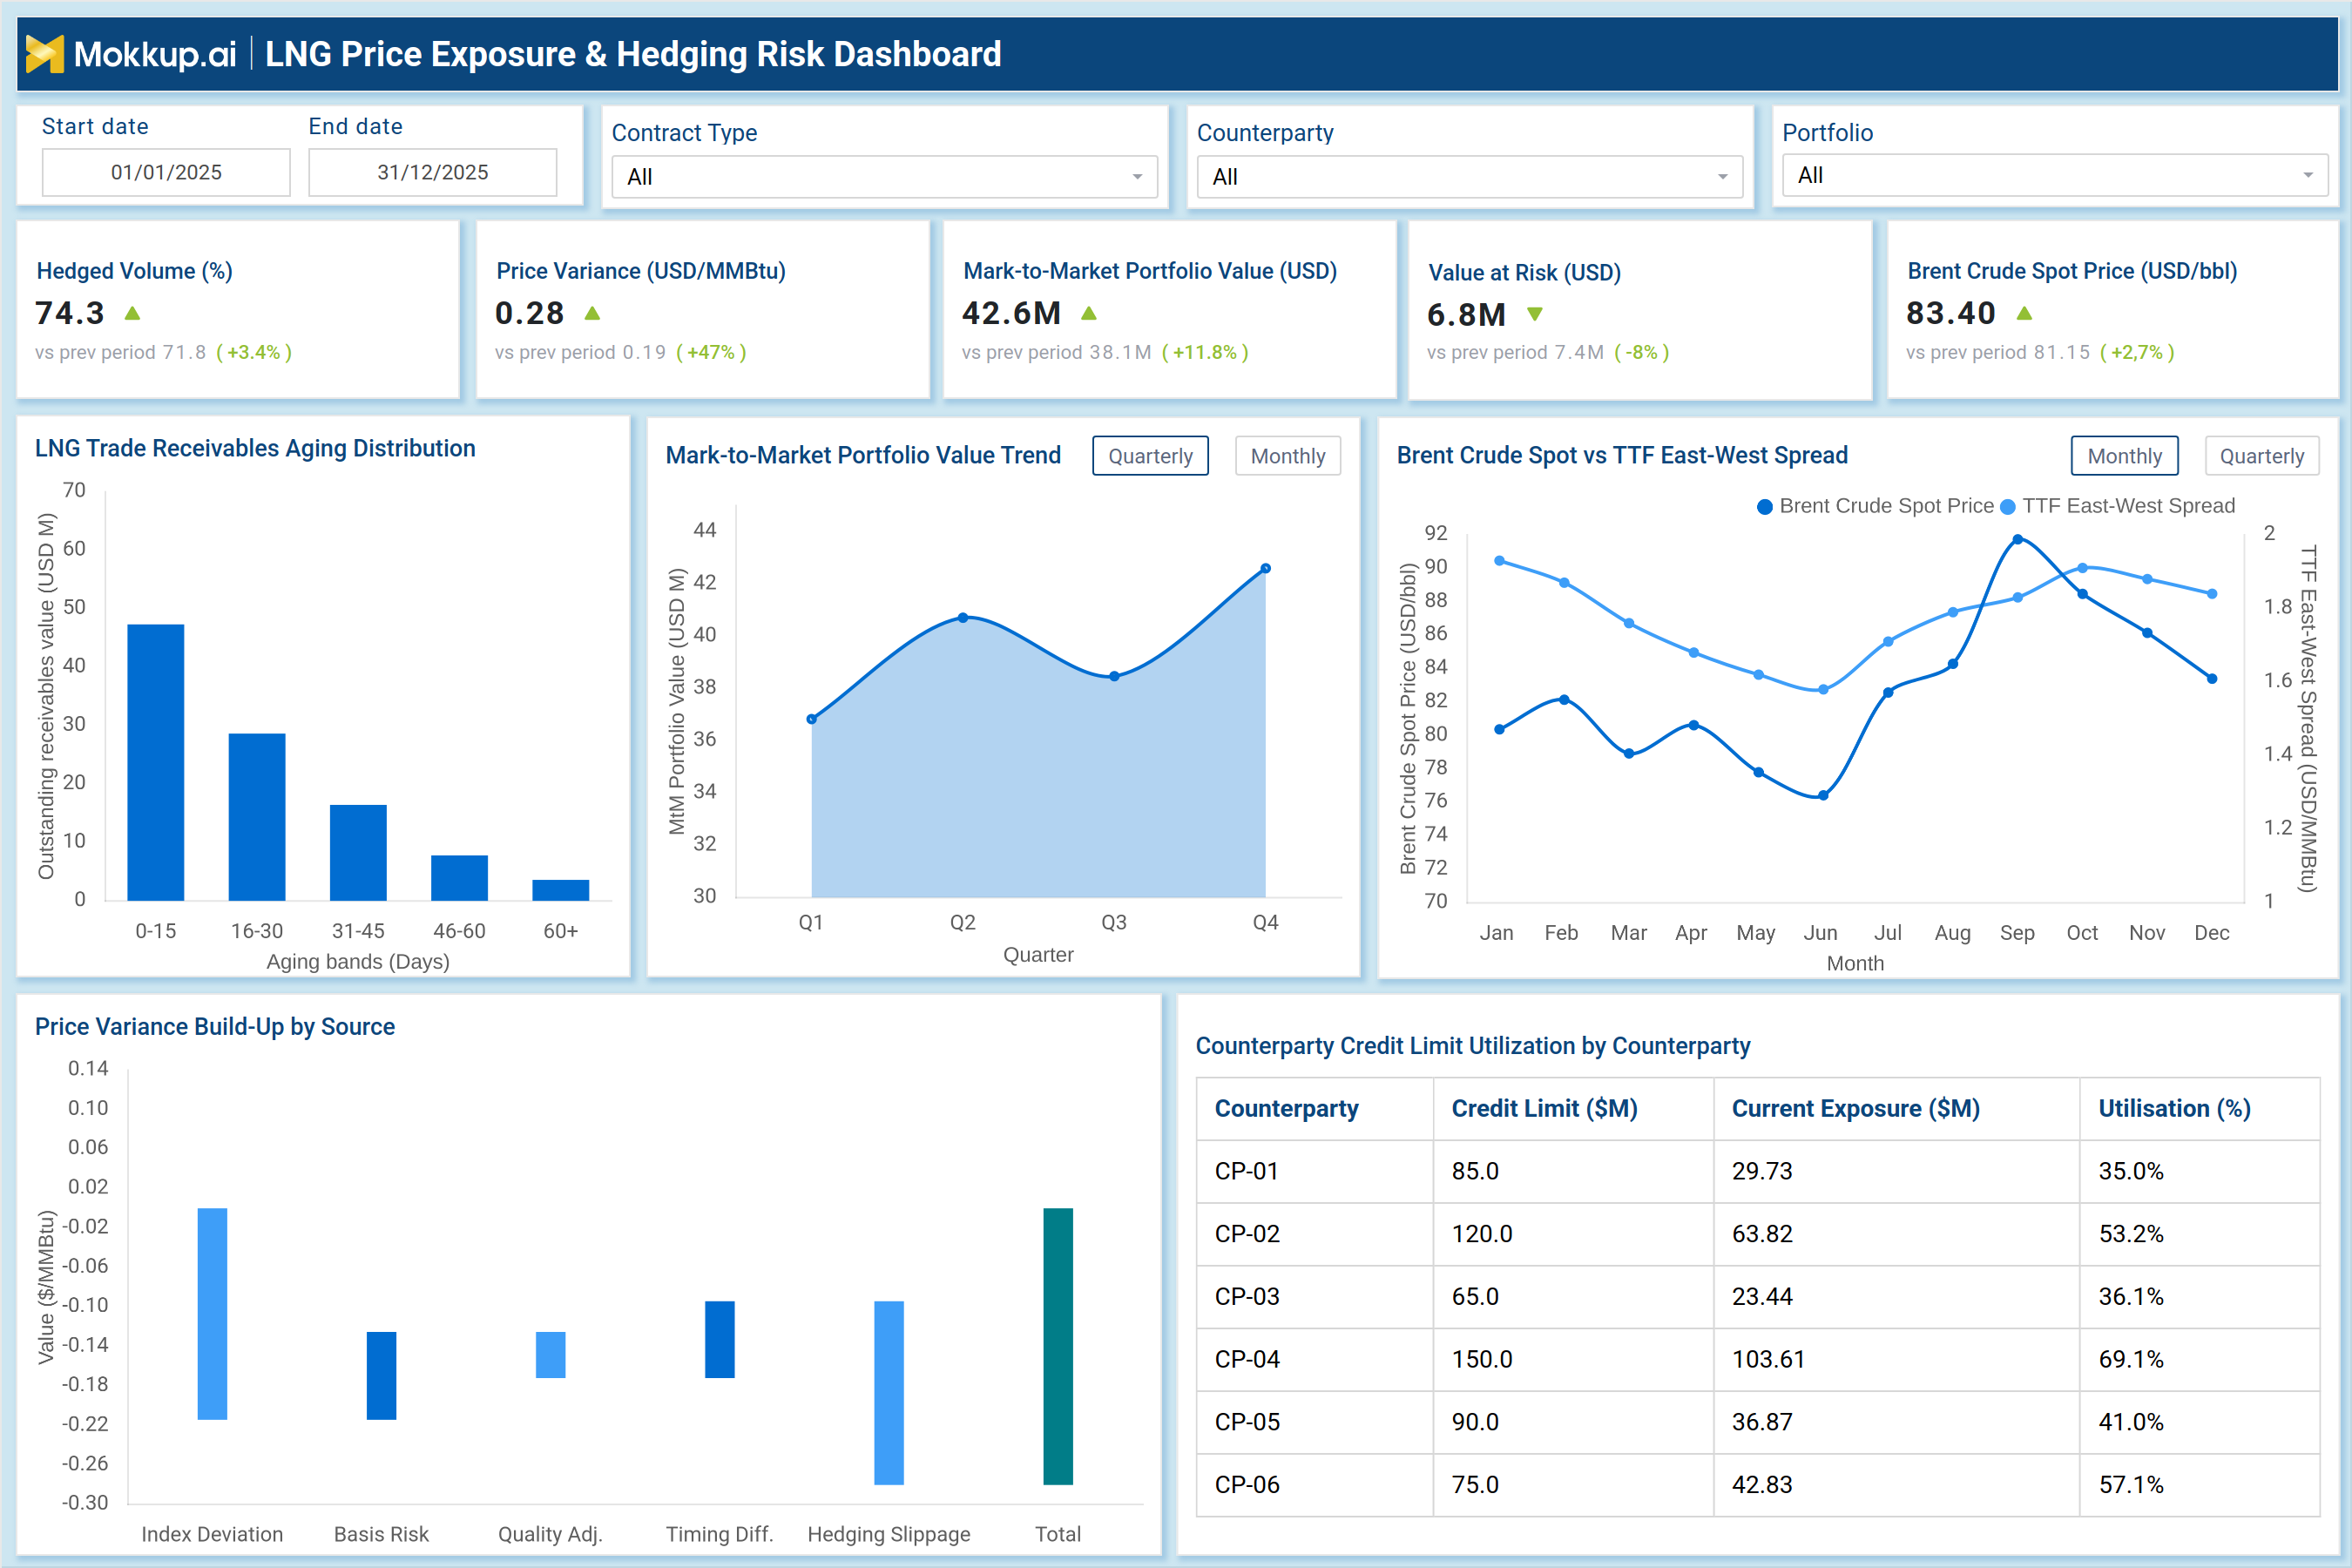
A trading team managing LNG supply contracts must monitor market exposure across pricing benchmarks, counterparties, and hedge positions. An LNG hedging strategy performance monitoring dashboard gives a centralized view of hedged volume, price variance, portfolio value, and value at risk. This helps traders understand whether hedge coverage is protecting the portfolio from price volatility. The dashboard also tracks Brent crude spot price and the TTF East-West spread, which influence LNG pricing decisions.
Receivables aging helps teams monitor cash exposure from LNG trade settlements. Price variance build-up shows whether basis risk, timing differences, or hedging slippage are driving variance. Counterparty credit utilization highlights exposure against approved credit limits. A liquefied natural gas price volatility risk dashboard gives risk managers better visibility into trading pressure points. This LNG commodity price hedging analytics platform supports better hedging and portfolio risk decisions.
How to Analyze Data in LNG Price Exposure & Hedging Risk Dashboard
Here is how you can analyze data from this dashboard:
- Hedge Coverage Assessment: Review hedged volume percentage to evaluate how much of the LNG portfolio is protected from price volatility.
- Price Variance Analysis: Analyze price variance to understand the impact of market fluctuations on trading margins.
- Portfolio Valuation Monitoring: Monitor mark-to-market portfolio value to assess current trading position valuation.
- Risk Exposure Evaluation: Evaluate value at risk (VaR) to estimate potential financial losses under adverse conditions.
- Market Driver Tracking: Track Brent crude price trends and regional gas spreads to understand external price drivers.
- Exposure Trend Analysis: Analyze mark-to-market value trends to identify changes in portfolio exposure over time.
- Receivables Risk Review: Review receivables aging distribution to assess payment and credit risk.
- Variance Driver Identification: Study sources of price variance such as basis risk, timing differences, and quality adjustments.
- Credit Exposure Monitoring: Examine counterparty credit limit utilization to ensure exposure stays within thresholds.
- Hedging Effectiveness Evaluation: Compare hedge coverage against market exposure to assess strategy effectiveness.
Benefits of LNG Price Exposure & Hedging Risk Dashboard
The following are the benefits of using this dashboard:
- Centralized Risk Visibility: Provides a unified view of LNG price exposure and trading portfolio risk.
- Hedge Performance Monitoring: Improves tracking of hedging effectiveness across contracts.
- Market Responsiveness: Helps traders react quickly to global energy price volatility.
- Financial Risk Management: Enhances control over LNG commodity portfolio risks.
- Strategic Hedging Support: Enables better hedging decisions using market insights.
- Margin Protection: Identifies price variance drivers impacting trading profitability.
- Credit Risk Oversight: Strengthens monitoring of counterparty exposure.
- Market Benchmark Tracking: Enables visibility into global LNG price benchmarks and spreads.
- Risk Reduction: Minimizes financial exposure through proactive monitoring.
- Trading Strategy Support: Supports long-term LNG procurement and trading planning.
KPIs to Track in LNG Price Exposure & Hedging Risk Dashboard
The following key KPIs can be tracked by using this dashboard:
- Hedged Volume (%): Percentage of LNG trading volume covered through hedging instruments.
- Price Variance (USD/MMBtu): Difference between expected and actual realized pricing impact.
- Mark-to-Market Portfolio Value (USD): Current market value of the LNG trading portfolio.
- Value at Risk (USD): Estimated downside financial exposure under adverse market movement.
- Brent Crude Spot Price (USD/bbl): External benchmark influencing LNG-linked pricing.
- LNG Trade Receivables Aging Distribution: Outstanding receivables grouped by aging band.
- Mark-to-Market Portfolio Value Trend: Period-based movement in portfolio valuation.
- Brent Crude Spot vs TTF East-West Spread: Comparison of key market indicators affecting LNG pricing.
- Price Variance Build-Up by Source: Breakdown of variance by index deviation, basis risk, quality adjustment, timing difference, and hedging slippage.
- Counterparty Credit Limit Utilization by Counterparty: Current exposure against approved counterparty credit limits.
Frequently Asked Questions
Q1. What is an LNG price exposure and hedging risk dashboard?
It is a risk monitoring platform used by LNG trading teams to track price exposure, hedge coverage, and financial risk across LNG portfolios.
Q2. Who uses an LNG price risk management analytics dashboard?
Energy traders, risk management teams, commercial analysts, and natural gas utilities use this dashboard to manage LNG trading exposure.
Q3. Why is price risk monitoring important in LNG trading?
LNG prices are influenced by global energy markets and regional gas hubs. Monitoring price exposure helps reduce financial volatility and protect trading margins.