What is an LNG Enterprise Performance Dashboard?
An LNG enterprise performance dashboard for natural gas utilities is a centralized analytics platform used to monitor financial, operational, and commercial performance across LNG operations. It combines production, revenue, contract fulfillment, and equipment performance into a single executive view. LNG companies operate across liquefaction plants, shipping networks, and global delivery markets. Managing performance across these functions requires an integrated LNG enterprise KPI dashboard for operations and finance. This dashboard consolidates data from production systems, commercial contracts, and financial reporting. It enables leaders to track LNG revenue, production volume, plant utilization, and operating margins. As an LNG business performance monitoring dashboard, it supports decision-making with KPIs. It also functions as an LNG enterprise performance management system for tracking enterprise-wide efficiency. This liquefied natural gas enterprise analytics dashboard improves visibility into overall LNG business performance.
How to Create an LNG Enterprise Performance Dashboard
You don't need to build your report from scratch, just start with a ready-to-use dashboard template from Mokkup. Add in your data and export it however you like. Here's how to do it:
1. Create or Log in to Your Mokkup Account
Start by signing up on Mokkup.ai using your email. If you already have an account, just log in, and you'll be good to go.
2. Choose and Customize Your Dashboard Template
Find the LNG Enterprise Performance Dashboard template in the Templates section. Use the drag-and-drop editor to adjust KPIs, edit filters, or add elements based on your data.
3. Export to Your BI Tool
Once your dashboard wireframe is ready, use the BI Tool Export feature to send it directly to Power BI or Tableau for further analysis and enhancements. You can also download the dashboard as a PDF, PNG, or JPEG, embed it on a platform, or invite your team to collaborate.
Note: This is a Pro template. You'll need a Pro subscription on Mokkup to use and customize this dashboard wireframe. Upgrade anytime to unlock full access.
LNG Enterprise Performance Dashboard Example
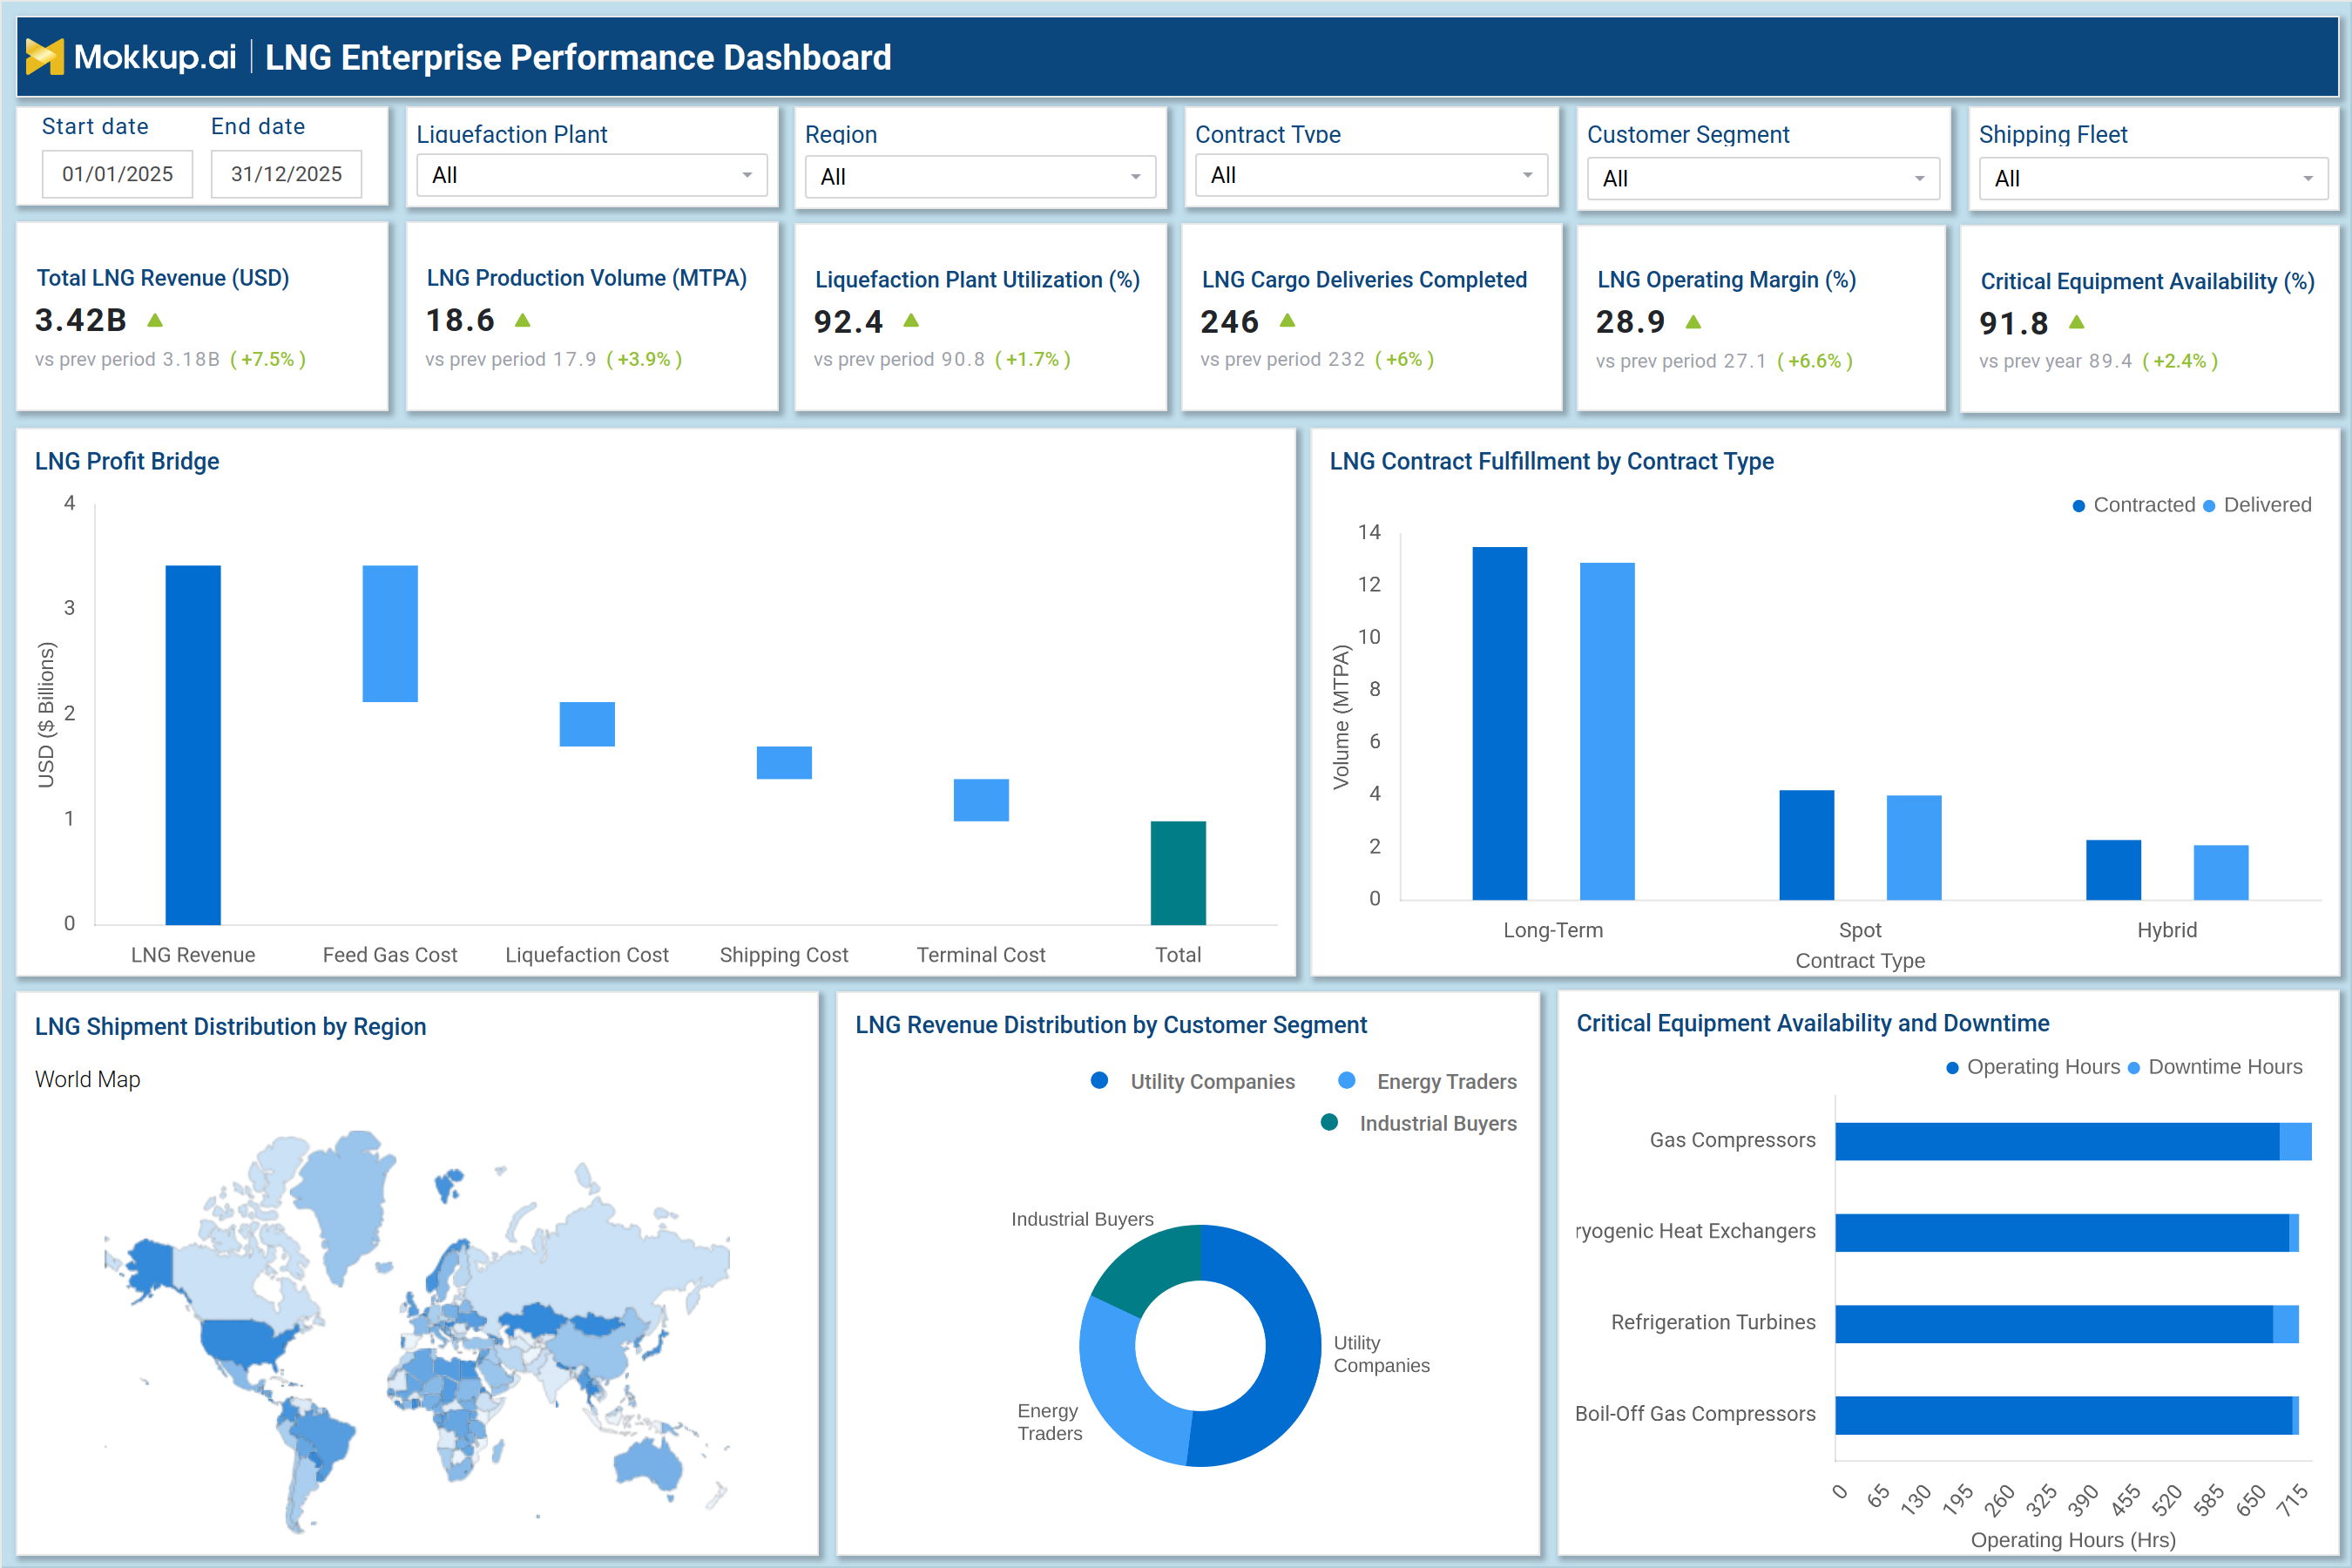
A global LNG operator managing multiple liquefaction plants and export contracts requires a consolidated view of enterprise performance. An LNG operational and financial performance dashboard provides insights into revenue, production volume, plant utilization, and cargo deliveries. Executives can track total LNG revenue alongside production output to evaluate business growth. The dashboard also shows contract fulfillment across long-term, spot, and hybrid contracts. Profit bridge analysis highlights cost components such as feed gas, liquefaction, shipping, and terminal costs. Regional shipment distribution helps track LNG deliveries across global markets. Revenue segmentation by customer type shows contribution from utilities, traders, and industrial buyers. Equipment availability monitoring ensures operational reliability across compressors and turbines. This LNG business performance monitoring dashboard enables leadership to align operations with financial outcomes.
How to Analyze Data in LNG Enterprise Performance Dashboard
- Review total LNG revenue: Evaluates overall business performance and revenue generation trends.
- Analyze LNG production volume: Assesses output levels from liquefaction plants to track supply capacity.
- Monitor plant utilization: Ensures efficient use of production capacity and identifies underutilization.
- Track cargo deliveries completed: Measures operational execution and delivery performance.
- Review LNG operating margin: Analyzes profitability by comparing revenue against operating costs.
- Analyze profit bridge: Identifies key cost drivers impacting profitability, such as feed gas and shipping.
- Examine contract fulfillment by contract type: Ensures delivery commitments are met across different contract structures.
- Study shipment distribution by destination region: Provides insights into global market reach and regional demand.
- Evaluate revenue distribution by customer segment: Identifies key contributors to revenue across customer groups.
- Monitor equipment availability and downtime: Assesses operational reliability and impact on production continuity.
Benefits of the LNG Enterprise Performance Dashboard
- Provides a unified view of LNG financial and operational performance: Consolidates key metrics for a holistic view of business performance.
- Enables monitoring of enterprise KPIs across LNG operations: Tracks critical KPIs to ensure alignment with operational goals.
- Improves decision-making for production, logistics, and commercial strategy: Supports strategic planning with data-driven operational insights.
- Enhances visibility into revenue, margins, and cost drivers: Provides clarity on financial performance and profitability factors.
- Supports contract fulfillment tracking across LNG delivery commitments: Ensures adherence to contractual obligations and delivery schedules.
- Improves operational efficiency through plant utilization monitoring: Identifies inefficiencies and optimizes production capacity usage.
- Enables better tracking of global LNG shipment distribution: Offers insights into shipment patterns and regional demand.
- Strengthens equipment reliability monitoring across LNG infrastructure: Tracks asset performance to reduce downtime and disruptions.
- Aligns business performance with strategic objectives: Ensures operations are aligned with long-term business goals.
- Supports data-driven enterprise performance management: Enables informed decision-making using integrated performance data.
KPIs to Track in LNG Enterprise Performance Dashboard
- Total LNG Revenue (USD) – Total revenue generated from LNG sales across global markets.
- LNG Production Volume (MTPA) – Total LNG output produced by liquefaction plants.
- Liquefaction Plant Utilization (%) – Efficiency of plant capacity usage in LNG production.
- LNG Cargo Deliveries Completed – Number of LNG shipments successfully delivered.
- LNG Operating Margin (%) – Profitability of LNG operations after cost deductions.
- Critical Equipment Availability (%) – Availability of key equipment such as compressors and turbines.
- LNG Profit Bridge – Breakdown of cost components including feed gas, liquefaction, shipping, and terminal costs.
- LNG Contract Fulfillment by Contract Type – Performance of LNG delivery commitments across contract types.
- LNG Shipment Distribution by Destination Region – Geographic distribution of LNG deliveries.
- LNG Revenue Distribution by Customer Segment – Revenue contribution by utilities, traders, and industrial buyers.
- Critical Equipment Availability and Downtime – Operating hours versus downtime for critical LNG equipment.
Frequently Asked Questions
1. What is an LNG enterprise performance dashboard?
It is a centralized platform that tracks financial, operational, and commercial performance across LNG operations.
2. Who uses an LNG enterprise KPI dashboard for operations and finance?
Executives, operations managers, finance teams, and commercial analysts in LNG companies use it.
3. Why is enterprise performance monitoring important in LNG operations?
LNG businesses operate across production, logistics, and global markets, requiring integrated performance tracking.