
What is a LNG Operational Workforce Risk & Fatigue Overview Dashboard?
A LNG Operational Workforce Risk & Fatigue Overview Dashboard is a specialized analytics platform designed to monitor and mitigate fatigue-related risks among employees occupying high-stakes positions in industrial environments such as LNG, oil & gas, power generation, and manufacturing.
By tracking fatigue risk management, overtime tracking for safety roles, and critical role staffing levels, this dashboard wireframe empowers safety officers, shift managers, and HR teams to proactively identify at-risk employees, prevent fatigue-induced incidents, and maintain operational continuity. It serves as an early warning system for workforce well-being and compliance with occupational health standards.
How to Create a LNG Operational Workforce Risk & Fatigue Overview Dashboard
You don’t need to build your report from scratch—just start with a ready-to-use sample LNG Operational Workforce Risk & Fatigue Overview Dashboard template from Mokkup. Plug in your own data and export it however you like. Here’s how to do it:
1. Create or Log in to Your Mokkup Account
Start by signing up on Mokkup.ai using your email. If you already have an account, just log in, and you’ll be good to go.
2. Choose and Customize Your Dashboard Template
Find the LNG Operational Workforce Risk & Fatigue Overview Dashboard template in the Templates section. Use the drag-and-drop editor to adjust KPIs, edit filters, or add elements based on your data.
3. Export to Your BI Tool
Once your dashboard wireframe is ready, use the BI Tool Export feature to send it directly to Power BI or Tableau for further analysis and enhancements. You can also download the dashboard as a PDF, PNG, or JPEG, embed it on a platform, or invite your team to collaborate.
Note: This is a Pro template. You’ll need a Pro subscription on Mokkup to use and customize this dashboard wireframe. Upgrade anytime to unlock full access.
LNG Operational Workforce Risk & Fatigue Overview Dashboard Example
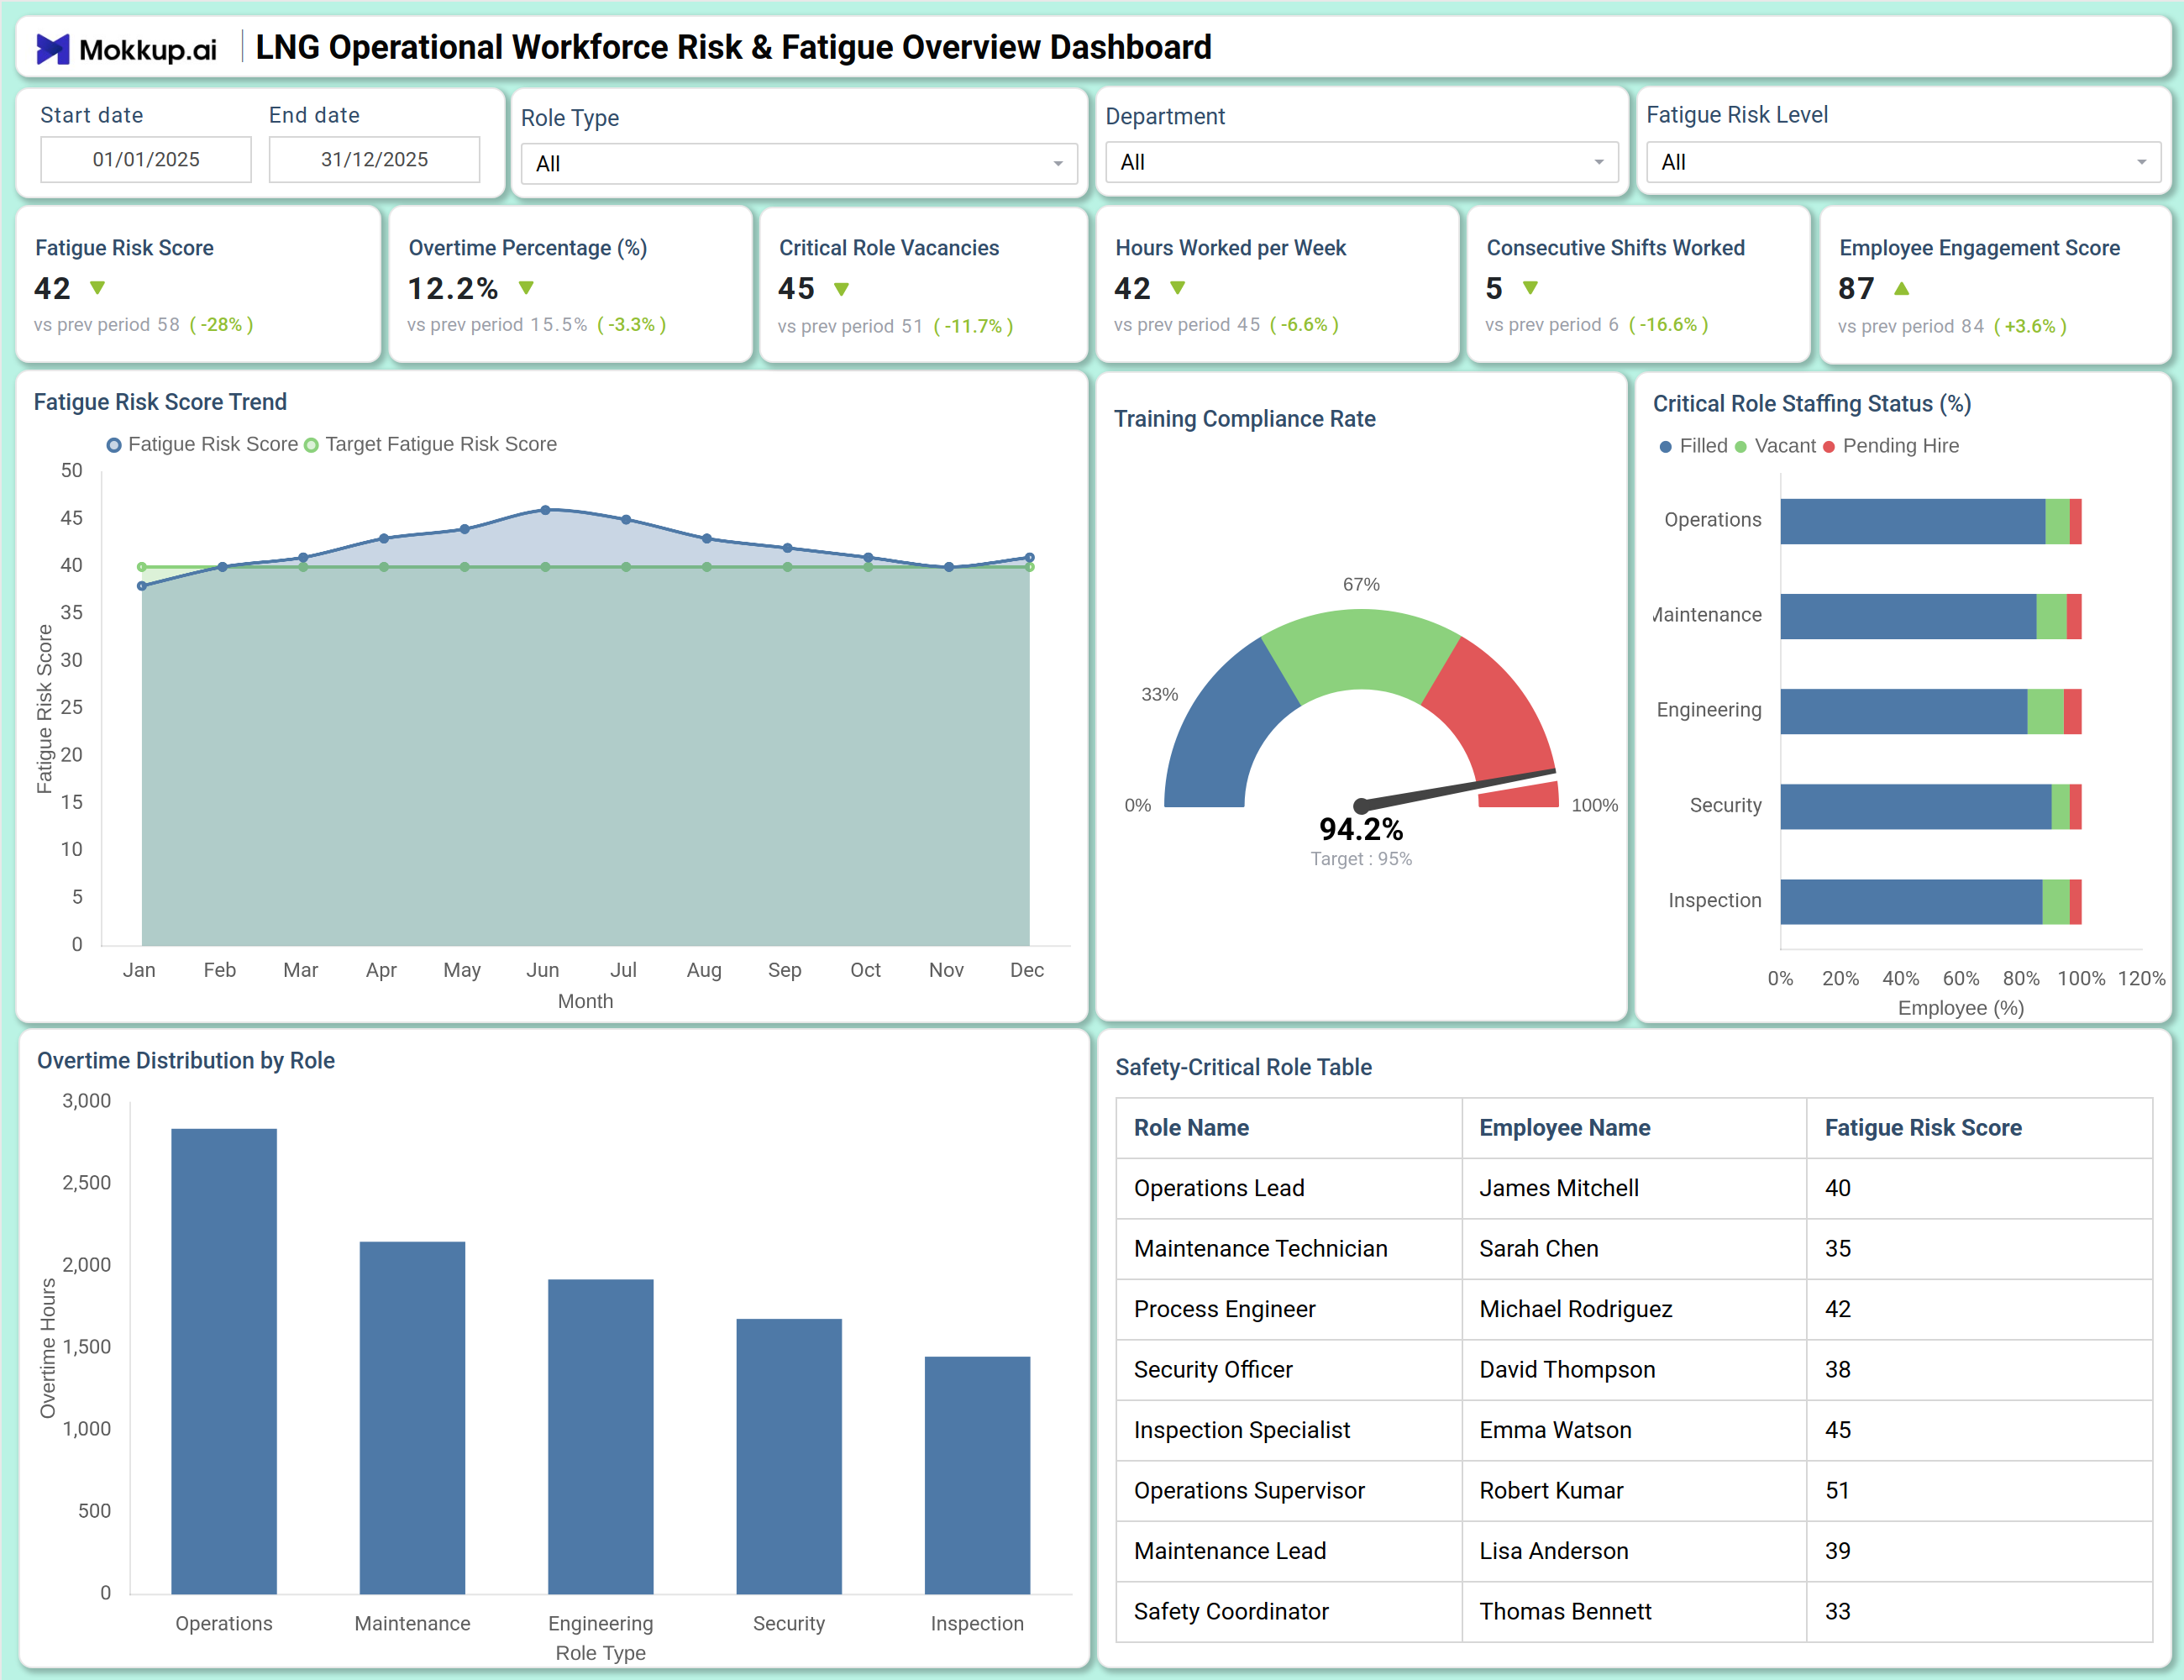
This dashboard delivers a complete operational view of fatigue and staffing risks across safety critical positions. The Overview screen prominently displays key risk indicators: a Fatigue Risk Score of 42 (28% improvement vs. prior period), Overtime Percentage at 12.2%, and Consecutive Shifts Worked averaging 4 (down 20%). The Fatigue Risk Score Trend chart compares monthly scores against a target, helping managers spot seasonal or operational patterns. Training Compliance Rate is nearly on target at 94.2%, while Critical Role Staffing Status reveals that 5 vacancies remain open. Overtime Distribution by Role breaks down total overtime hours across Operations, Maintenance, Engineering, Security, and Inspection. A detailed Safety Critical Role Table lists individual employees alongside their current fatigue risk scores, enabling immediate intervention for high-risk personnel. This integrated design supports employee fatigue analysis, workforce safety dashboarding, and proactive fatigue risk mitigation.
How to Analyze Data in a LNG Operational Workforce Risk & Fatigue Overview Dashboard
Here is how you can analyze data from this dashboard:
- Fatigue Risk Monitoring: Monitor the Fatigue Risk Score against targets to evaluate overall workforce fatigue and mitigation effectiveness.
- Overtime Threshold Analysis: Track Overtime Percentage (%) to identify departments or roles exceeding safe work hour limits.
- Shift Pattern Review: Review Consecutive Shifts Worked to detect excessive shift stacking and prevent burnout.
- Staffing Pressure Assessment: Analyze Critical Role Vacancies to understand workload pressure on existing staff.
- Employee Engagement Evaluation: Evaluate Employee Engagement Score as an early indicator of morale and fatigue related attrition risk.
- Training Compliance Monitoring: Examine Training Compliance Rate to ensure safety critical personnel complete mandatory fatigue awareness training.
- Role Based Overtime Distribution: Use Overtime Distribution by Role to identify job functions carrying the highest overtime load.
- High Risk Personnel Identification: Drill into the Safety Critical Role Table to identify individuals with fatigue scores above acceptable limits and plan interventions.
Benefits of a LNG Operational Workforce Risk & Fatigue Overview Dashboard
The following are the benefits of using this dashboard:
- Early Fatigue Risk Detection: Identifies rising fatigue risks to reduce the likelihood of human error incidents.
- Regulatory Compliance Support: Helps meet occupational health, safety, and work hour regulations.
- Better Workforce Planning: Enables data driven staffing decisions to address critical role shortages.
- Overtime Cost Reduction: Improves workforce wellbeing and controls overtime expenses through better monitoring.
- Employee Retention Improvement: Helps address fatigue and engagement issues before they impact retention.
- Centralized Operational Insights: Combines HR, safety, and operational data into a single actionable view.
- Audit & Compliance Readiness: Maintains historical records for fatigue scores, overtime tracking, and training compliance.
KPIs to Track in a LNG Operational Workforce Risk & Fatigue Overview Dashboard
The following key KPIs can be tracked by using this dashboard:
- Fatigue Risk Score: A composite metric indicating the overall fatigue level of safety‑critical personnel.
- Overtime Percentage (%): Proportion of total working hours that are overtime, benchmarked against safe limits.
- Critical Role Vacancies: Number of unfilled positions that are essential for safe operations.
- Hours Worked per Week: Average weekly working hours per employee.
- Consecutive Shifts Worked: Average number of shifts worked back‑to‑back without a rest day.
- Employee Engagement Score: Survey‑based measure of job satisfaction and commitment.
- Training Compliance Rate (%): Percentage of required fatigue‑management training completed by staff.
- Overtime Distribution by Role: Total overtime hours broken down by job function.
- Critical Role Staffing Status (%): Visual breakdown of filled, vacant, and pending‑hire positions.
Frequently Asked Questions
Q1. What is considered a high Fatigue Risk Score?
While thresholds vary by organization, scores consistently above 50 often indicate an urgent need for intervention, such as shift adjustments or additional rest periods.
Q2. How often should this dashboard be updated?
For maximum effectiveness, update the dashboard daily or weekly. Real‑time feeds for hours worked and shift patterns are ideal, while engagement scores can be refreshed monthly.
Q3. Can the dashboard predict fatigue‑related incidents?
Yes. By correlating fatigue risk scores with historical incident data, the dashboard can highlight risk thresholds that precede safety events, enabling preventive action.
Q4. Which departments benefit most from this dashboard?
Operations, Maintenance, Engineering, and Security—any unit where employees work extended hours, rotating shifts, or in high‑consequence environments.
Q5. Is this dashboard applicable outside the LNG industry?
Absolutely. It is designed for any sector with safety‑critical roles, including aviation, healthcare, transportation, nuclear power, and heavy manufacturing.