What is an Electric Power Transmission Safety Dashboard?
An Electric Power Transmission Safety Dashboard is a centralized analytics platform that tracks, monitors, and analyzes safety performance across transmission line operations. It consolidates incident data, near-miss reports, permit-to-work compliance, safety training status, and investigation timelines into a single operational view. By combining field safety metrics with compliance indicators, this dashboard enables utilities to proactively manage risks associated with live-line work, tower climbing, switching activities, and right-of-way maintenance. It plays a critical role in electric grid safety monitoring by providing real-time visibility into workforce safety conditions and regulatory adherence across regions and crews.
How to Create an Electric Power Transmission Safety Dashboard
You don’t need to build your report from scratch, just start with a ready-to-use dashboard template from Mokkup. Add in your data and export it however you like. Here’s how to do it:
1. Create or Log in to Your Mokkup Account
Start by signing up on Mokkup.ai using your email. If you already have an account, just log in, and you’ll be good to go.
2. Choose and Customize Your Dashboard Template
Find the Electric Power Transmission Safety Dashboard template in the Templates section. Use the drag-and-drop editor to adjust KPIs, edit filters, or add elements based on your data.
3. Export to Your BI Tool
Once your dashboard wireframe is ready, use the BI Tool Export feature to send it directly to Power BI or Tableau for further analysis and enhancements. You can also download the dashboard as a PDF, PNG, or JPEG, embed it on a platform, or invite your team to collaborate.
Note: This is a Pro template. You’ll need a Pro subscription on Mokkup to use and customize this dashboard wireframe. Upgrade anytime to unlock full access.
Electric Power Transmission Safety Dashboard Example
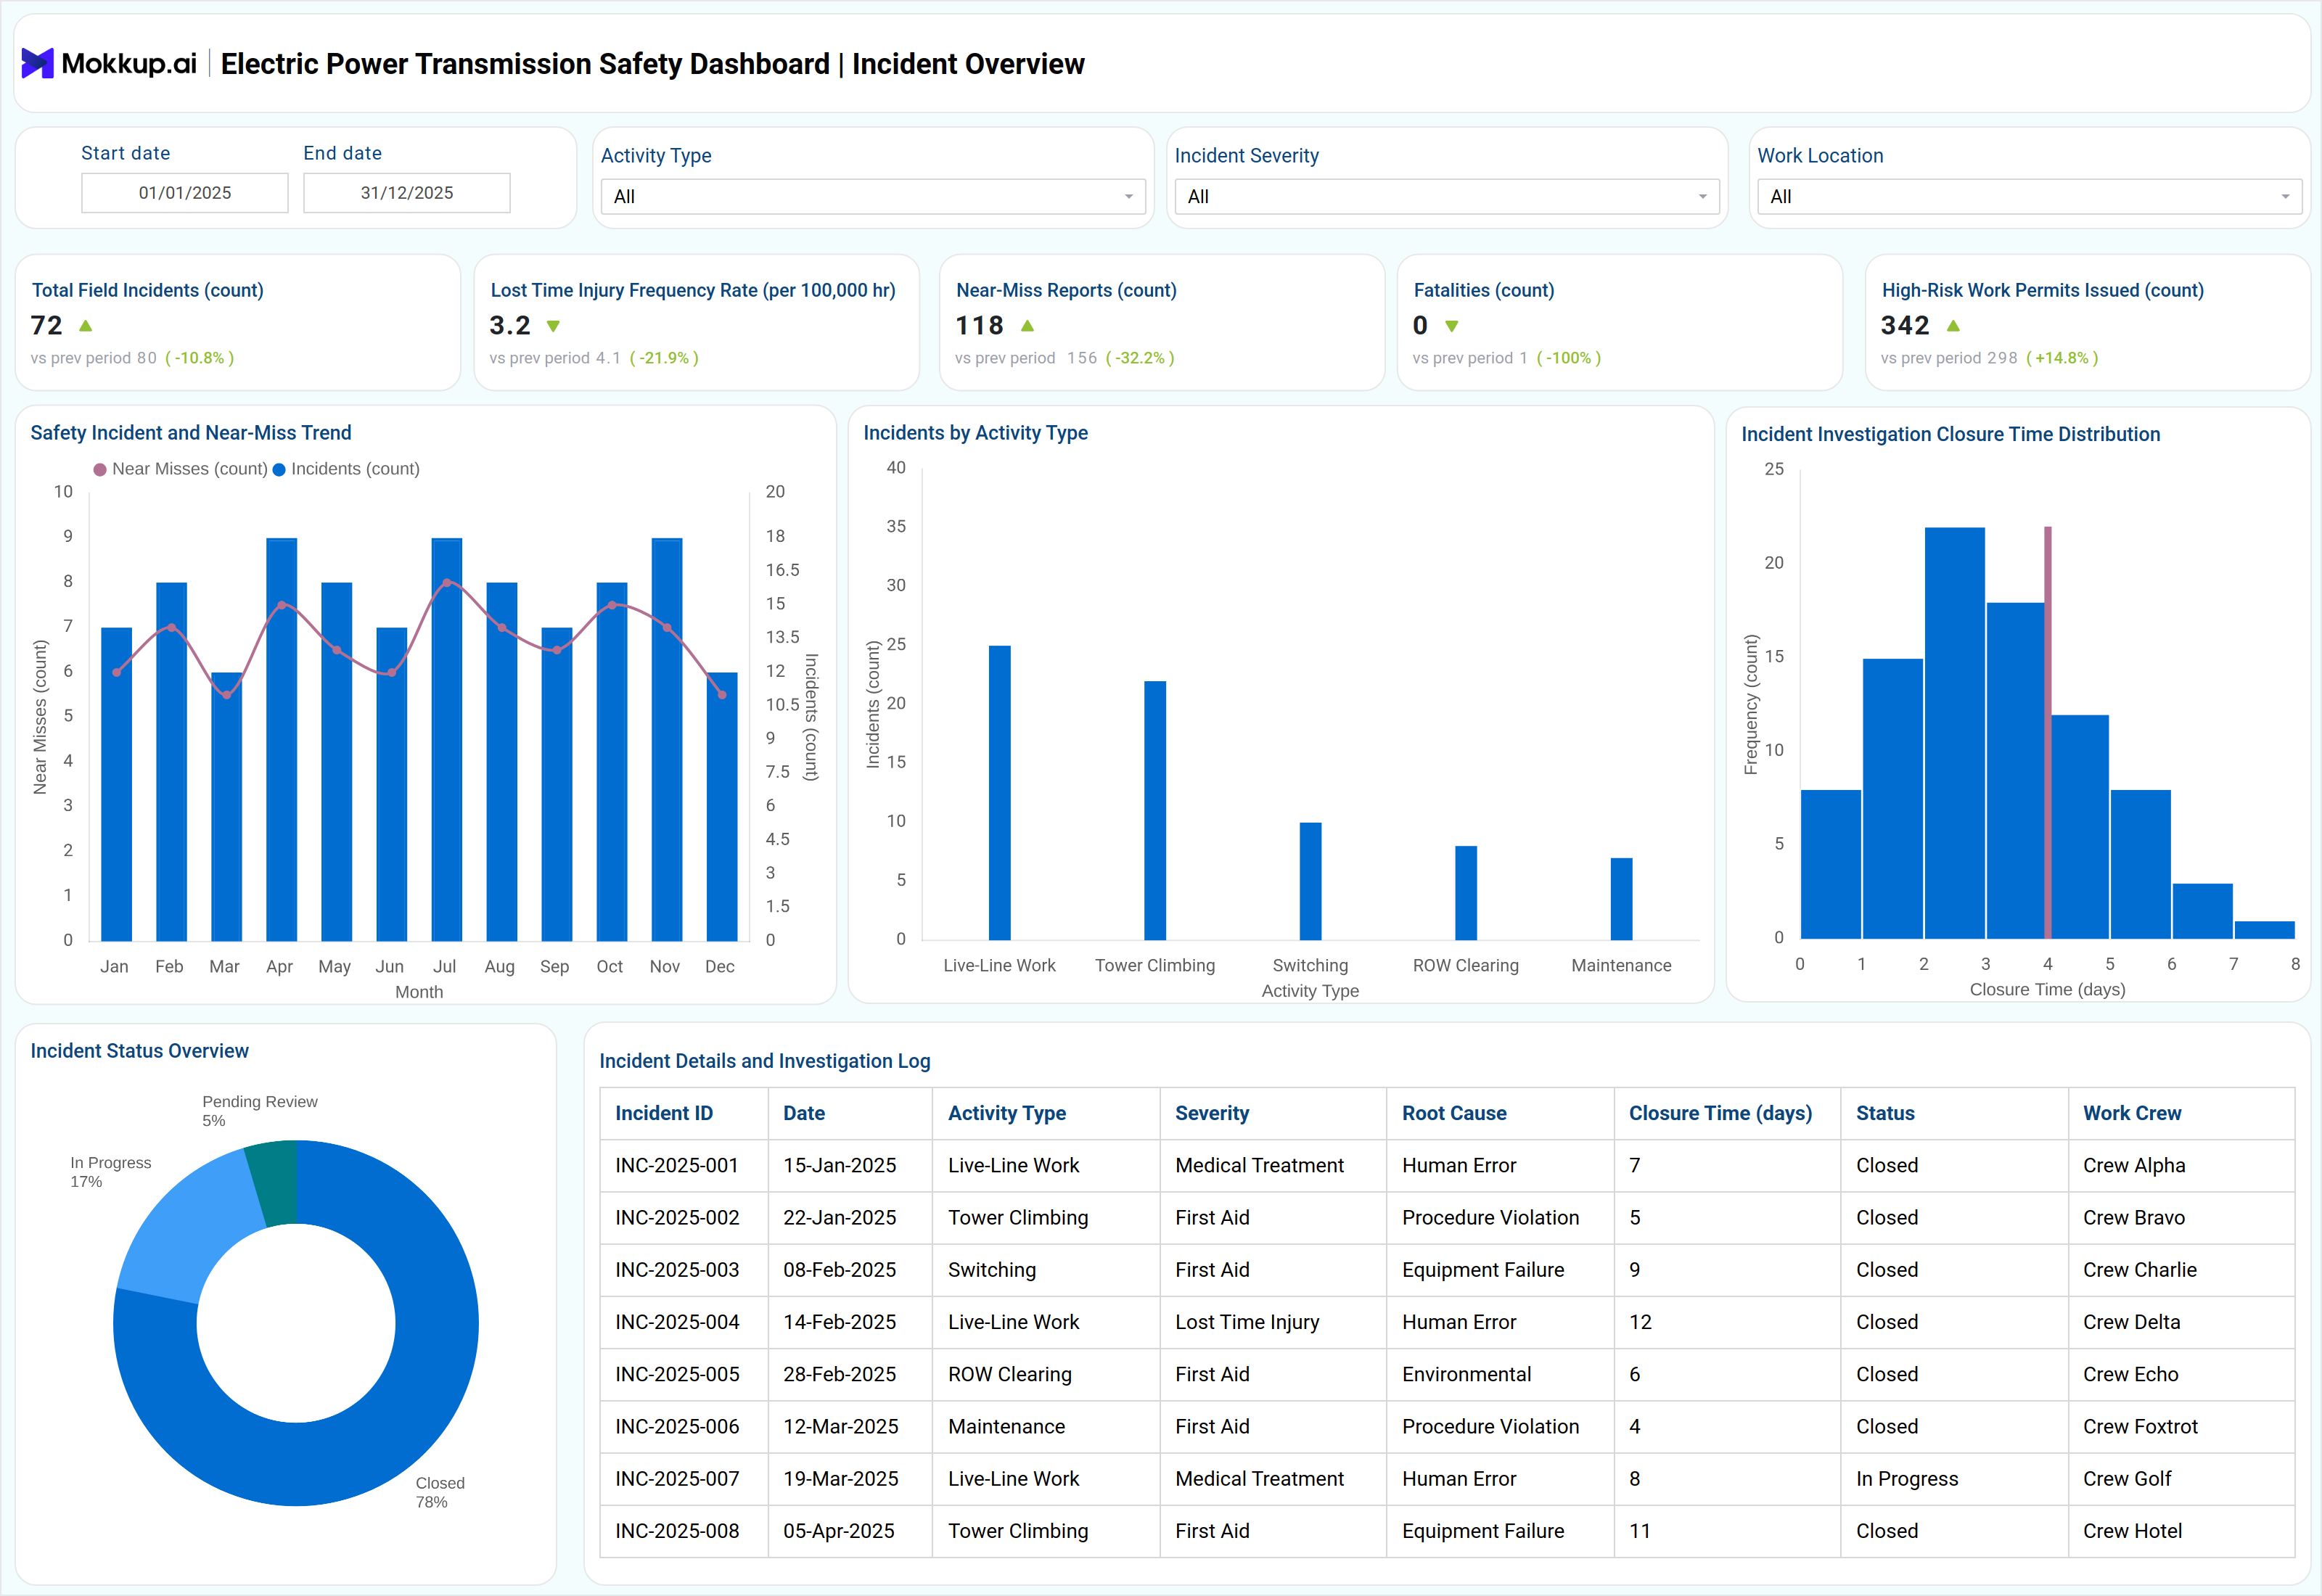
You can build your own Electric Power Transmission Safety Dashboard to gain a structured view of safety incidents and compliance performance across transmission operations. A typical power transmission safety dashboard begins with a safety incident overview that highlights the total number of field incidents, the lost-time injury frequency rate (LTIFR), near-miss reports, fatalities, and high-risk work permits issued during the selected period. Monthly trends help teams understand whether safety performance is improving or deteriorating. The dashboard further categorizes incidents by activity type, such as live-line work, tower climbing, switching, right-of-way clearing, and maintenance.
Incident investigation closure time distributions reveal how quickly root causes are addressed, while status views show closed, in-progress, and pending investigations. A dedicated safety and compliance section focuses on power transmission safety compliance, including training compliance rates, permit-to-work adherence, PPE compliance, contractor safety performance, and open safety observations. Visual breakdowns by department highlight compliance gaps, while detailed logs track incident root causes, corrective actions, and crew accountability. Together, these views support the monitoring of transmission workforce safety and the continuous reduction of risk.
How to Analyze Electric Power Transmission Safety Dashboard
Here is how you can analyze data from this dashboard:
- Review total field incidents and LTIFR to assess overall safety performance trends
- Compare near-miss reports against incidents to evaluate proactive hazard reporting culture
- Analyze incidents by activity type to identify high-risk transmission tasks
- Track investigation closure times to ensure timely corrective actions
- Monitor permit-to-work approval and expiration status for operational compliance
- Evaluate PPE and training compliance rates across departments
- Identify recurring root causes such as human error, procedure violations, or equipment failure
- Use departmental compliance comparisons to prioritize safety interventions
Benefits of Electric Power Transmission Safety Dashboard
The following are the benefits of using this dashboard:
- Improves visibility into electric power transmission safety across field operations
- Reduces accident frequency through early risk identification
- Strengthens regulatory readiness and audit preparedness
- Enhances contractor and workforce accountability
- Enables data-driven safety decision-making
- Shortens incident investigation and closure cycles
- Supports standardized safety practices across regions
- Improves overall electric utility safety performance
KPIs to Track in Electric Power Transmission Safety Dashboard
The following key KPIs can be tracked by using this dashboard:
- Total Field Incidents – Number of safety incidents recorded during the period
- Lost Time Injury Frequency Rate (LTIFR) – Injury rate per 100,000 working hours
- Near-Miss Reports – Count of reported near-miss safety events
- Fatalities – Number of fatal safety incidents
- High-Risk Work Permits Issued – Volume of permits for hazardous activities
- Incident Closure Time – Average days taken to close investigations
- Safety Training Compliance – Percentage of workforce meeting training requirements
- Permit-to-Work Compliance – Percentage of approved and valid permits
- PPE Compliance Rate – Adherence to required personal protective equipment
- Open Safety Observations – Unresolved safety findings requiring action
Frequently Asked Questions
1. What is the purpose of an Electric Power Transmission Safety Dashboard?
It provides centralized visibility into safety incidents, compliance, and workforce risk across transmission operations.
2. How does it support electric grid safety monitoring?
By tracking incidents, near misses, and compliance metrics in real time, it enables proactive risk management.
3. Who uses a power transmission safety dashboard?
Safety managers, transmission operations teams, compliance officers, and utility leadership.
4. Can it help reduce safety incidents?
Yes. Trend analysis and root cause insights help prevent repeat incidents.
5. Is the dashboard useful for regulatory audits?
Yes. It maintains structured records of incidents, permits, training, and corrective actions.