What is an LNG Regasification Operations Performance Report
An LNG Regasification Operations Performance Report is a structured analytics report used by natural gas utilities and LNG terminal operators to monitor regasification performance, berth activity, pipeline compliance, downtime, and cost efficiency. This report consolidates operational KPIs such as LNG vessel turnaround time, berth utilization, regasification throughput (MMBtu/day), pipeline pressure compliance, demurrage costs, and forced outage rate into a centralized LNG regasification operations performance dashboard report.
The report provides visibility into terminal productivity, asset utilization, and operational risks. It enables operations managers and executives to evaluate throughput stability, infrastructure reliability, and cost exposure. By integrating operational, maintenance, and compliance metrics, the dashboard supports data-driven decisions across regasification terminals and pipeline networks.
How to Create an LNG Regasification Operations Performance Report
You don't need to build your report from scratch, just start with a ready-to-use dashboard template from Mokkup. Add in your data and export it however you like. Here's how to do it:
1. Create or Log in to Your Mokkup Account
Start by signing up on Mokkup.ai using your email. If you already have an account, just log in, and you'll be good to go.
2. Choose and Customize Your Dashboard Template
Find the LNG Regasification Operations Performance Report template in the Templates section. Use the drag-and-drop editor to adjust KPIs, edit filters, or add elements based on your data.
3. Export to Your BI Tool
Once your dashboard wireframe is ready, use the BI Tool Export feature to send it directly to Power BI or Tableau for further analysis and enhancements. You can also download the dashboard as a PDF, PNG, or JPEG, embed it on a platform, or invite your team to collaborate.
Note: This is a Pro template. You'll need a Pro subscription on Mokkup to use and customize this dashboard wireframe. Upgrade anytime to unlock full access.
LNG Regasification Operations Performance Report Example
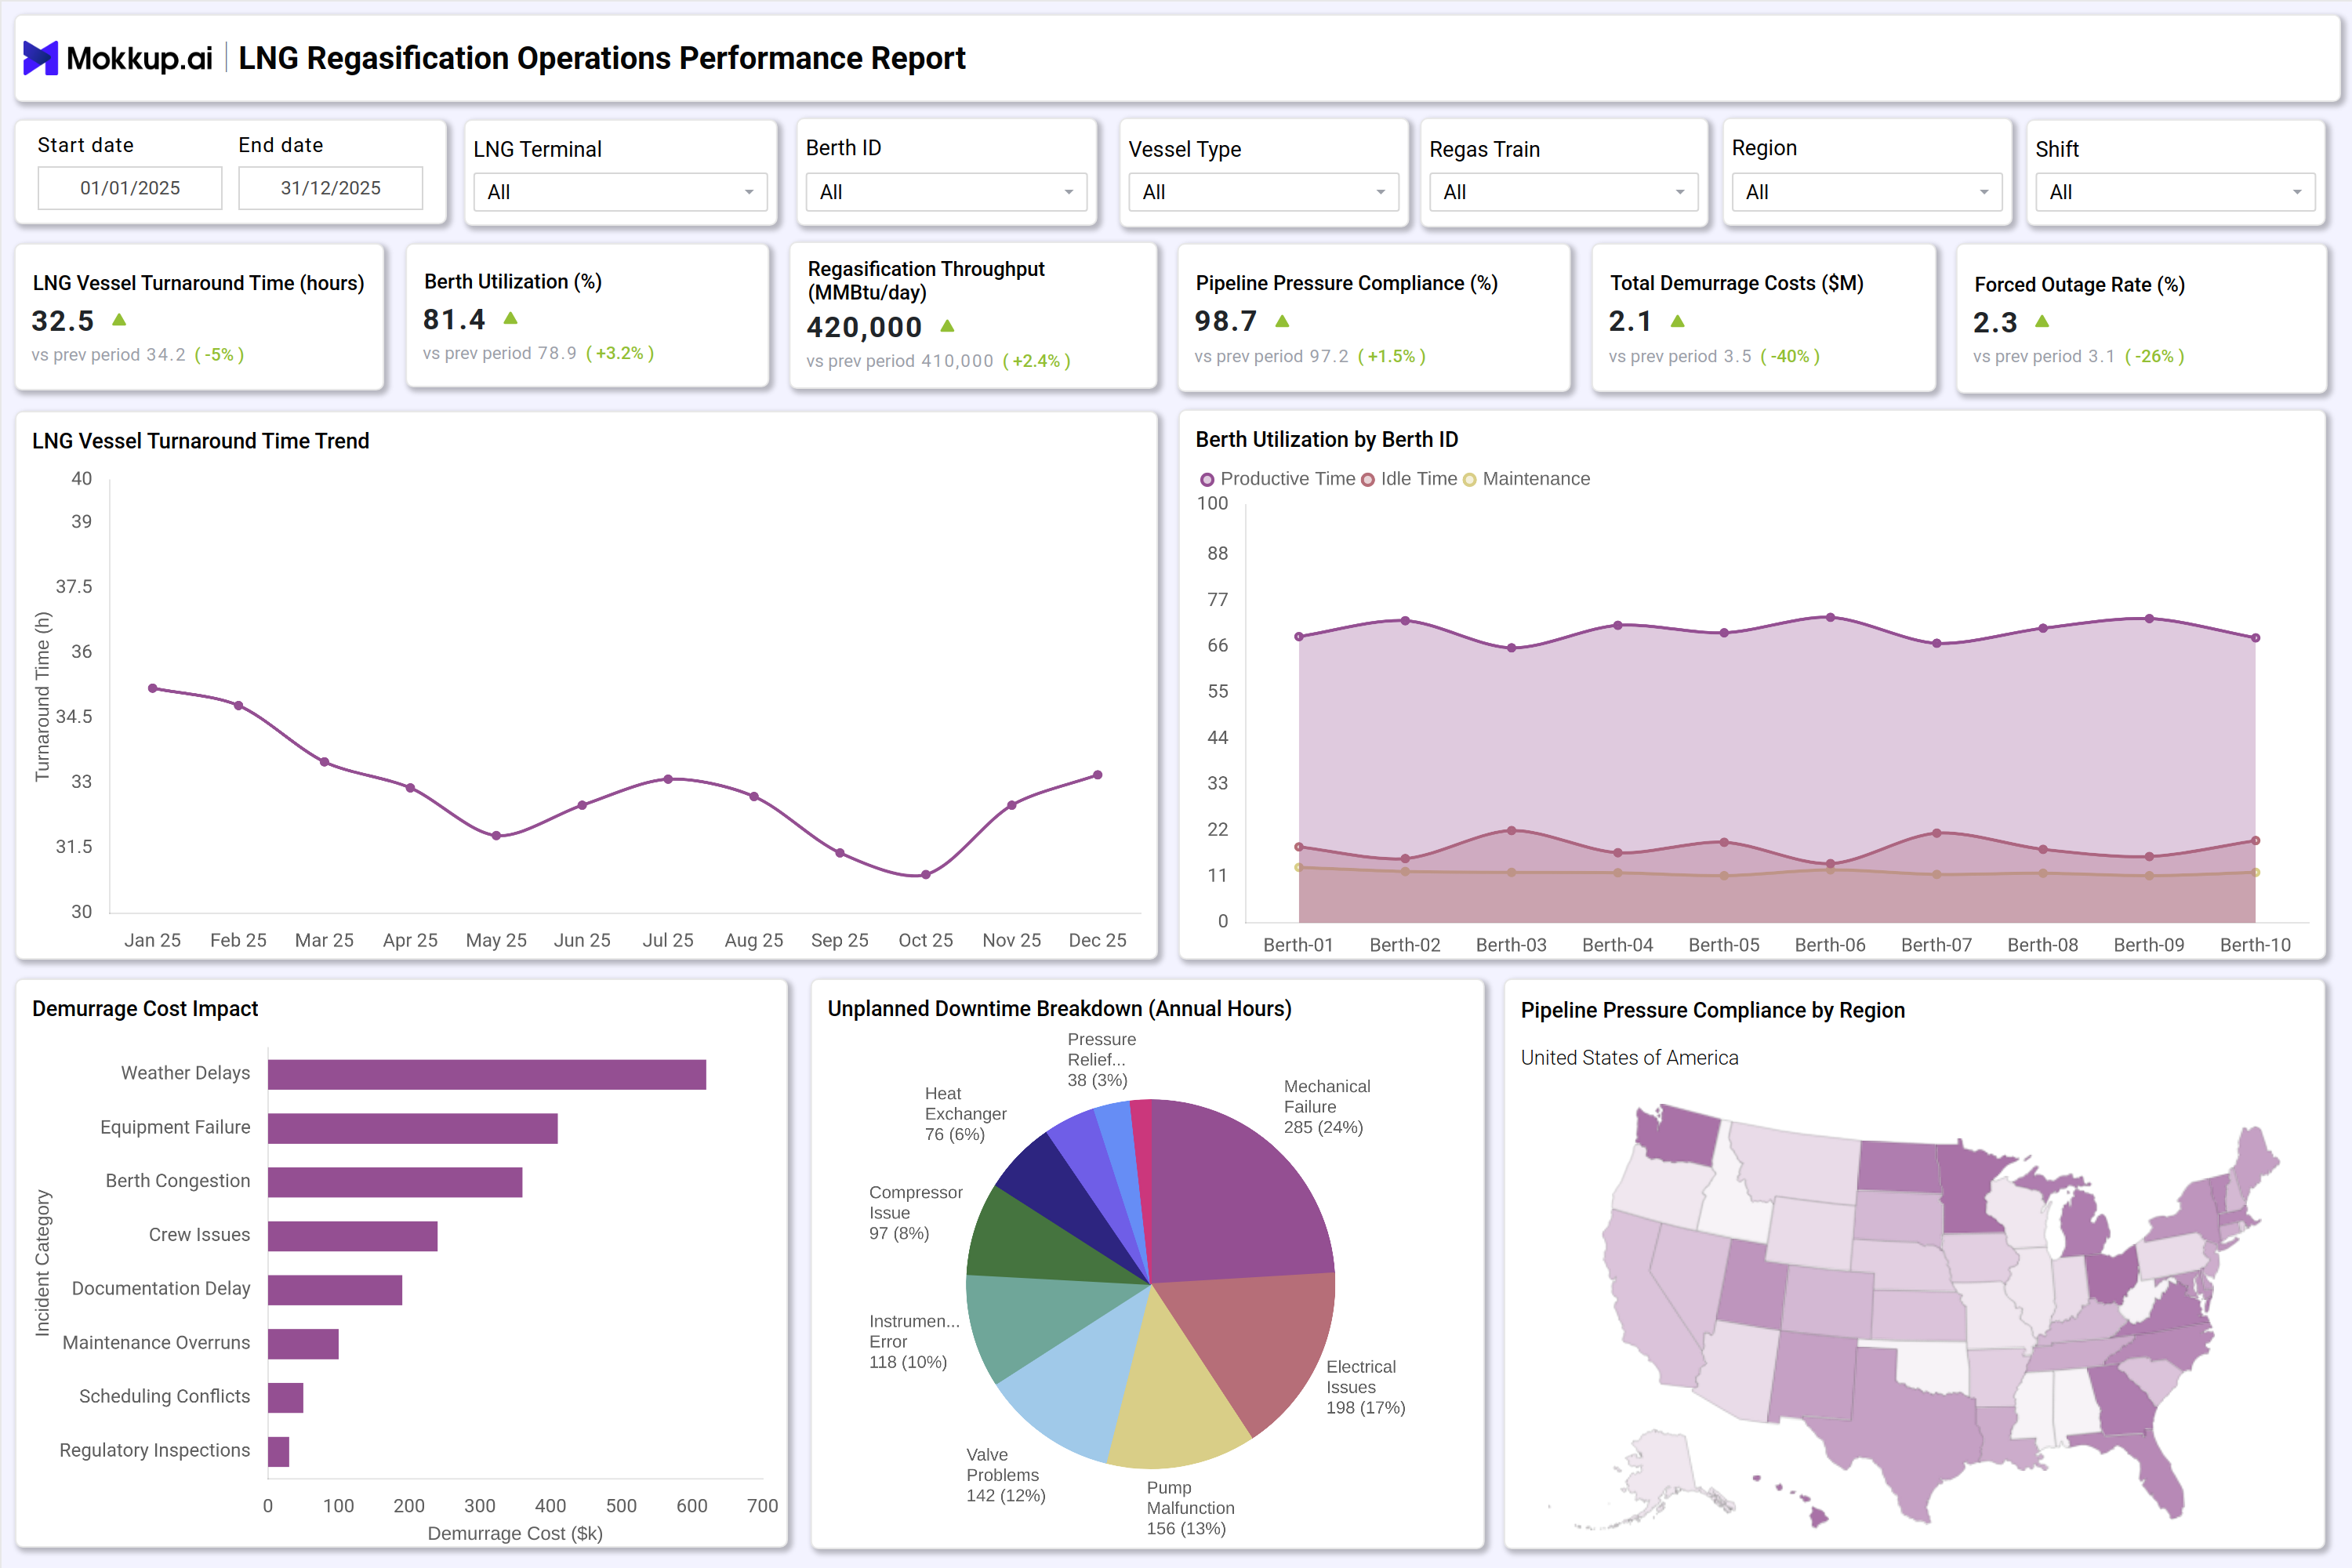
A standard LNG regasification operations performance dashboard report includes filter controls such as date range, LNG terminal, berth ID, vessel type, regas train, region, and shift. These filters allow detailed operational analysis.
The dashboard typically displays KPI cards including LNG vessel turnaround time (hours), berth utilization (%), regasification throughput (MMBtu/day), pipeline pressure compliance (%), total demurrage costs ($M), and forced outage rate (%). Trend charts show the monthly turnaround time movement. An LNG berth utilization rate monitoring dashboard visual breaks down productive, idle, and maintenance time by berth ID.
An LNG terminal demurrage cost impact analysis report highlights cost drivers such as weather delays, equipment failure, berth congestion, and documentation delays. The LNG regasification unplanned downtime breakdown report categorizes downtime into mechanical failure, electrical issues, valve problems, compressor issues, and instrumentation errors. An LNG regional pipeline pressure compliance monitoring report displays compliance percentages across regions to assess regulatory adherence and operational stability.
How to Analyze Data in a LNG Regasification Operations Performance Report
Here is how you can analyze data from this dashboard:
- Compare LNG vessel turnaround time month-over-month: Identifies delays in berthing/unloading to uncover operational inefficiencies.
- Monitor berth utilization trends: Detects idle capacity and improves berth planning using utilization insights.
- Evaluate regasification throughput vs. capacity: Highlights asset productivity gaps by comparing output with installed capacity.
- Review pipeline pressure compliance percentages: Flags regional deviations to ensure safety and regulatory compliance.
- Analyze demurrage cost categories: Pinpoints cost drivers to isolate delays and operational bottlenecks.
- Examine forced outage rate trends: Assesses equipment reliability and helps prioritize maintenance actions.
- Identify unplanned downtime root causes: Reveals recurring failures to enable proactive issue resolution.
- Correlate maintenance hours with throughput drops: Shows the impact of maintenance on output to optimize scheduling.
Benefits of an LNG Regasification Operations Performance Report
The following are the benefits of using this dashboard:
- Improves berth scheduling and vessel turnaround efficiency: Optimizes vessel handling to reduce delays and improve port operations.
- Reduces demurrage exposure through cost impact visibility: Provides cost insights to minimize penalties from operational delays.
- Enhances asset utilization and regas train productivity: Maximizes output by ensuring efficient use of regasification assets.
- Strengthens compliance monitoring through regional pipeline tracking: Resolution by pinpointing failure sources.
- Supports preventive maintenance planning using KPI trends: Uses performance trends to schedule maintenance proactively.
- Enables executive-level operational benchmarking across terminals: Provides comparative insights for better strategic decision-making.
- Improves reliability by tracking forced outage rate patterns: Helps reduce disruptions by monitoring and addressing outage trends.
KPIs to Track in a LNG Regasification Operations Performance Report
The following key KPIs can be tracked by using this dashboard:
- LNG Vessel Turnaround Time (Hours): Measures the average time required to process a vessel from arrival to departure. Lower turnaround time improves berth efficiency.
- Berth Utilization (%): Indicates the percentage of time berths are actively used for productive operations. High utilization reflects optimal asset usage.
- Regasification Throughput (MMBtu/day): Tracks the daily volume of LNG converted to natural gas. This KPI reflects terminal output capacity.
- Pipeline Pressure Compliance (%): Measures adherence to pipeline pressure standards. Critical for safety and regulatory compliance.
- Total Demurrage Costs ($M): Quantifies financial penalties due to vessel delays. Helps evaluate scheduling and congestion issues.
- Forced Outage Rate (%): Represents the percentage of time operations are interrupted due to unexpected failures. Indicates equipment reliability.
- Unplanned Downtime (Annual Hours): Captures total downtime caused by mechanical, electrical, or system issues. Used for reliability assessment.
- Productive vs Idle vs Maintenance Time (%): Breaks down berth operational time into activity categories for utilization optimization.
Frequently Asked Questions
1. Who uses an LNG Regasification Operations Performance Report?
Operations managers, terminal supervisors, maintenance teams, and energy utility executives use it to monitor performance and cost efficiency.
2. How does this report reduce demurrage costs?
By identifying congestion, delays, and turnaround inefficiencies through the LNG terminal demurrage cost impact analysis report.
3. Why is pipeline pressure compliance important?
Pipeline pressure compliance ensures safe gas transmission and regulatory adherence across regions.
4. What causes high forced outage rates?
Mechanical failures, electrical issues, compressor breakdowns, and instrumentation errors typically increase outage rates.
5. How often should this dashboard be reviewed?
Daily monitoring is recommended for operations teams, while monthly reviews support executive-level performance analysis.