
What is an LNG Energy Transition & Carbon Reduction Dashboard
An LNG Energy Transition & Carbon Reduction Dashboard is a strategic visualization platform designed to monitor, analyze, and report on decarbonization initiatives and energy transition progress across LNG operations. It consolidates critical sustainability and transition metrics, including carbon intensity, emissions reduction progress, renewable energy integration, CCUS (Carbon Capture, Utilization, and Storage) capacity, hydrogen co-firing volumes, offset portfolio status, and transition investment allocation into a unified, forward-looking interface.
By integrating LNG decarbonization tracking, carbon reduction roadmap monitoring, and energy transition metrics for gas infrastructure, this dashboard enables sustainability directors, transition strategists, and executive leadership to measure progress toward net-zero commitments, optimize transition investments, and communicate credible climate action to stakeholders. It serves as a central command center for navigating the complex journey from conventional LNG operations to low-carbon energy solutions.
How to Create an LNG Energy Transition & Carbon Reduction Dashboard
You don't need to build your report from scratch, just start with a ready-to-use dashboard template from Mokkup. Add in your data and export it however you like. Here's how to do it:
1. Create or Log in to Your Mokkup Account
Start by signing up on Mokkup.ai using your email. If you already have an account, just log in, and you'll be good to go.
2. Choose and Customize Your Dashboard Template
Find the LNG Energy Transition & Carbon Reduction Dashboard template in the Templates section. Use the drag-and-drop editor to adjust KPIs, edit filters, or add elements based on your data.
3. Export to Your BI Tool
Once your dashboard wireframe is ready, use the BI Tool Export feature to send it directly to Power BI or Tableau for further analysis and enhancements. You can also download the dashboard as a PDF, PNG, or JPEG, embed it on a platform, or invite your team to collaborate.
Note: This is a Pro template. You'll need a Pro subscription on Mokkup to use and customize this dashboard wireframe. Upgrade anytime to unlock full access.
LNG Energy Transition & Carbon Reduction Dashboard Example
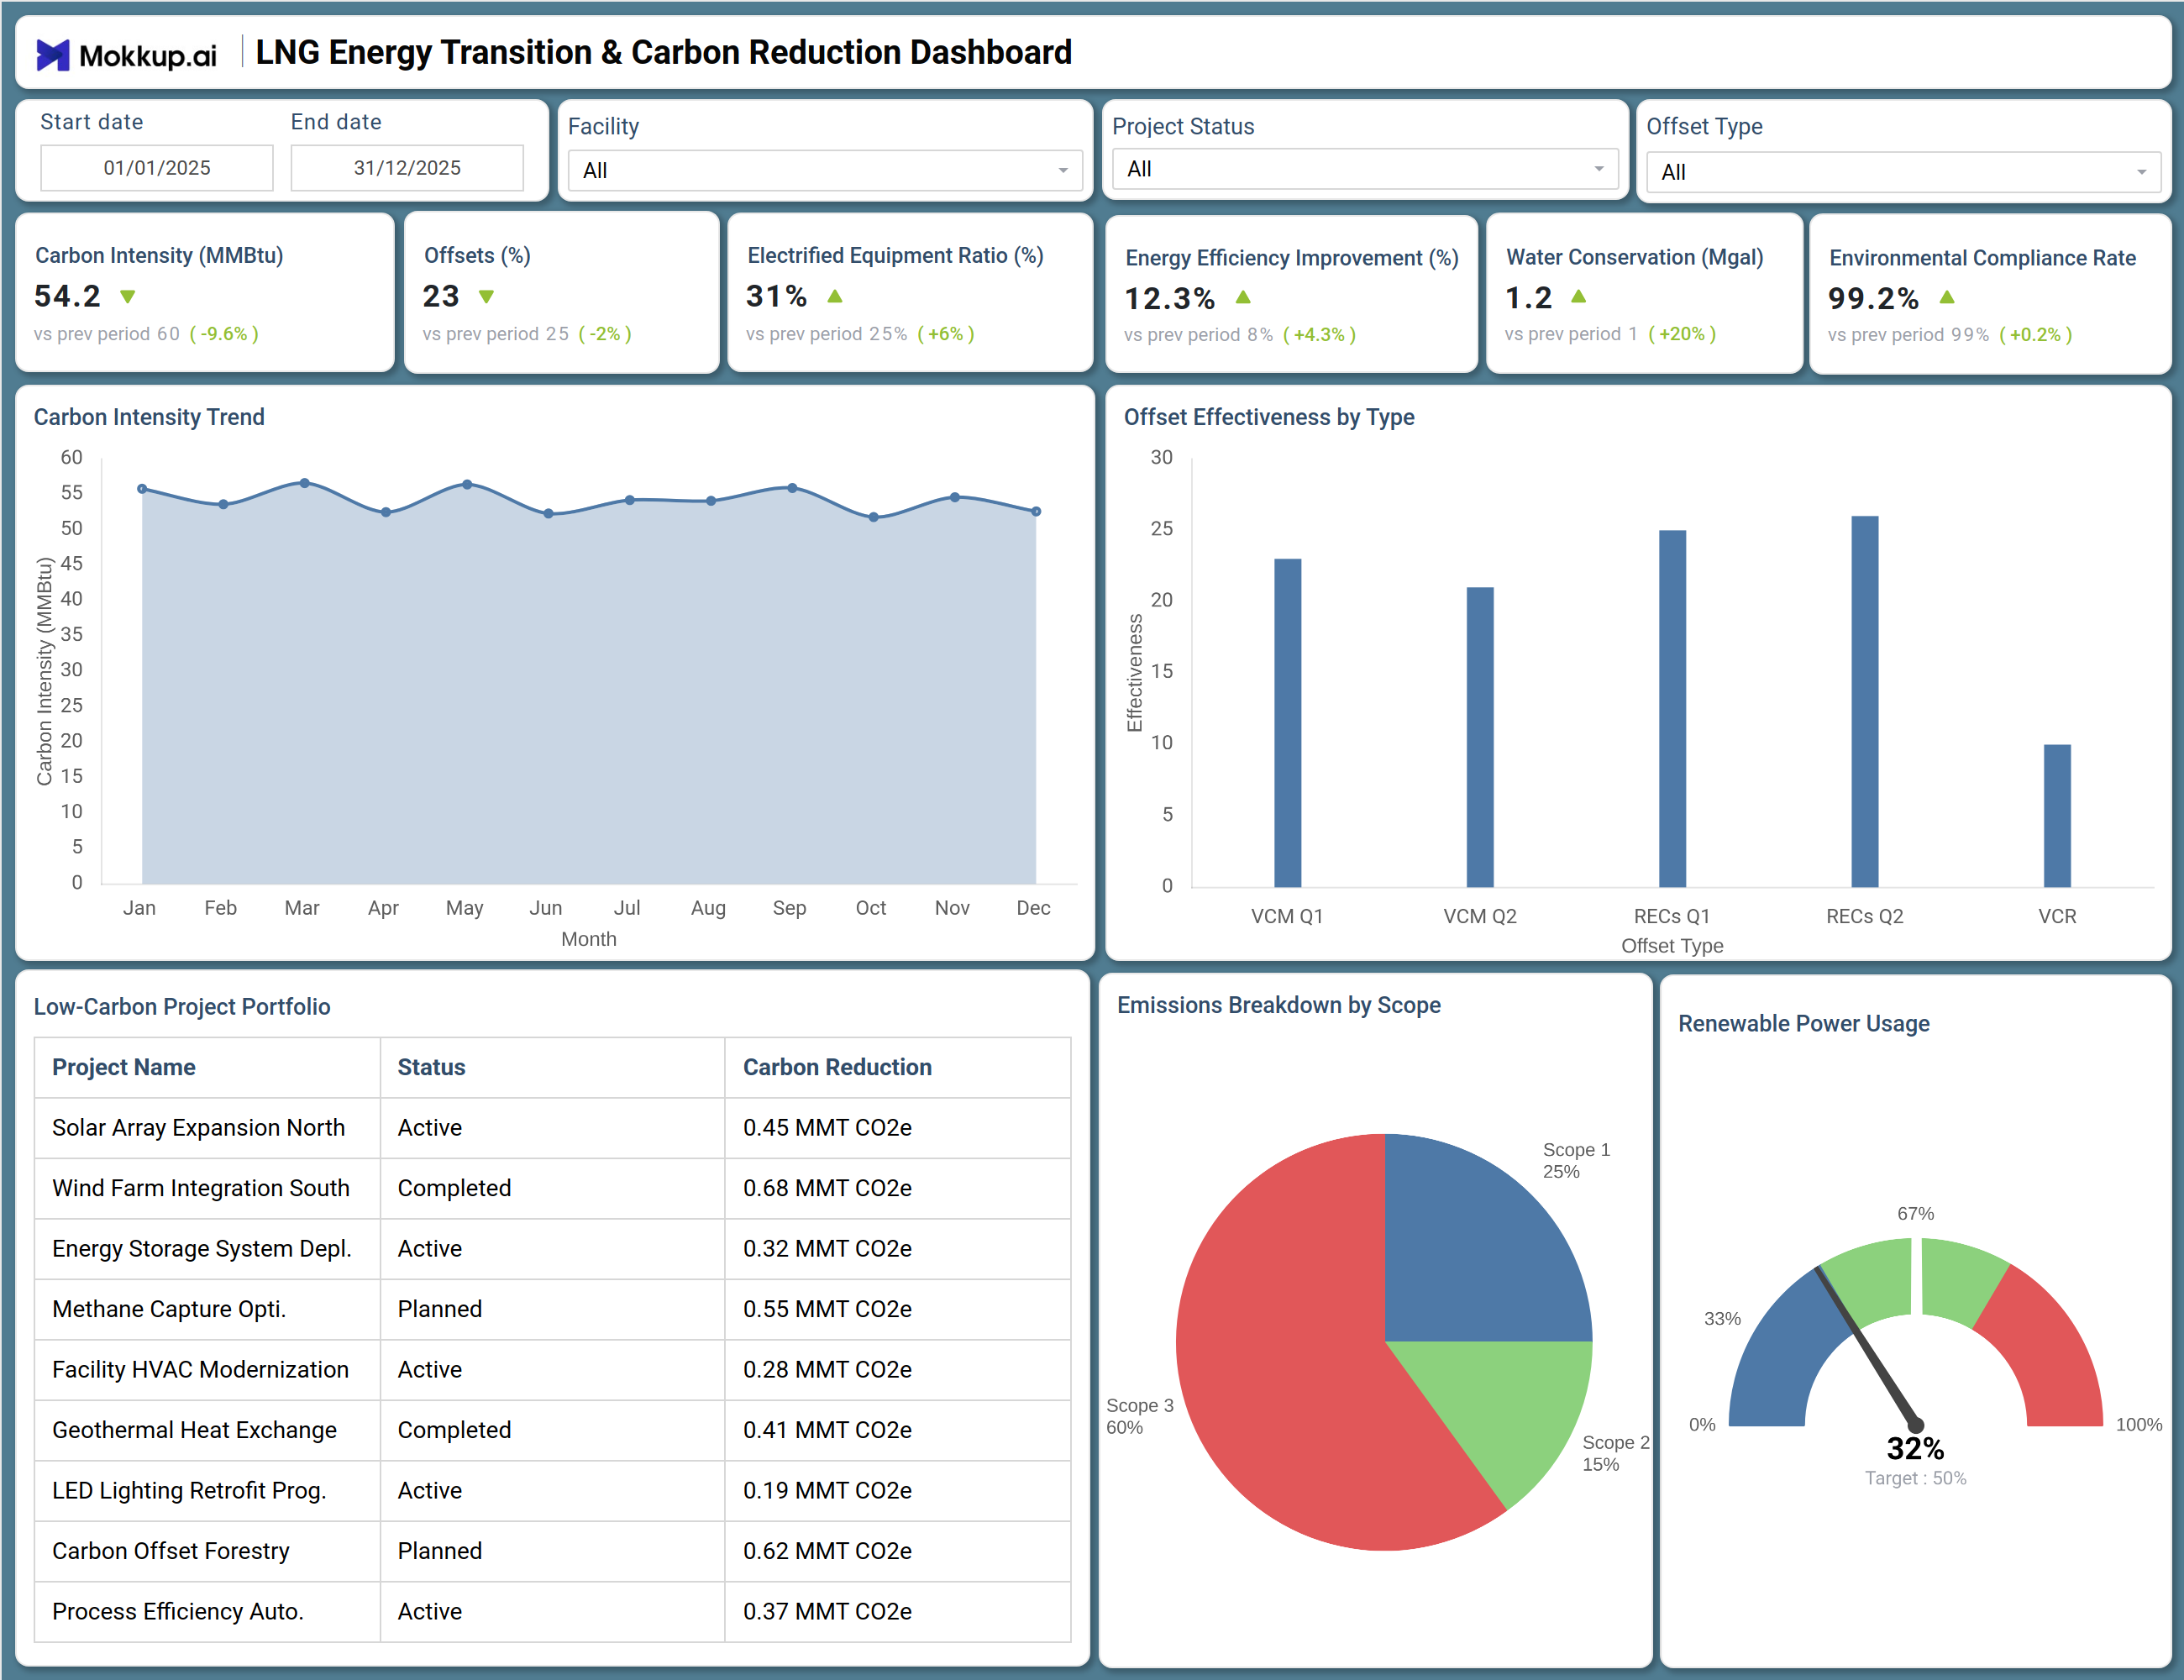
This dashboard delivers a comprehensive view of decarbonization progress and energy transition initiatives across LNG operations. The Overview screen prominently displays critical transition KPIs including Carbon Intensity (tCO₂e/tonne LNG), Emissions Reduction Progress (% vs baseline), Renewable Energy Integration (%), CCUS Capacity (MTPA), Hydrogen Co-Firing Volume (MMBTU), Offset Portfolio (metric tons CO₂e), and Transition Investment ($M).
The carbon intensity trend chart tracks emissions per unit of production over time against reduction targets, revealing progress and areas requiring acceleration. Emissions Reduction Roadmap Progress provides a visual breakdown of achieved versus planned reductions by initiative type, efficiency gains, electrification, CCUS, and offsets. Renewable Energy Integration by Facility compares clean energy adoption across terminals, enabling benchmarking and best practice sharing. The CCUS Capacity Development gauge shows current capture capacity against near-term and long-term targets. Hydrogen Co-Firing Trials Status tracks pilot project progress across liquefaction and power generation assets. Offset Portfolio Composition breaks down carbon credits by type (nature-based, technology-based, avoidance) and vintage. The Transition Investment Allocation pie chart shows capital deployment across decarbonization levers. Together, these components enable LNG carbon intensity monitoring, decarbonization roadmap tracking, and data-driven energy transition management.
How to Analyze Data in an LNG Energy Transition & Carbon Reduction Dashboard
Here is how you can analyze data from this dashboard:
- Carbon Intensity (tCO₂e/tonne LNG): Monitor trends over time to measure how effectively emissions reduction initiatives are working and to benchmark performance against industry peers.
- Emissions Reduction Progress (%): Track progress against your baseline to ensure the organization stays aligned with both short-term targets and long-term climate commitments.
- Renewable Energy Integration (%): Analyze the share of renewable energy used to evaluate clean energy adoption and identify facilities that are falling behind.
- CCUS Capacity (MTPA): Review carbon capture capacity growth against roadmap milestones to confirm infrastructure is scaling as planned.
- Hydrogen Co-Firing Volumes: Assess how much hydrogen is being used as a substitute for traditional fuels to track progress in low-carbon operations.
- Offset Portfolio Quality & Size: Evaluate the composition of carbon credits to ensure they meet standards like additionality, credibility, and alignment with removal goals.
- Transition Investment Allocation: Examine where capital is being invested to ensure funds are directed toward the most impactful decarbonization initiatives.
- Facility-Level Benchmarking: Compare performance across plants to identify leaders and laggards in emissions reduction and renewable adoption.
- Investment vs. Impact Correlation: Analyze how capital investments translate into emissions reduction to understand the return on transition spending.
- Pilot Project Progress Tracking: Monitor the status of pilot initiatives to ensure new technologies move from testing phases to full-scale deployment.
Benefits of an LNG Energy Transition & Carbon Reduction Dashboard
The following are the benefits of using this dashboard:
- Centralized, Real-Time Visibility: Get a unified view of decarbonization progress across all LNG operations, enabling faster and more informed decision-making.
- Credible Climate Reporting: Deliver transparent and auditable metrics that build trust with investors, regulators, and key stakeholders.
- Science-Based Target Alignment: Support goal setting and tracking that aligns with global frameworks like the Paris Agreement.
- Optimized Capital Allocation: Identify which initiatives generate the highest emissions reduction per dollar, ensuring efficient use of transition investments.
- Performance Gap Identification: Quickly spot underperforming facilities or initiatives that require additional resources or strategic focus.
- Industry Benchmarking: Compare performance against peers and adopt emerging best practices in LNG decarbonization.
- Stronger Climate Communication: Back sustainability narratives with data, improving credibility and stakeholder confidence.
- Regulatory Compliance Support: Stay aligned with evolving disclosure frameworks such as CSRD, SEC, and TCFD requirements.
- Demonstrated Energy Transition Leadership: Showcase commitment to sustainability and position your organization as a leader to customers, investors, and communities.
KPIs to Track in an LNG Energy Transition & Carbon Reduction Dashboard
The following key KPIs can be tracked by using this dashboard:
- Carbon Intensity (tCO₂e/tonne LNG): Emissions per unit of LNG produced, enabling efficiency benchmarking.
- Emissions Reduction Progress (%): Cumulative emissions reduction against baseline year.
- Renewable Energy Integration (%): Percentage of total energy consumption from renewable sources.
- CCUS Capacity (MTPA): Installed carbon capture, utilization, and storage capacity in million tonnes per annum.
- Hydrogen Co-Firing Volume (MMBTU): Volume of hydrogen blended with natural gas for combustion.
- Offset Portfolio (metric tons CO₂e): Total carbon credits held, retired, or available for compliance or voluntary use.
- Transition Investment ($M): Capital deployed toward decarbonization initiatives.
- Methane Intensity (%): Methane emissions as percentage of production (critical for near-term warming impact).
- Electrification Rate (%): Percentage of equipment and processes converted from gas to electric power.
- Low-Carbon Revenue (%): Share of revenue from low-carbon products (renewable natural gas, hydrogen, etc.).
- R&D Investment in Transition Tech: Funding allocated to emerging decarbonization technologies.
Frequently Asked Questions
1. What is carbon intensity for LNG and why does it matter?
Carbon intensity measures greenhouse gas emissions per unit of LNG produced (typically tCO₂e per tonne of LNG). It matters because it enables comparison of emissions performance across facilities and companies, supports target setting, and is increasingly used by buyers to differentiate LNG cargoes based on environmental credentials.
2. What are the main levers for LNG decarbonization?
Key levers include energy efficiency improvements, electrification of equipment using renewable power, methane leak detection and repair, carbon capture and storage (CCUS), hydrogen co-firing, and high-quality carbon offsets for residual emissions.
3. How does this dashboard support transition planning?
By tracking progress across multiple decarbonization levers and comparing actual performance against roadmap milestones, the dashboard enables leaders to identify gaps, reallocate resources, and adjust timelines to ensure climate commitments remain achievable.
4. How often should transition metrics be updated?
Carbon intensity and methane intensity should be monitored monthly or quarterly. Progress against roadmap milestones and investment allocations are typically reviewed quarterly, while comprehensive transition strategy updates occur annually.
5. Is this dashboard relevant for companies with different transition timelines?
Yes. The dashboard can be customized to reflect any transition timeline from near-term 2030 targets to long-term 2050 net-zero commitments by adjusting baseline years, target curves, and milestone dates.