
What is a LNG Emissions & Environmental Impact Dashboard
An LNG Emissions & Environmental Impact Dashboard is a strategic visualization platform designed to monitor, analyze, and report on environmental performance metrics across LNG operations. It consolidates critical sustainability data, including methane intensity, flaring volume, CO₂e emissions by scope, renewable energy usage, waste recycling rates, EPA compliance status, and environmental incidents into a unified, interactive interface.
By integrating LNG emissions tracking, methane intensity monitoring, and scope 1, 2, and 3 emissions reporting, this dashboard enables environmental managers, sustainability officers, and facility leaders to reduce carbon footprint, ensure regulatory compliance, track greenhouse gas reduction progress, and drive continuous improvement toward net-zero goals. It serves as a central command center for environmental stewardship, carbon accounting, incident management, and sustainability performance across the LNG value chain.
How to Create a LNG Emissions & Environmental Impact Dashboard
You don’t need to build your report from scratch—just start with a ready-to-use LNG Emissions & Environmental Impact dashboard template from Mokkup. Add in your data and export it however you like. Here’s how to do it:
1. Create or Log in to Your Mokkup Account
Start by signing up on Mokkup.ai using your email. If you already have an account, just log in, and you'll be good to go.
2. Choose and Customize Your Dashboard Template
Find the LNG Emissions & Environmental Impact Dashboard template in the Templates section. Use the drag-and-drop editor to adjust KPIs, edit filters, or add elements based on your data.
3. Export to Your BI Tool
Once your dashboard wireframe is ready, use the BI Tool Export feature to send it directly to Power BI or Tableau for further analysis and enhancements. You can also download the dashboard as a PDF, PNG, or JPEG, embed it on a platform, or invite your team to collaborate.
Note: This is a Pro template. You'll need a Pro subscription on Mokkup to use and customize this dashboard wireframe. Upgrade anytime to unlock full access.
LNG Emissions & Environmental Impact Dashboard Example
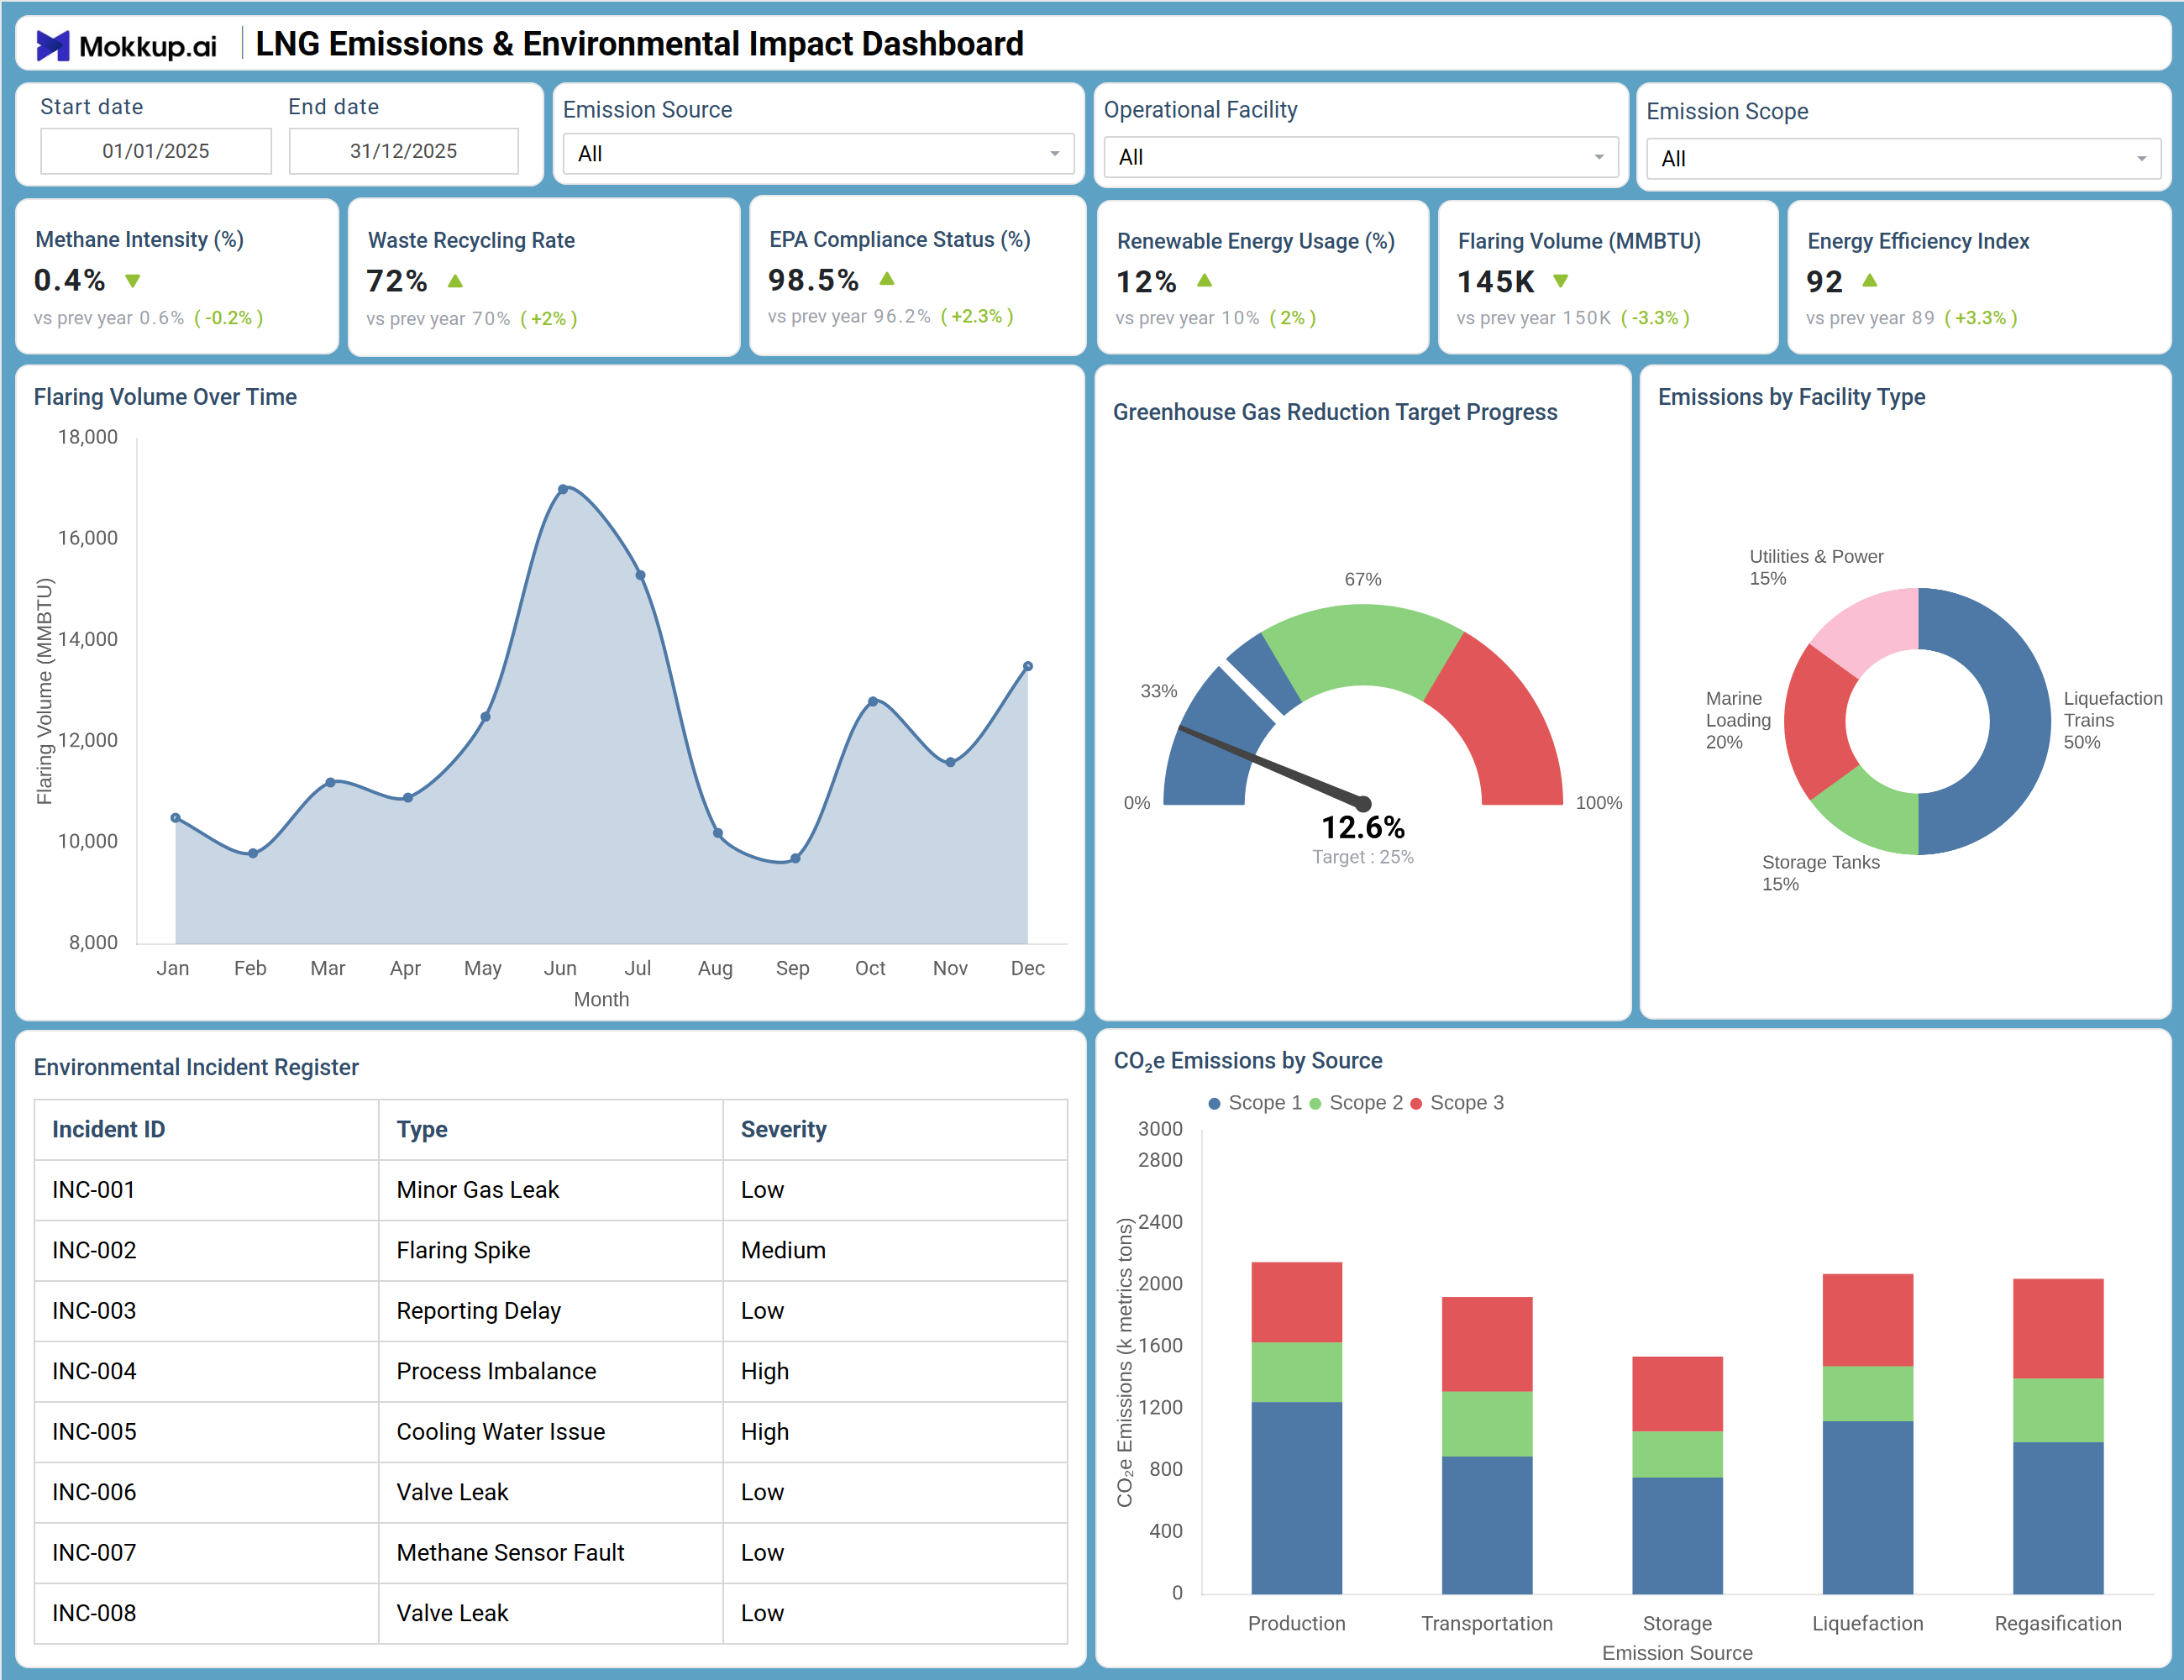
This dashboard delivers a comprehensive view of environmental performance across LNG operations. The Overview screen prominently displays six critical KPIs: Methane Intensity at 0.4% (improved from 0.6% year-over-year), Waste Recycling Rate at 72%, EPA Compliance Status at 98.5%, Renewable Energy Usage at 12%, Flaring Volume reduced to 145K MMBTU, and Energy Efficiency Index at 92.
The Flaring Volume Over Time chart tracks monthly flaring trends, enabling identification of operational patterns and reduction opportunities. The Greenhouse Gas Reduction Target Progress gauge shows current progress at 12.6% toward the 100% target, providing a quick visual on goal attainment. Emissions by Facility Type pie chart breaks down emissions contributions across Utilities & Power (15%), Marine Loading (20%), Storage Tanks (15%), and Liquefaction Trains (50%), helping prioritize reduction efforts.
How to Analyze Data in a LNG Emissions & Environmental Impact Dashboard
Here is how you can analyze data from this dashboard:
- Track Methane Emissions Intensity: Monitor Methane Intensity (%) to assess reduction progress and detect leak sources.
- Evaluate Flaring Trends: Track Flaring Volume (MMBTU) over time to identify inefficiencies and validate reduction efforts.
- Check Regulatory Compliance: Review EPA Compliance Status (%) to ensure adherence and address gaps early.
- Measure Renewable Energy Adoption: Analyze Renewable Energy Usage (%) to track clean energy integration progress.
- Assess Waste Management Efficiency: Examine Waste Recycling Rate (%) to identify circular economy improvements.
- Monitor Energy Efficiency: Evaluate Energy Efficiency Index to understand operational optimization impact.
- Track Sustainability Targets: Assess GHG Reduction Progress to measure alignment with net-zero goals.
- Identify High Emission Sources: Use Emissions by Facility Type to prioritize reduction strategies.
- Analyze Environmental Incidents: Review Incident Register to detect recurring risks and prevent future events.
- Break Down Emissions by Source: Drill into CO₂e Emissions by Scope (1, 2, 3) for full value chain visibility.
Benefits of a LNG Emissions & Environmental Impact Dashboard
The following are the benefits of using this dashboard:
- Centralized Environmental Visibility: Provides a unified view of emissions and environmental performance.
- Proactive Emissions Management: Enables early detection of methane, flaring, and CO₂e trends.
- Regulatory Compliance Support: Ensures adherence to EPA and global environmental standards.
- Sustainability Goal Tracking: Helps monitor progress toward net-zero and ESG targets.
- Improved ESG Transparency: Enhances reporting for investors, regulators, and stakeholders.
- Operational Efficiency Gains: Identifies inefficiencies contributing to excess emissions.
- Faster Incident Response: Enables quick action through centralized environmental incident tracking.
- Carbon Strategy Enablement: Supports carbon credits and emissions trading with accurate data.
- Stronger Corporate Responsibility: Demonstrates measurable environmental performance and accountability.
KPIs to Track in a LNG Emissions & Environmental Impact Dashboard
The following key KPIs can be tracked by using this dashboard:
- Methane Intensity (%): Methane emissions as a percentage of total natural gas throughput.
- Waste Recycling Rate (%): Percentage of operational waste diverted from landfill through recycling programs.
- EPA Compliance Status (%): Overall adherence to Environmental Protection Agency regulations and standards.
- Renewable Energy Usage (%): Percentage of total energy consumption derived from renewable sources.
- Flaring Volume (MMBTU): Total volume of natural gas flared during operational activities.
- Energy Efficiency Index: Composite measure of energy efficiency across facilities and processes.
- Greenhouse Gas Reduction Progress (%): Current progress toward established GHG reduction targets.
- CO₂e Emissions by Scope: Breakdown of Scope 1, 2, and 3 carbon dioxide equivalent emissions.
- Environmental Incidents: Count and severity distribution of environmental incidents requiring attention.
- Emissions by Facility Type: Contribution of different facility types to total emissions profile.
Frequently Asked Questions
Q1. What is methane intensity and why is it critical for LNG operations?
Methane intensity measures methane emissions as a percentage of total natural gas produced or handled. It is a critical metric because methane is a potent greenhouse gas with over 80 times the warming potential of CO₂ over a 20-year period. Reducing methane intensity is a top priority for LNG operators, regulators, and stakeholders focused on climate action.
Q2. What are Scope 1, 2, and 3 emissions in the LNG context?
Scope 1 emissions are direct emissions from owned sources such as combustion equipment and fugitive leaks. Scope 2 emissions are indirect emissions from purchased electricity, steam, heating, and cooling. Scope 3 emissions include all other indirect emissions across the value chain, including upstream production, transportation, and downstream combustion of LNG by end users.
Q3. How can this dashboard support ESG and sustainability reporting?
The dashboard consolidates all key environmental metrics required for ESG disclosures, including methane intensity, CO₂e emissions by scope, renewable energy usage, EPA compliance status, and incident tracking. This makes it easy to generate reports aligned with frameworks such as GRI, SASB, TCFD, and CDP.
Q4. What types of environmental incidents can be tracked?
The Environmental Incident Register can track a wide range of incidents including minor gas leaks, flaring spikes, reporting delays, process imbalances, cooling water issues, valve leaks, methane sensor faults, and any other events with actual or potential environmental impact.
Q5. Can this dashboard track emissions across the entire LNG value chain?
Yes. By including Scope 1, 2, and 3 emissions data broken down by operational phase (Production, Transportation, Storage, Liquefaction, Regasification), the dashboard provides comprehensive visibility into emissions from the wellhead through to end-use combustion.