
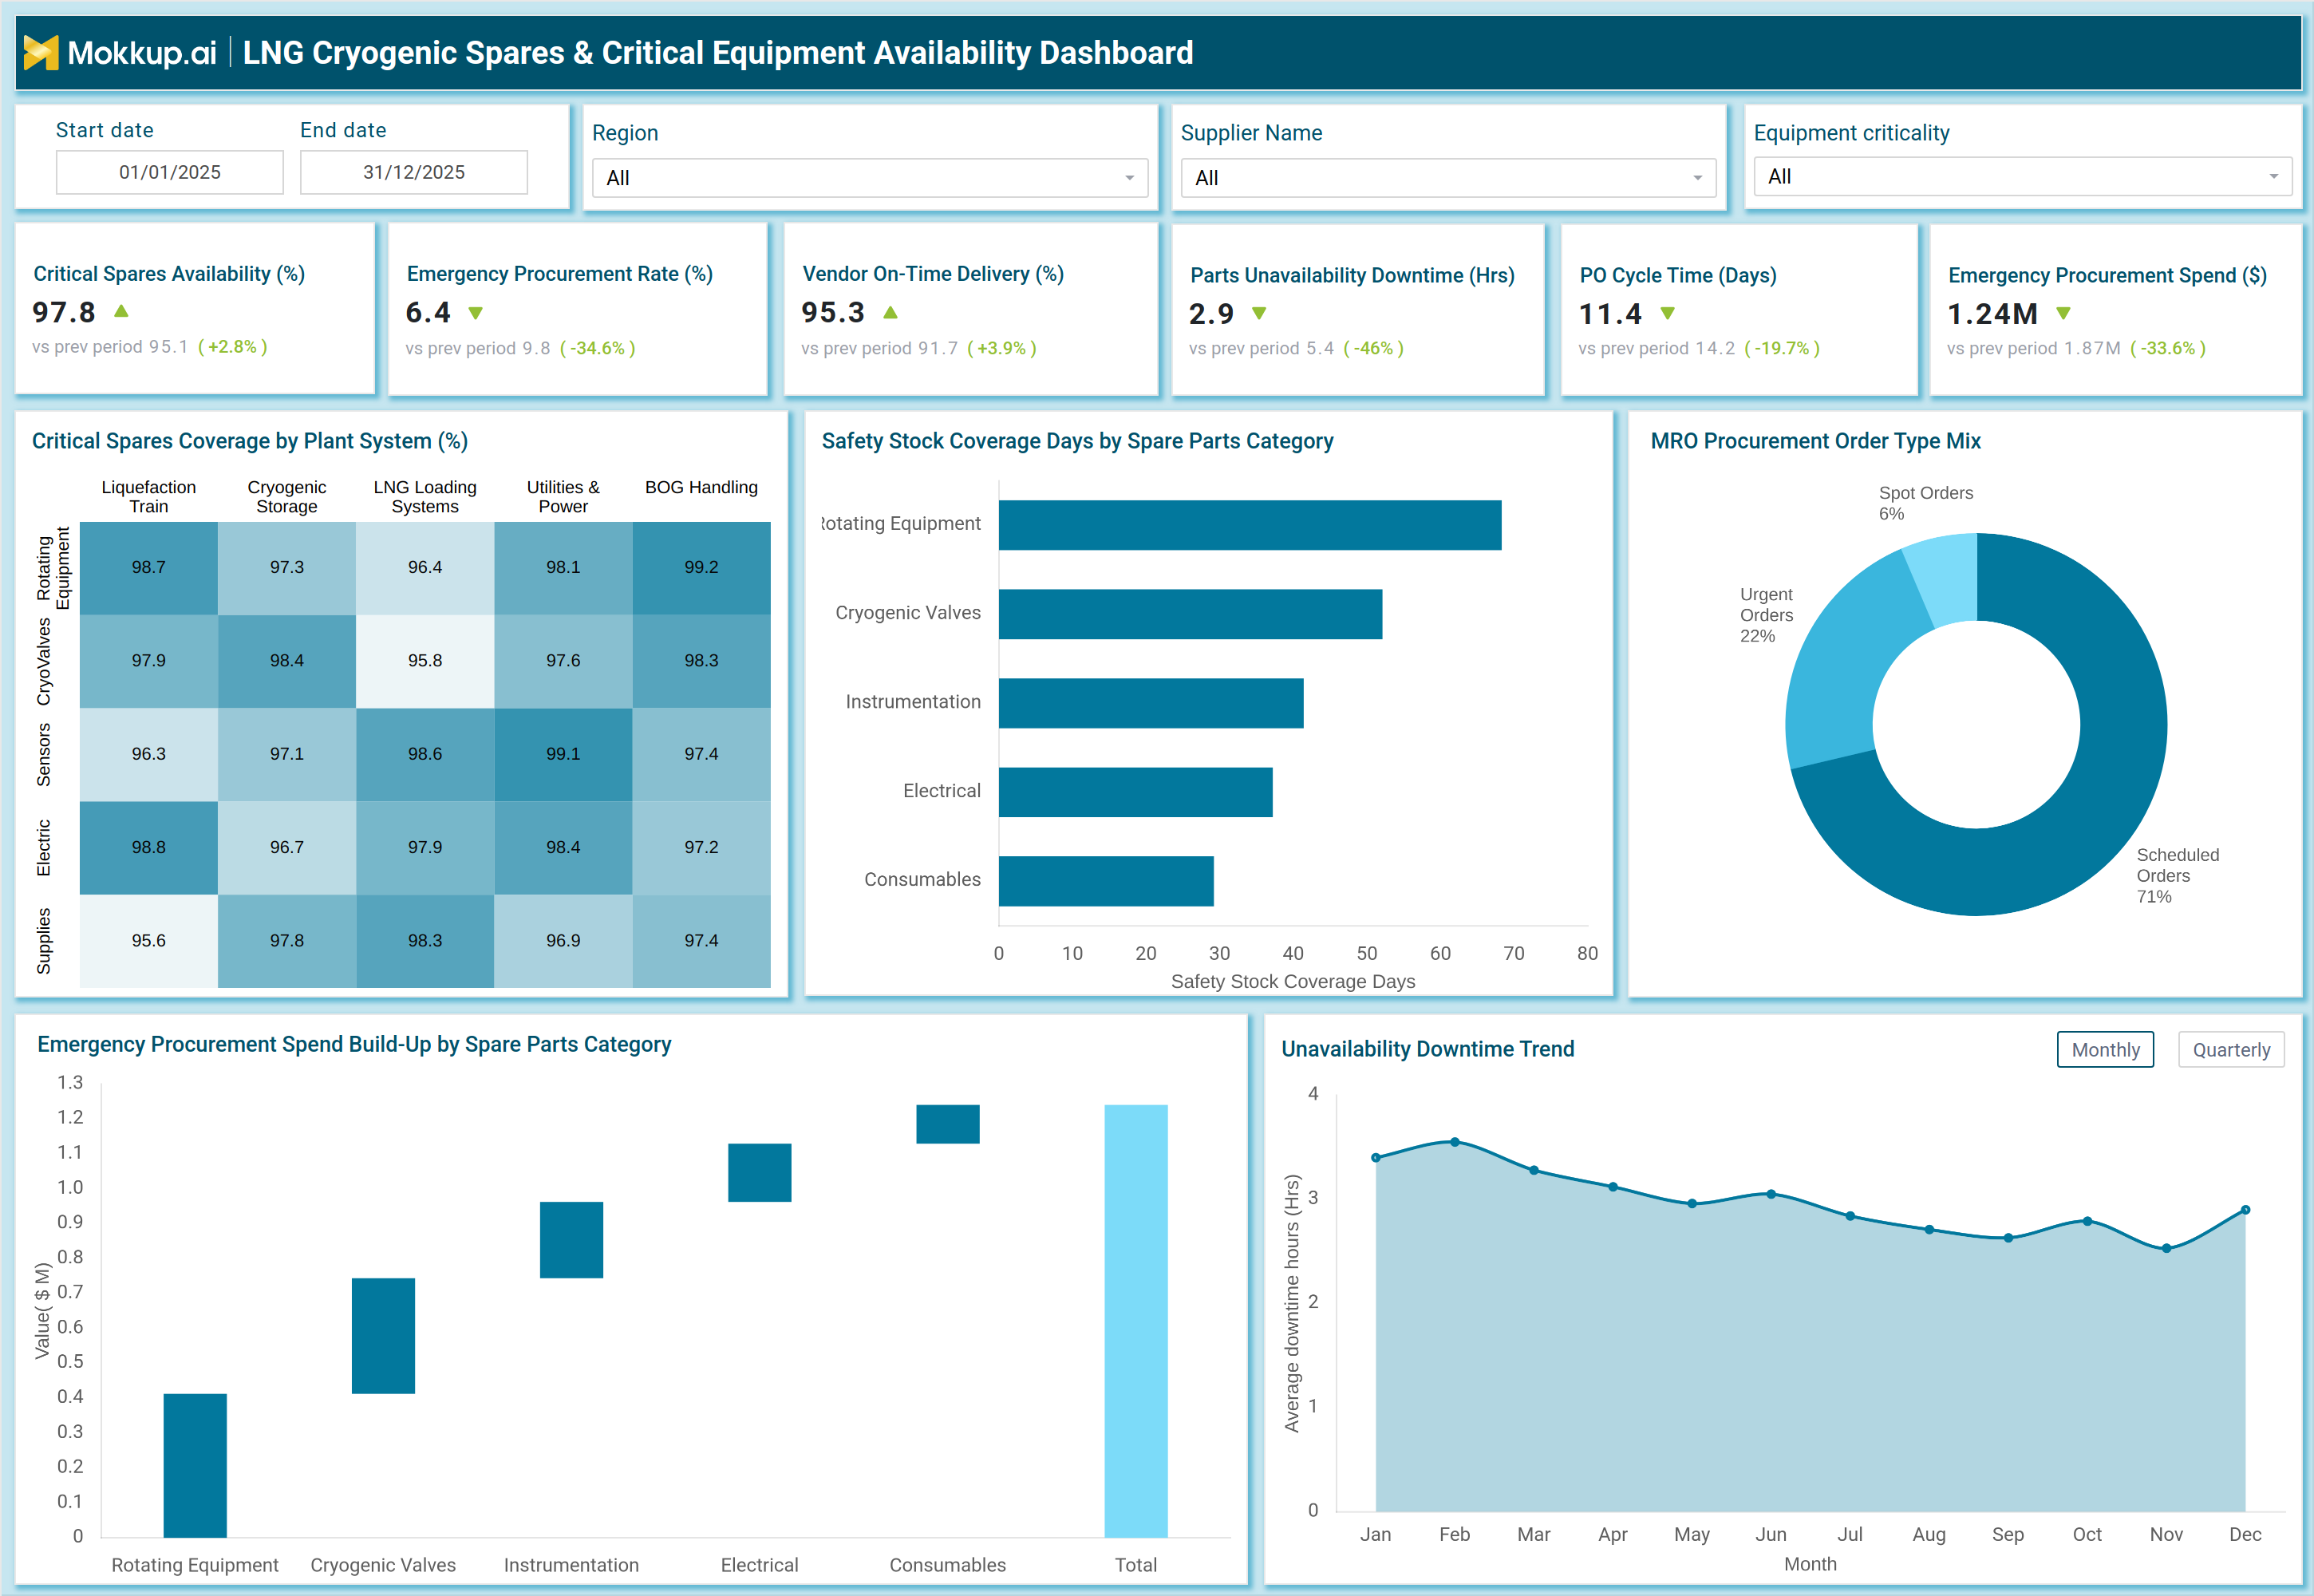
What is an LNG Cryogenic Spares & Critical Equipment Availability Dashboard?
An LNG cryogenic spares and equipment availability dashboard is an operational analytics tool used by natural gas utilities and LNG terminal operators to monitor spare parts readiness and equipment availability across cryogenic infrastructure. LNG terminals depend on specialized components such as cryogenic valves, pumps, rotating equipment, and instrumentation systems that operate under extremely low temperatures. Failure or delayed replacement of these components can cause operational disruption and safety risks. An LNG terminal cryogenic equipment availability monitoring dashboard consolidates spare parts inventory data, vendor delivery performance, procurement cycles, and equipment downtime metrics into a centralized operational view.
This helps maintenance teams evaluate spare parts coverage, supplier reliability, and procurement efficiency. The dashboard also works as an LNG critical equipment spare parts monitoring dashboard, enabling operators to track emergency procurement trends, downtime caused by parts unavailability, and safety stock coverage. As a liquefied natural gas equipment availability analytics dashboard, it converts spare parts management data into measurable KPIs that improve maintenance planning and operational reliability.
How to Create an LNG Cryogenic Spares & Critical Equipment Availability Dashboard
You don't need to build your report from scratch — just start with a ready-to-use LNG Cryogenic Spares & Critical Equipment Availability dashboard template from Mokkup. Add in your data and export it however you like. Here's how to do it:
1. Create or Log in to Your Mokkup Account
Start by signing up on Mokkup.ai using your email. If you already have an account, just log in, and you'll be good to go.
2. Choose and Customize Your Dashboard Template
Find the LNG Cryogenic Spares & Critical Equipment Availability Dashboard template in the Templates section. Use the drag-and-drop editor to adjust KPIs, edit filters, or add elements based on your data.
3. Export to Your BI Tool
Once your dashboard wireframe is ready, use the BI Tool Export feature to send it directly to Power BI or Tableau for further analysis and enhancements. You can also download the dashboard as a PDF, PNG, or JPEG, embed it on a platform, or invite your team to collaborate. Note: This is a Pro template. You'll need a Pro subscription on Mokkup to use and customize this dashboard wireframe. Upgrade anytime to unlock full access.
Note: This is a Pro template. You’ll need a Pro subscription on Mokkup to use and customize this dashboard wireframe. Upgrade anytime to unlock full access.
LNG Cryogenic Spares & Critical Equipment Availability Dashboard Example
An LNG terminal operates multiple plant systems, including liquefaction trains, cryogenic storage tanks, LNG loading facilities, utilities, and boil-off gas handling systems. Each system depends on a network of critical components that must be supported by sufficient spare parts inventory. Without proper monitoring, spare part shortages can delay repairs and increase downtime. An LNG terminal spare parts inventory monitoring system provides a centralized view of spare parts availability across plant systems. Maintenance teams can monitor critical spares availability, emergency procurement rates, vendor on-time delivery, and procurement cycle times. These metrics help determine whether spare inventory is sufficient to support ongoing operations.
The dashboard also highlights spare coverage across equipment categories such as rotating equipment, cryogenic valves, instrumentation, electrical components, and consumables. Safety stock coverage analysis helps maintenance planners understand how many days of spare parts are available for each category. Procurement analytics further reveal how spare parts are sourced through scheduled, urgent, or spot orders.
How to Analyze Data in LNG Cryogenic Spares & Critical Equipment Availability Dashboard
Here is how you can analyze data from this dashboard:
- Spares Availability Monitoring: Review critical spares availability to ensure sufficient inventory for LNG equipment maintenance.
- Emergency Procurement Analysis: Analyze emergency procurement rates to identify reliance on urgent spare purchases.
- Supplier Performance Evaluation: Monitor vendor on-time delivery to assess reliability of critical component suppliers.
- Downtime Impact Assessment: Track parts unavailability downtime to understand operational impact of spare shortages.
- Procurement Efficiency Tracking: Review procurement cycle time to measure efficiency of spare parts purchasing processes.
- Cost Pressure Analysis: Analyze emergency procurement spend to evaluate financial impact of urgent sourcing.
- System-Level Coverage Insights: Study critical spares coverage across liquefaction trains, cryogenic storage, and LNG loading systems.
- Inventory Buffer Evaluation: Evaluate safety stock coverage days to determine how long inventory can sustain operations.
- Procurement Pattern Analysis: Review procurement order type mix to understand scheduled vs urgent sourcing trends.
- Risk Trend Monitoring: Monitor downtime trends to detect recurring equipment availability risks.
Benefits of LNG Cryogenic Spares & Critical Equipment Availability Dashboard
The following are the benefits of using this dashboard:
- Centralized Inventory Visibility: Provides a unified view of spare parts availability across LNG infrastructure.
- Maintenance Readiness: Improves preparedness for critical cryogenic equipment maintenance.
- Downtime Reduction: Reduces operational disruptions caused by spare shortages.
- Supplier Reliability Improvement: Enhances monitoring of vendor performance and delivery timelines.
- Inventory Optimization: Supports effective planning of safety stock coverage.
- Procurement Efficiency: Improves purchasing processes through cycle time tracking.
- Cost Control: Helps manage and reduce emergency procurement expenses.
- Cross-Team Coordination: Enables better alignment between maintenance and procurement teams.
- Equipment Reliability: Improves performance of LNG terminal systems through better spare management.
- Operational Continuity: Strengthens uninterrupted LNG production and loading operations.
KPIs to Track in LNG Cryogenic Spares & Critical Equipment Availability Dashboard
The following key KPIs can be tracked by using this dashboard:
- Critical Spares Availability (%): Percentage of required spare parts available for maintenance.
- Emergency Procurement Rate (%): Share of spares sourced through urgent procurement.
- Vendor On-Time Delivery (%): Percentage of suppliers delivering on schedule.
- Parts Unavailability Downtime (Hrs): Downtime caused by unavailable spare parts.
- PO Cycle Time (Days): Average procurement time from order to delivery.
- Emergency Procurement Spend ($): Total cost of urgent spare purchases.
- Spares Coverage by Plant System (%): Availability across liquefaction, storage, and LNG loading systems.
- Safety Stock Coverage (Days): Number of days inventory can support operations.
- Procurement Order Mix: Distribution of scheduled vs urgent procurement orders.
- Emergency Spend by Category: Breakdown of urgent procurement costs by spare type.
- Downtime Trend: Trend of downtime linked to spare shortages.
Frequently Asked Questions
Q1. What is an LNG cryogenic spares availability dashboard?
It is a monitoring platform that tracks spare parts availability, procurement efficiency, and equipment downtime across LNG cryogenic infrastructure.
Q2. Who uses an LNG terminal cryogenic equipment availability monitoring dashboard?
Maintenance managers, reliability engineers, procurement teams, and LNG terminal operations teams use this dashboard.
Q3. Why is spare parts availability critical in LNG terminals?
Cryogenic equipment operates in extreme conditions, and spare shortages can cause operational disruptions and maintenance delays.
Q4. What KPIs does this dashboard track?
Key KPIs include Critical Spares Availability (%), Emergency Procurement Rate (%), Vendor On-Time Delivery (%), Parts Unavailability Downtime (Hrs), PO Cycle Time (Days), and Safety Stock Coverage (Days).
Q5. How does the dashboard help reduce emergency procurement costs?
By tracking emergency procurement rate and spend, the dashboard highlights over-reliance on urgent sourcing, enabling maintenance teams to improve planned procurement and reduce costly last-minute purchases.