
- End-to-End Project Visibility: Improves visibility into complex bioenergy infrastructure project execution.
- Proactive Schedule Control: Enables early identification and control of schedule delays and milestone risks.
- Improved Team Coordination: Strengthens coordination between utilities, contractors, and engineering teams.
- Data-Driven Planning: Supports data-driven planning for bioenergy utilities project monitoring.
- Reduced Execution Risk: Reduces uncertainty during plant upgrades and retrofit activities.
- Enhanced Accountability: Enhances accountability across project owners, EPCs, and vendors.
- Accurate Commissioning Forecasts: Improves forecasting accuracy for commissioning and handover phases.
- Strategic Alignment: Aligns bioenergy plant project tracking with regulatory and operational goals.
What is a Bioenergy Power Plant Project Management Dashboard?
A Bioenergy Power Plant Project Management Dashboard template is a centralized digital tool used to plan, track, and control utility-scale bioenergy infrastructure projects. It consolidates schedule progress, milestone status, contractor productivity, resource risks, and execution performance into a single visual interface.
This dashboard wireframe supports bioenergy power plant project management by enabling project teams to monitor upgrades such as boiler retrofits, fuel handling systems, emission control installations, and digital infrastructure modernization. By providing visibility into timelines, delays, and dependencies, it strengthens bioenergy plant project tracking and ensures utility projects remain aligned with cost, schedule, and regulatory objectives.
How to Create a Bioenergy Project Management Dashboard
You don’t need to build your report from scratch, just start with a ready-to-use Bioenergy Project Management dashboard template from Mokkup. Add in your data and export it however you like. Here’s how to do it:
1. Create or Log in to Your Mokkup Account
Start by signing up on Mokkup.ai using your email. If you already have an account, just log in, and you’ll be good to go.
2. Choose and Customize Your Dashboard Template
Find the Bioenergy Project Management Dashboard template in the Templates section. Use the drag-and-drop editor to adjust KPIs, edit filters, or add elements based on your data.
3. Export to Your BI Tool
Once your dashboard wireframe is ready, use the BI Tool Export feature to send it directly to Power BI or Tableau for further analysis and enhancements. You can also download the dashboard as a PDF, PNG, or JPEG, embed it on a platform, or invite your team to collaborate.
Note: This is a Pro template. You’ll need a Pro subscription on Mokkup to use and customize this dashboard wireframe. Upgrade anytime to unlock full access.
Bioenergy Power Plant Project Management Dashboard Example
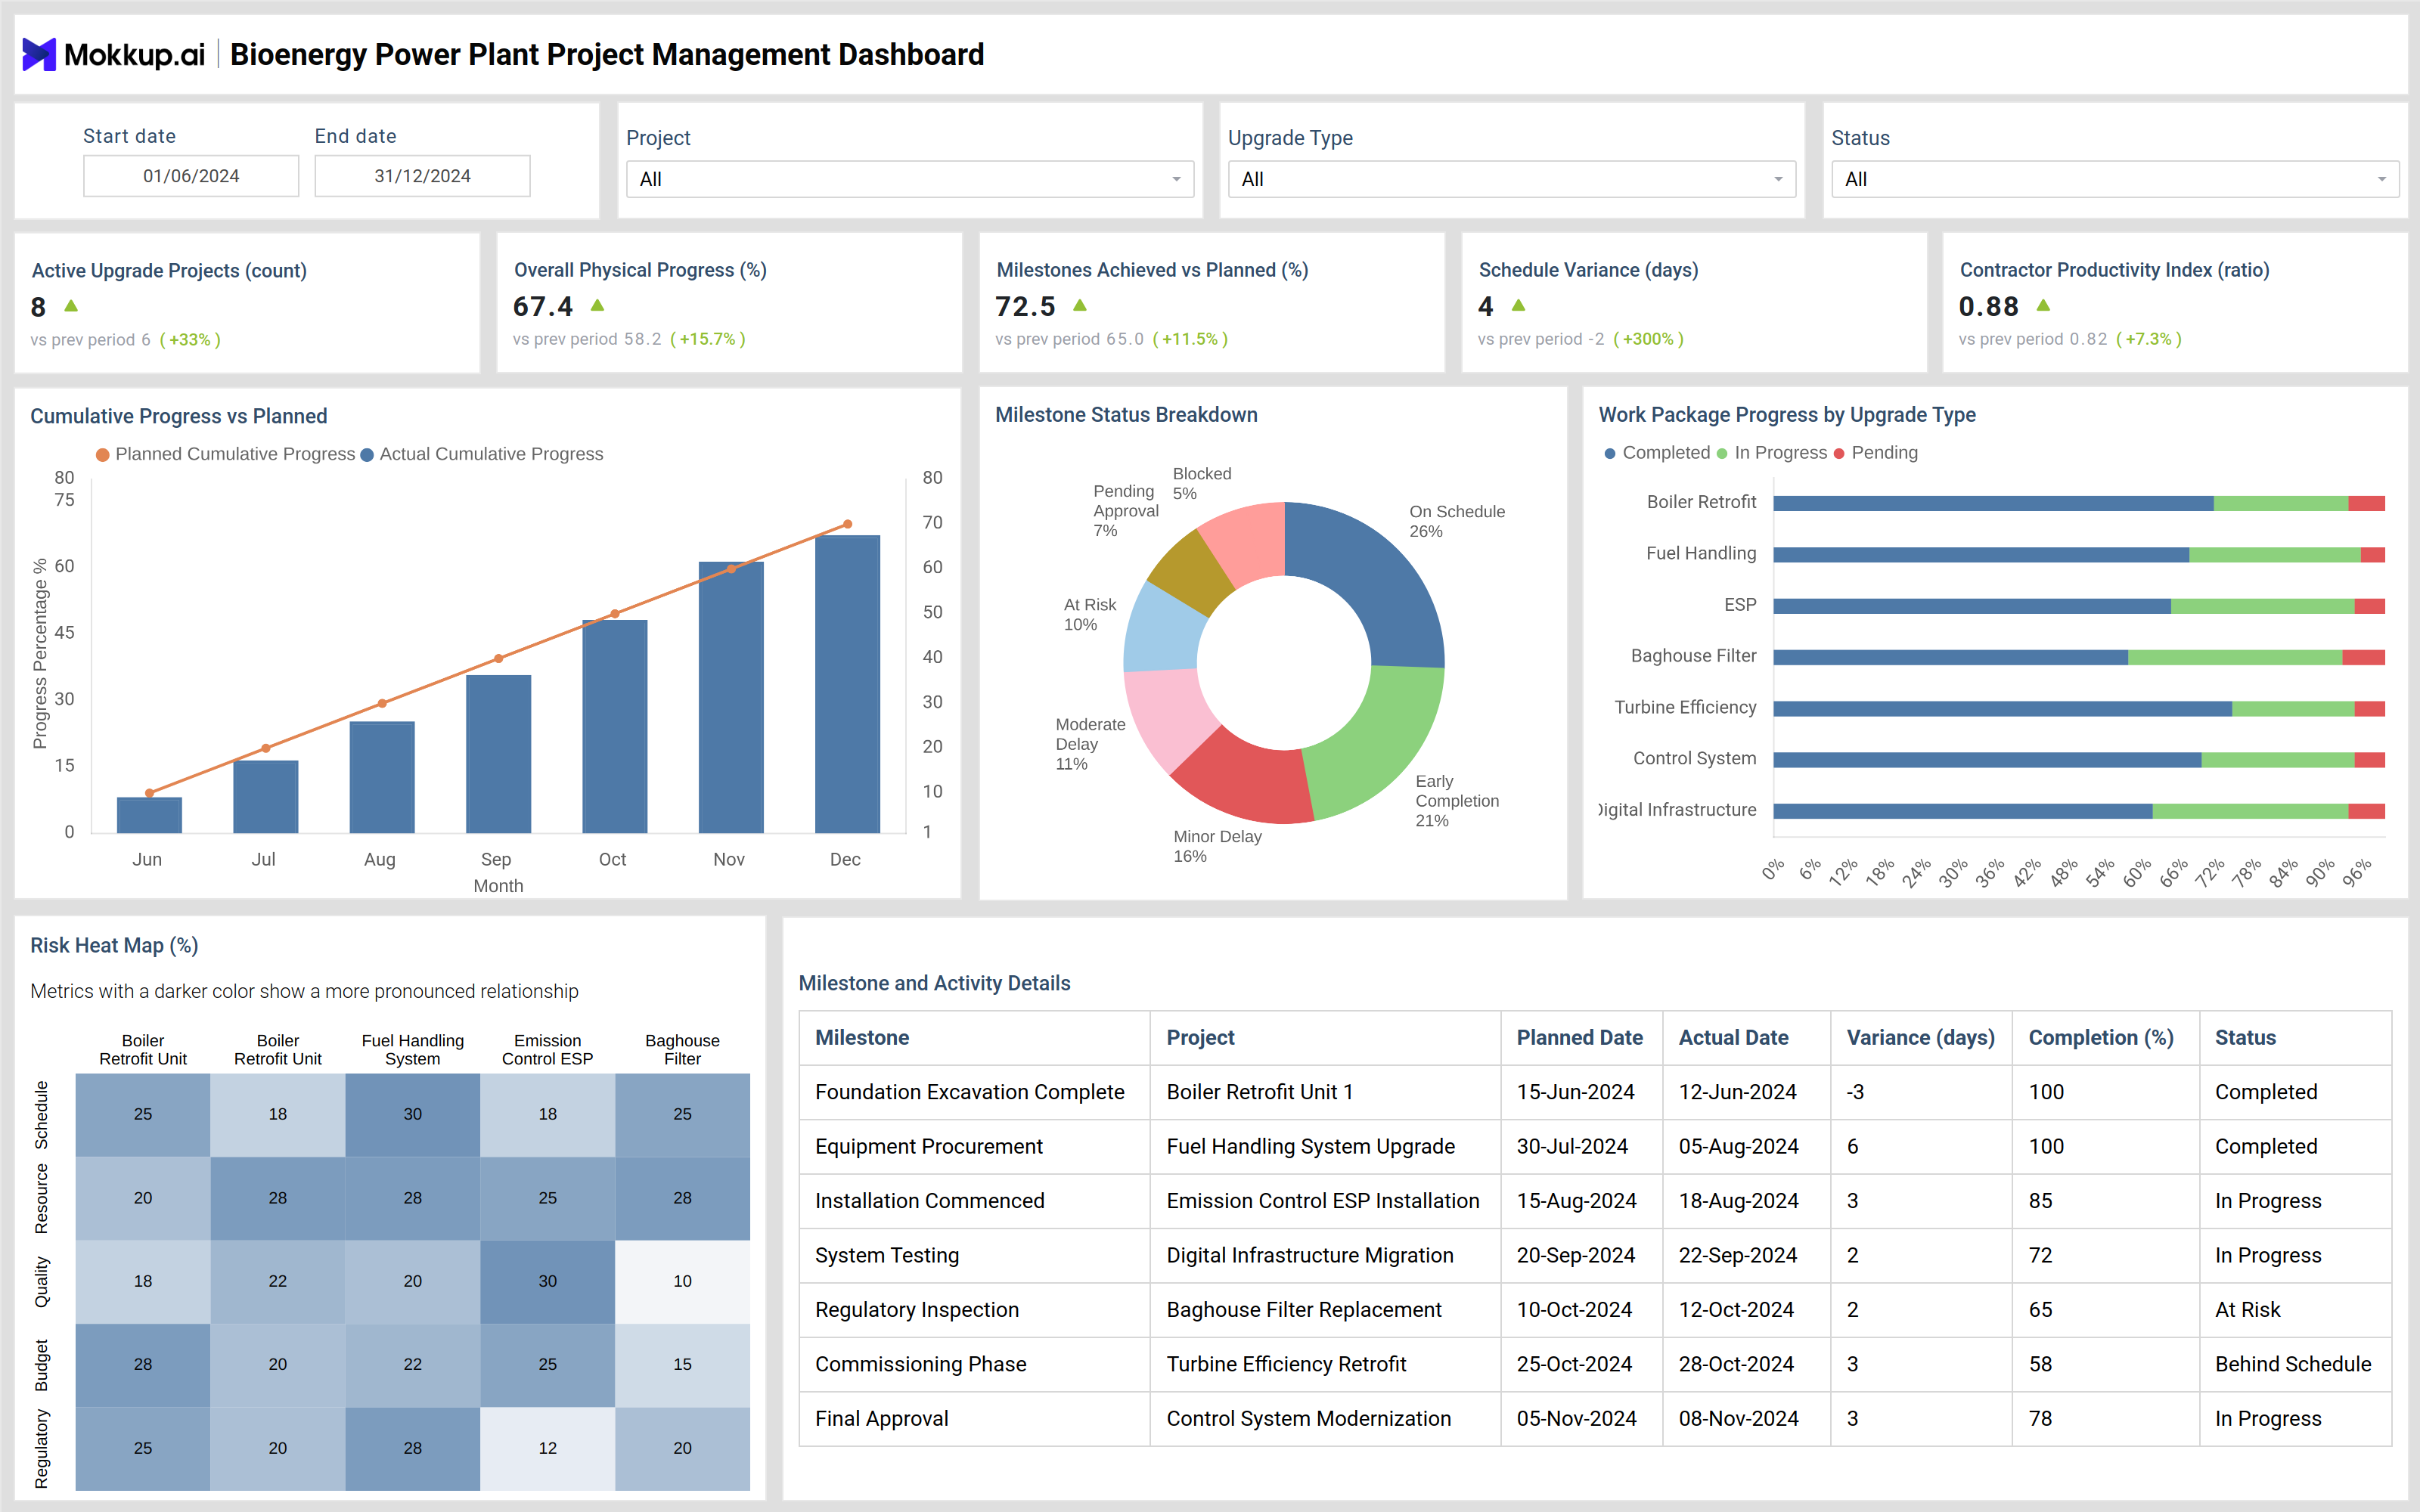
You can build your own Bioenergy Power Plant Project Management Dashboard to manage ongoing utility upgrade and modernization initiatives across a bioenergy facility. A typical dashboard presents active upgrade project counts, overall physical progress, milestone achievement rates, schedule variance, and contractor productivity indices at the top level. These indicators help teams assess whether projects are progressing as planned or require intervention.Visual components such as cumulative planned versus actual progress charts highlight execution gaps over time.
Milestone status breakdowns categorize activities as on schedule, delayed, at risk, or pending approval, allowing rapid prioritization. Work package progress views track completion across upgrade types including boiler retrofits, ESP installations, turbine efficiency improvements, and control system upgrades. A project risk heat map evaluates schedule, cost, quality, resource, and regulatory risks by project area. Detailed milestone tables provide planned dates, actual completion, variance days, and current status, supporting bioenergy plant execution analytics and structured decision-making.
How to Analyze Bioenergy Power Plant Project Management Dashboard
Here is how you can analyze data from this dashboard:
- Project Load Overview: Review active project count to understand overall execution load across bioenergy utility projects.
- Progress vs Plan Tracking: Compare overall physical progress against planned milestones to detect early schedule slippage.
- Schedule Variance Monitoring: Track schedule variance in days to identify delays affecting commissioning timelines.
- Contractor Productivity Assessment: Monitor contractor productivity index to assess workforce efficiency and execution quality.
- Trend Validation: Analyze cumulative planned versus actual progress trends to validate delivery forecasts.
- Milestone Risk Focus: Examine milestone status distribution to focus on at-risk or blocked activities.
- Resource Allocation Analysis: Use work package progress by upgrade type to balance manpower and resources.
- Risk Exposure Review: Interpret the risk heat map to address schedule, budget, or regulatory exposure.
- Dependency Validation: Validate milestone-level details to ensure approvals and dependencies are aligned.
Benefits of Bioenergy Power Plant Project Management Dashboard
The following are the benefits of using this dashboard:
KPIs to Track in Bioenergy Power Plant Project Management Dashboard
The following key KPIs can be tracked by using this dashboard:
- Active Upgrade Projects: Number of ongoing bioenergy plant infrastructure initiatives
- Overall Physical Progress (%): Percentage of completed work against total scope
- Milestones Achieved vs Planned (%): Measure of schedule adherence
- Schedule Variance (days): Difference between planned and actual completion dates
- Contractor Productivity Index: Ratio of actual output to planned productivity
- Work Package Completion (%): Progress across key upgrade categories
- At-Risk Milestones: Count of milestones requiring corrective action
- Project Risk Score: Composite indicator of schedule, cost, and compliance risk
Frequently Asked Questions
Q1. What is the purpose of a bioenergy project management dashboard?
It provides centralized visibility into planning, execution, and risk management for bioenergy power plant projects.
Q2. How does this dashboard support bioenergy utilities project monitoring?
It tracks schedules, milestones, contractor performance, and risks across utility upgrade initiatives.
Q3. Can this dashboard be used for retrofit and modernization projects?
Yes, it is well-suited for boiler retrofits, emission control upgrades, turbine efficiency projects, and digital infrastructure improvements
Q4. How does it improve bioenergy plant execution analytics?
By comparing planned versus actual performance, identifying delays, and highlighting risk areas in real time.
Q5. Who should use a bioenergy infrastructure project dashboard?
Project managers, utility operators, engineering teams, EPC contractors, and plant leadership responsible for execution oversight.