
What is an IVF Center Fertility Quality & Safety Dashboard?
An IVF Center Fertility Quality & Safety Dashboard is a centralized tool designed for fertility clinic leadership—including medical directors, lab managers, and clinical leads—to monitor key performance indicators related to treatment success, patient safety, and operational quality. It provides clear visibility into metrics such as clinical pregnancy rates, live birth rates, cycle cancellation rates, complication rates, and patient satisfaction scores. Unlike scattered reports, this dashboard acts as a focused IVF center fertility dashboard, helping clinics track clinical outcomes, safety incidents, and patient experience in one streamlined view.
How to Create an IVF Center Fertility Quality & Safety Dashboard
You don’t need to build your dashboard from scratch—just start with a ready-to-use IVF center fertility dashboard template from Mokkup. Add your data and export it in your preferred format. Here’s how:
1. Create or Log in to Your Mokkup Account
Sign up on Mokkup.ai using your email. Existing users can log in directly.
2. Choose and Customize Your Dashboard Template
Locate the IVF Center Fertility Quality & Safety Dashboard template in the Templates section. Use the drag-and-drop editor to adjust KPIs, modify filters, or add new elements based on your clinic’s data.
3. Export to Your BI Tool
Once your dashboard wireframe is ready, use the BI Tool Export feature to send it to Power BI or Tableau for further refinement. You can also download it as a PDF, PNG, or JPEG, embed it on a platform, or invite team members to collaborate.
Note: This is a Pro template. A Pro subscription on Mokkup is required to use and customize this dashboard wireframe. Upgrade anytime to unlock full access.
IVF Center Fertility Quality & Safety Dashboard Example
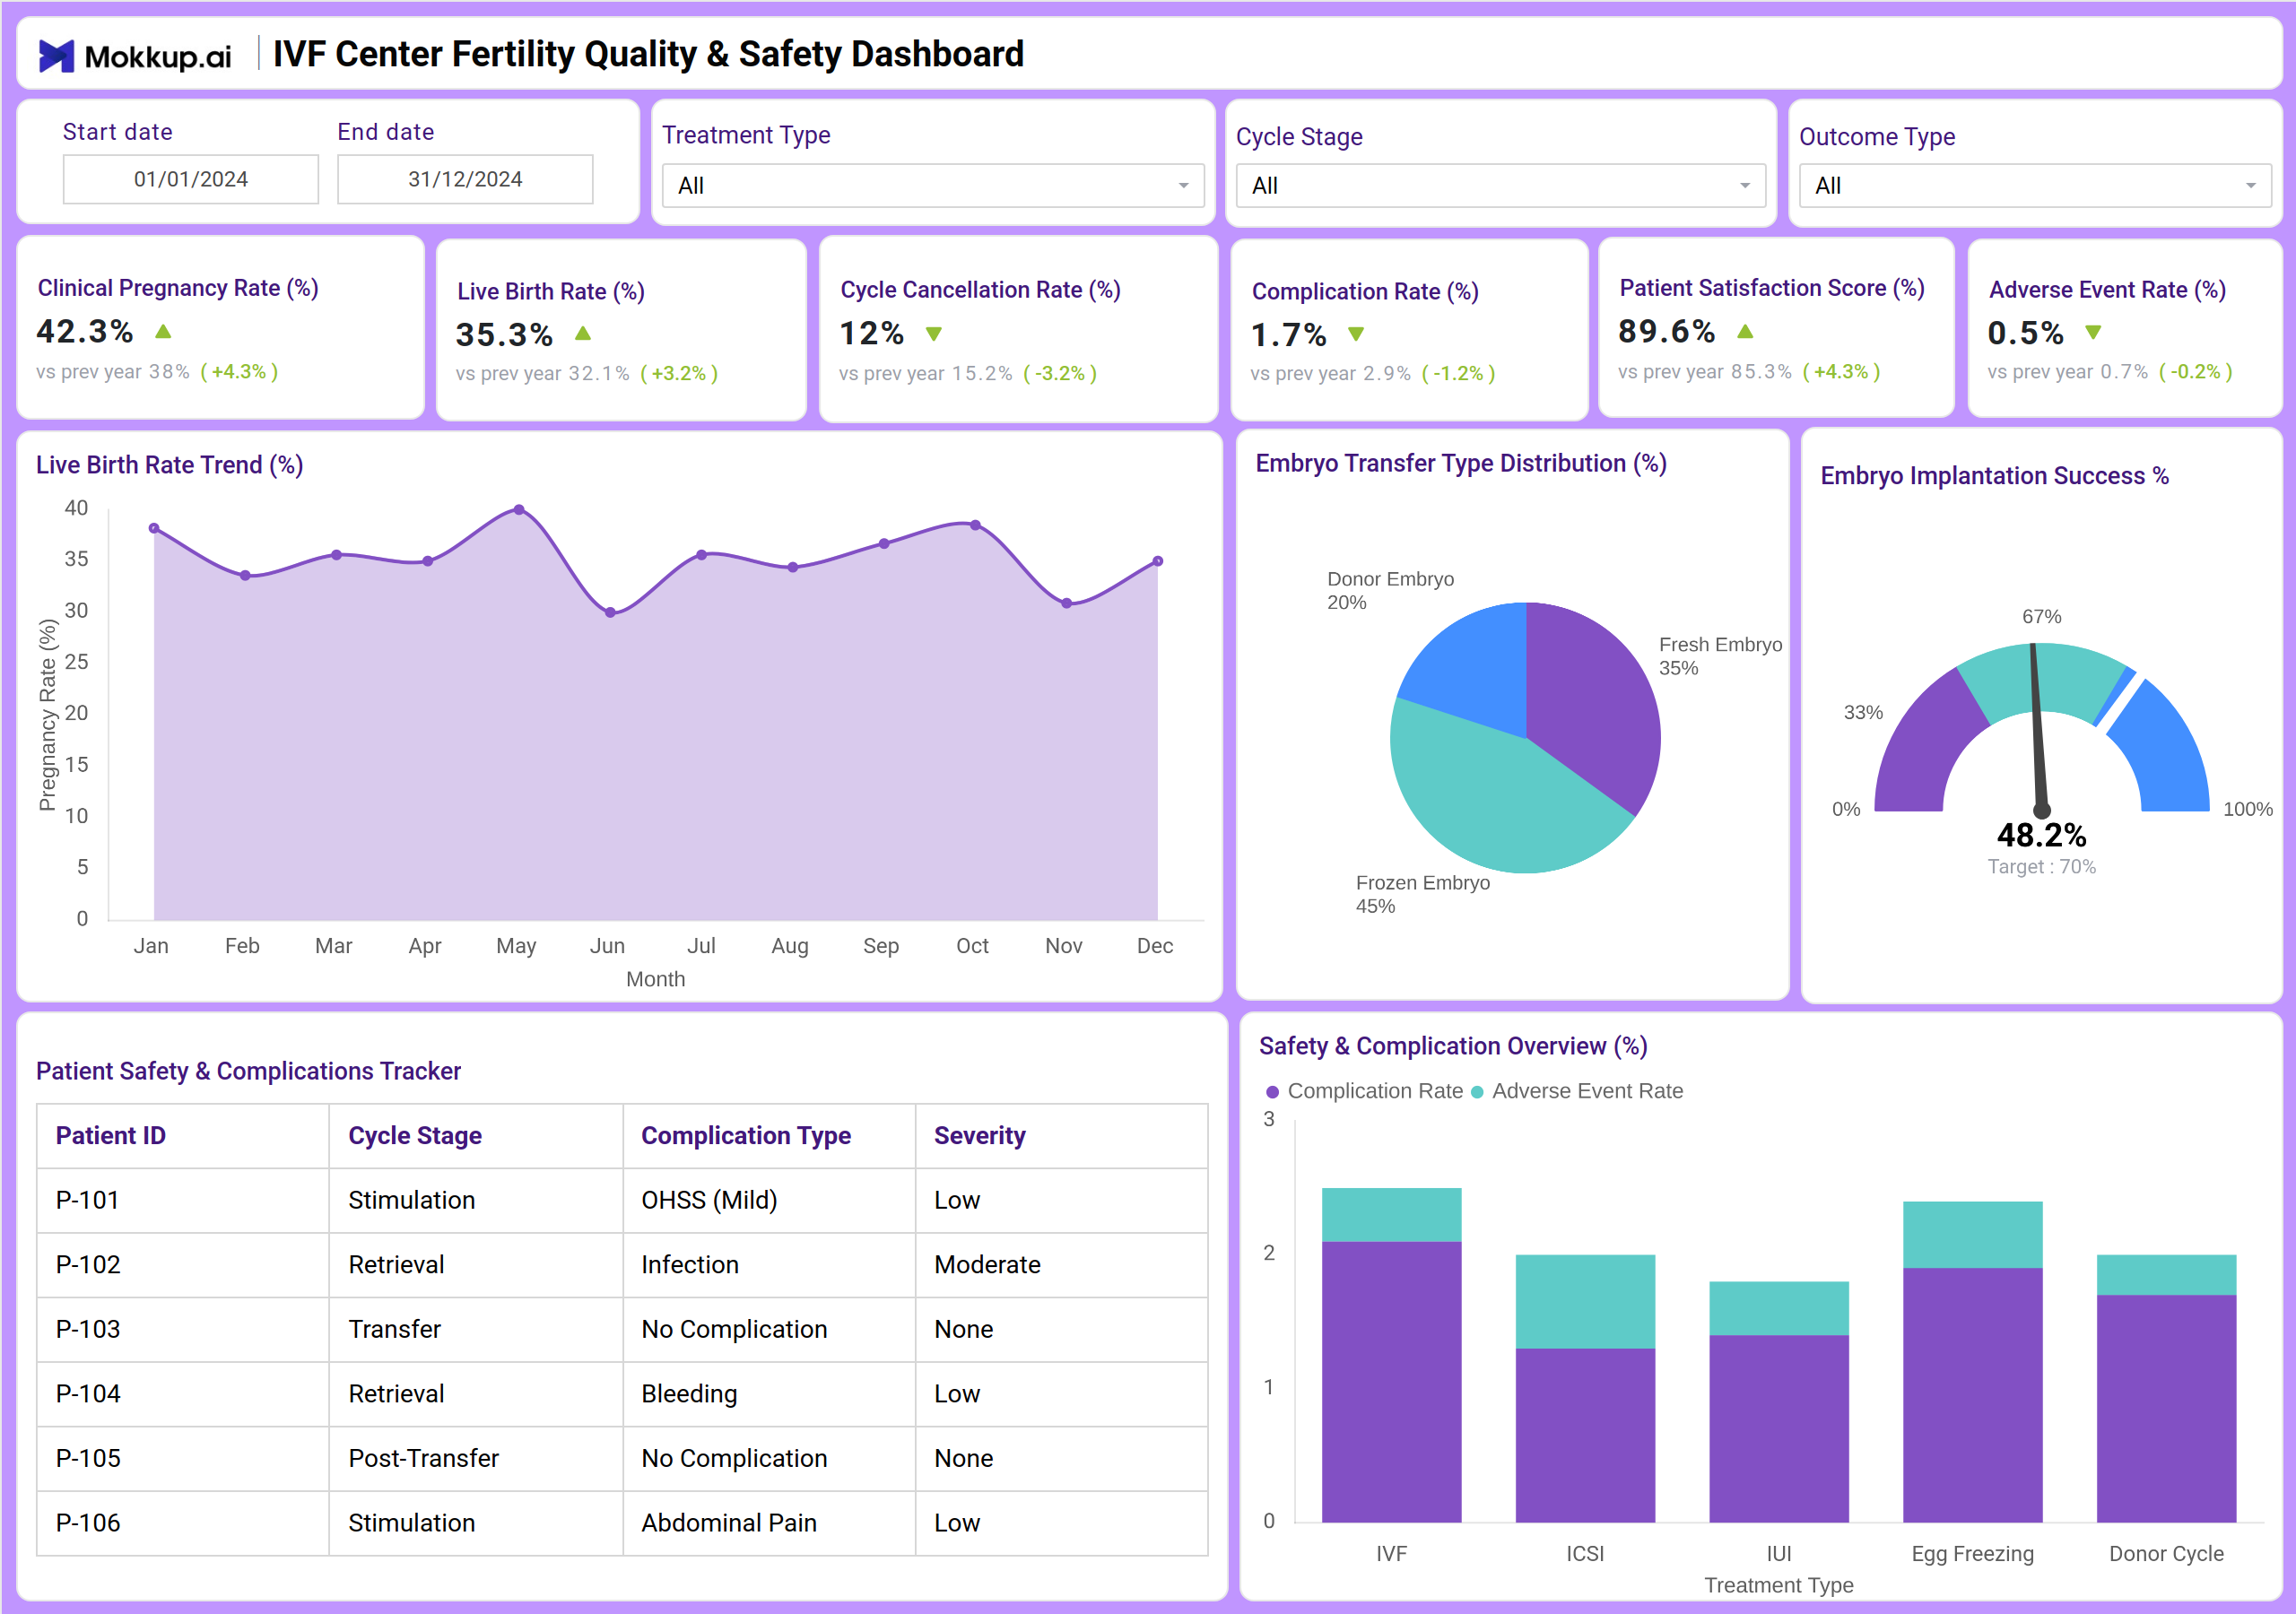
You can create an IVF Center Fertility Quality & Safety Dashboard using a combination of KPI tiles and visualizations. At the top, KPI cards display essential metrics such as Clinical Pregnancy Rate, Live Birth Rate, Cycle Cancellation Rate, Complication Rate, and Patient Satisfaction Score. Below, charts illustrate trends in Live Birth Rates over time, Embryo Transfer Type Distribution, and a detailed Patient Safety & Complications Tracker. This layout helps clinics monitor both outcome quality and patient safety, making it an effective fertility operations quality and safety dashboard for clinical and administrative review.
How to Analyze Data in IVF Center Fertility Quality & Safety Dashboards
Here’s how fertility clinics can leverage the data presented in the IVF Center Fertility Quality & Safety Dashboard:
- Monitor success rates: Track Clinical Pregnancy Rate and Live Birth Rate trends to evaluate treatment effectiveness.
- Review cycle management: Analyze Cycle Cancellation Rates to identify areas for process improvement.
- Ensure patient safety: Use the Complication Rate and Adverse Event Rate to monitor and enhance safety protocols.
- Gauge patient experience: Review Patient Satisfaction Scores to understand care quality from the patient’s perspective.
- Evaluate embryo transfer outcomes: Compare implantation success rates across Fresh, Frozen, and Donor Embryo transfers.
- Track safety incidents: Use the Patient Safety & Complications Tracker to review individual cases and severity levels.
Benefits of IVF Center Fertility Quality & Safety Dashboards
- Improved clinical oversight: Clear view of pregnancy, birth, and cancellation rates for better decision-making.
- Enhanced patient safety: Monitoring of complication and adverse event rates supports proactive risk management.
- Treatment process optimization: Insights into embryo transfer types and success rates help refine clinical protocols.
- Patient-centered care: Tracking satisfaction scores ensures the patient voice influences service improvements.
- Safety benchmarking: Compare current and previous year rates to measure progress in clinical quality.
- Compliance readiness: Works as a fertility intervention and compliance dashboard for audits and accreditation.
Together, these elements provide clinic leaders with a holistic view of both clinical outcomes and patient safety, making it easier to align treatment practices with quality standards. That’s why many refer to it as the best fertility clinic performance dashboard for enhancing success rates and patient trust.
KPIs to Track in IVF Center Fertility Quality & Safety Dashboards
- Clinical Pregnancy Rate (%): Measures the proportion of cycles resulting in a clinical pregnancy.
- Live Birth Rate (%): Tracks the percentage of cycles that lead to a live birth.
- Cycle Cancellation Rate (%): Indicates the proportion of cycles canceled before retrieval or transfer.
- Complication Rate (%): Monitors the rate of complications during treatment cycles.
- Adverse Event Rate (%): Tracks rare but serious safety incidents.
- Patient Satisfaction Score (%): Reflects patient feedback on care experience.
- Embryo Transfer Type Distribution (%): Shows the split between Fresh, Frozen, and Donor Embryo transfers.
- Implantation Success Rate (%): Measures the success of embryo implantation per transfer type.
Frequently Asked Questions
1. Who should use the IVF Center Fertility Quality & Safety Dashboard?
Medical directors, lead embryologists, clinical managers, and quality assurance teams are involved in fertility treatment oversight and reporting.
2. Can this dashboard help improve success rates?
Yes. By tracking pregnancy and live birth rates alongside cycle cancellation and complication data, clinics can identify trends and adjust protocols to improve outcomes.
3. How does it support patient safety?
It provides a clear overview of complication and adverse event rates, along with a detailed tracker for individual incidents, supporting timely intervention and policy updates.