What is a Fertility Intervention Review Dashboard?
The Fertility Intervention dashboard template provides insights into treatment success rates, costs, and outcomes across various procedures. It encourages reproductive health analytics with visualizations on treatment types, age group success, failure causes, and time to pregnancy, helping guide decision-making for improving fertility treatments.
Fertility Dashboard Example
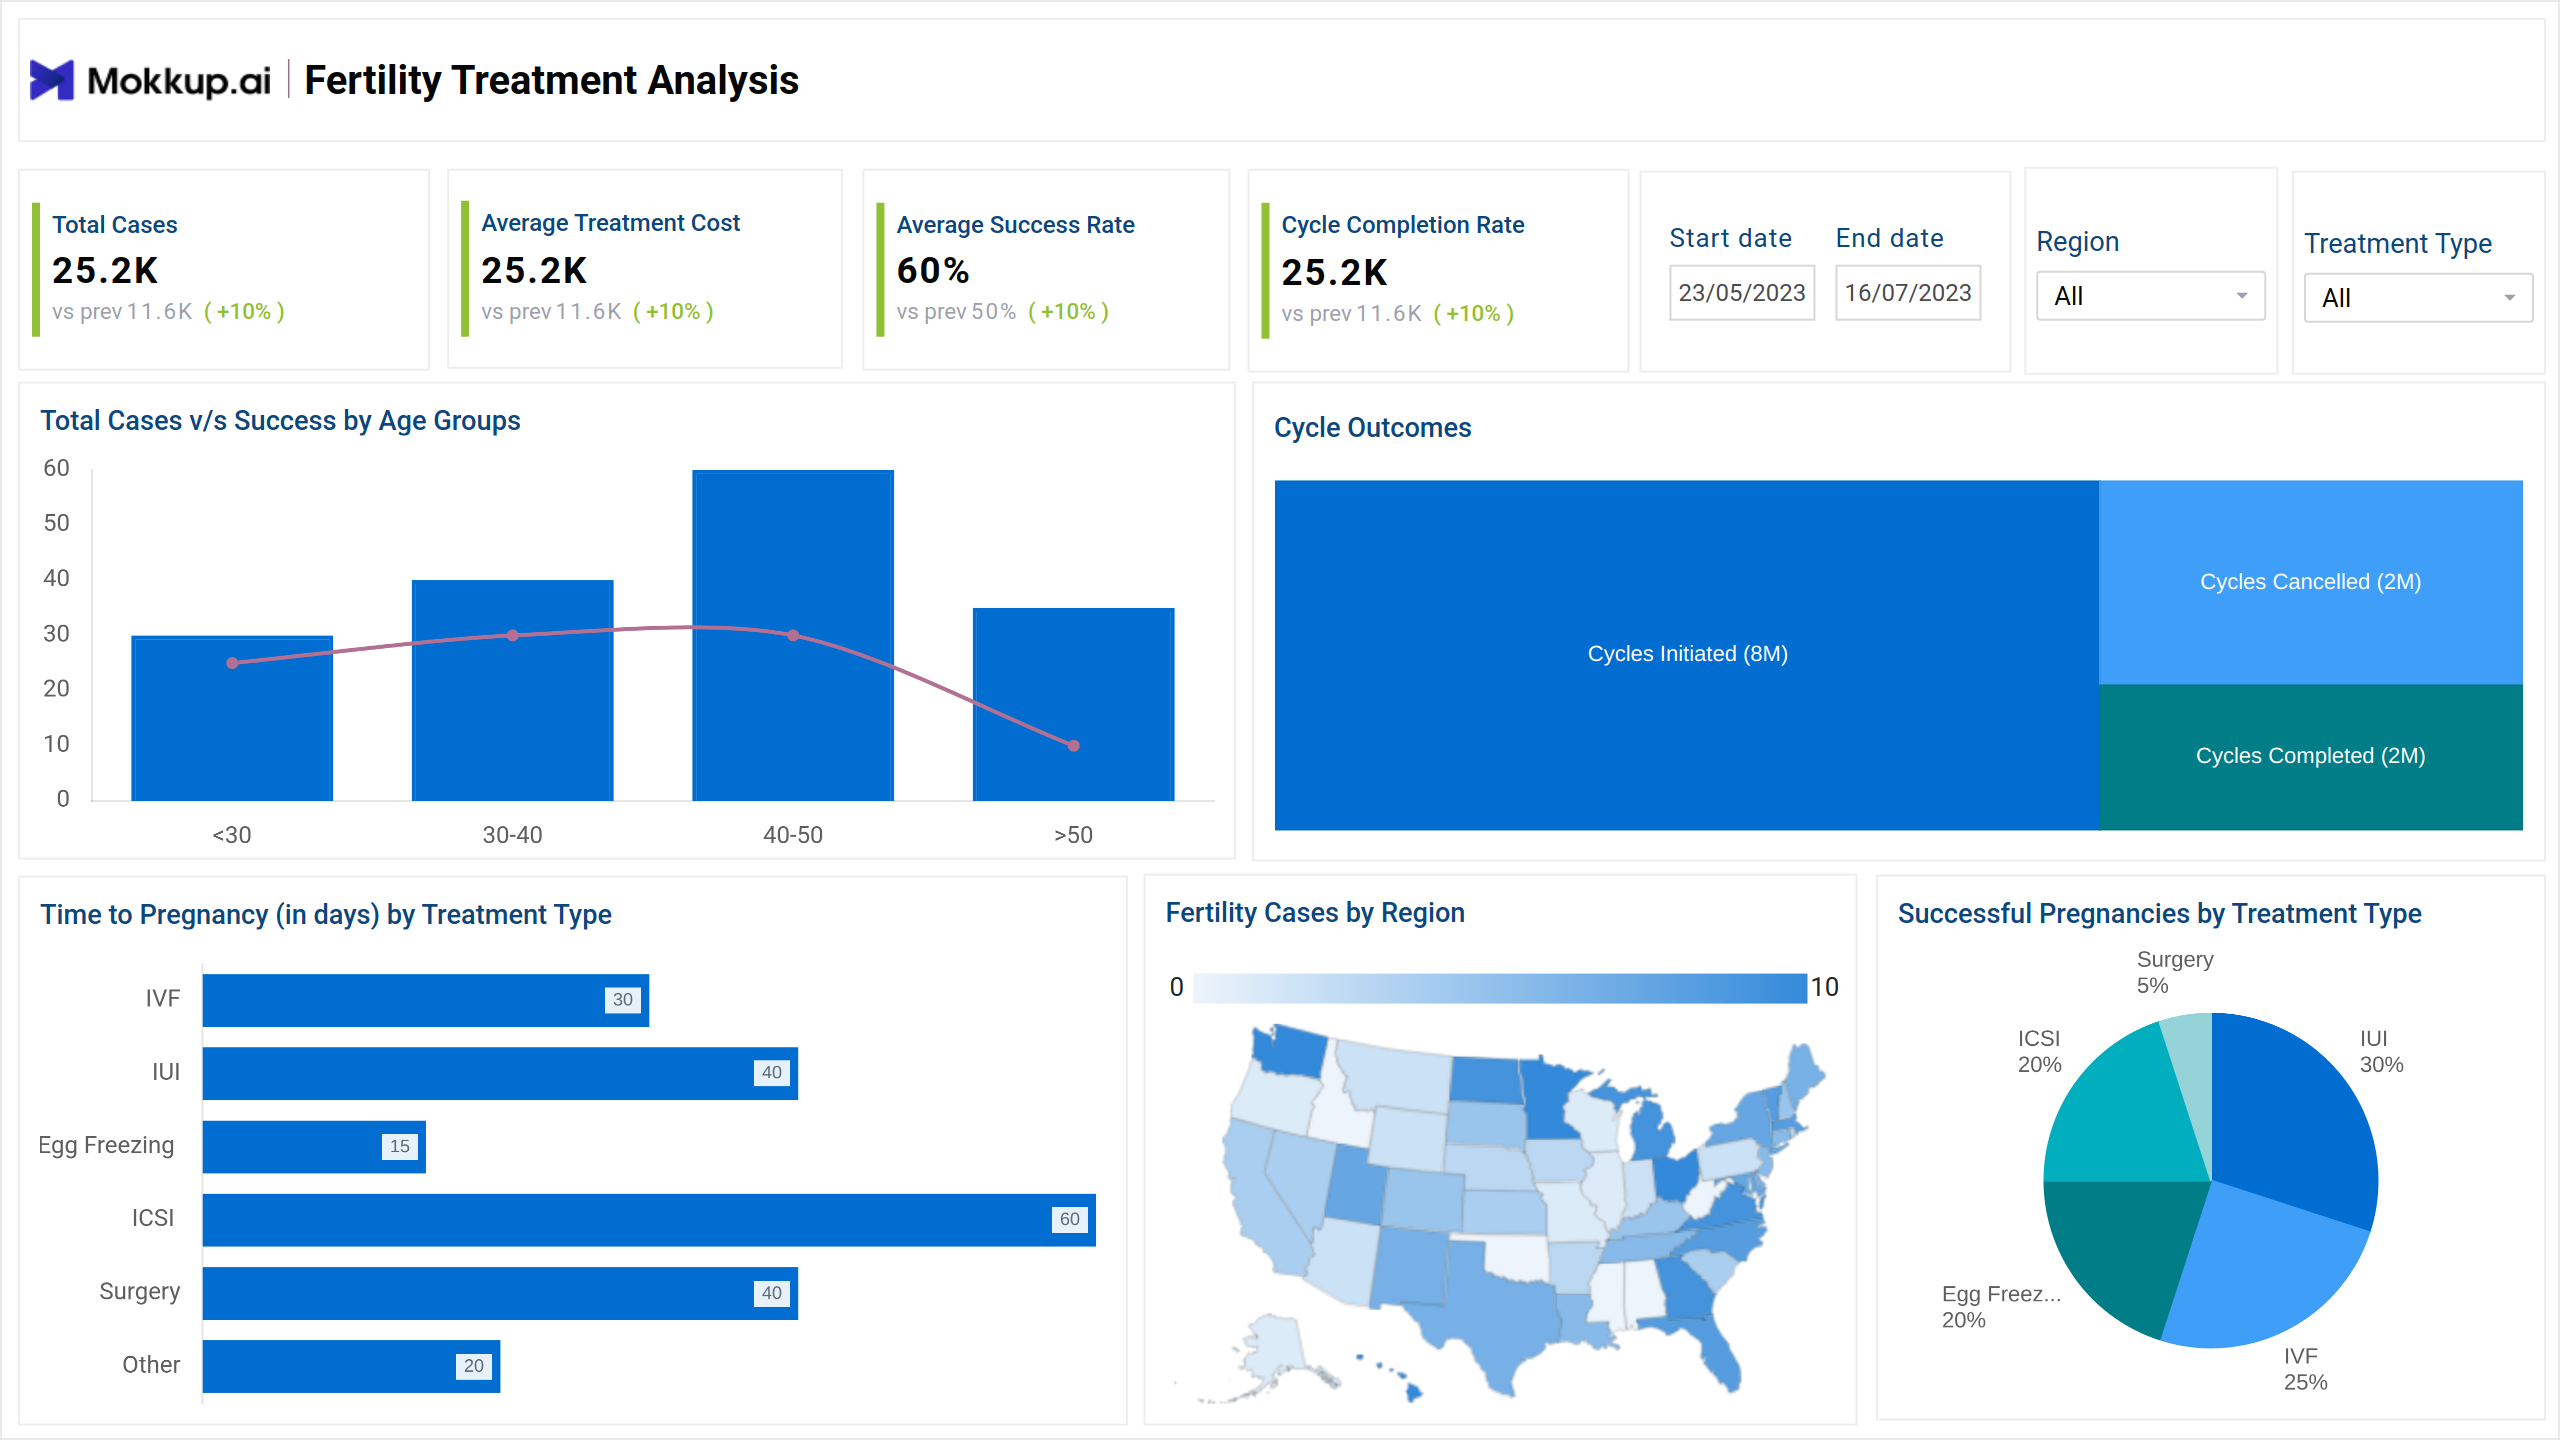
This fertility clinic dashboard template possesses a clean and intuitive dashboard layout for quickly locating relevant data at a glance. The top bar menu suggests the total cases, average treatment cost, average success rate, and cycle completion rate, which are placed in an appropriate visual hierarchy that boosts clarity. Use it as a fertility tracker to determine cycle outcomes and time to pregnancy days to determine the actions that clinicians need.
How to Analyze Data in Fertility Dashboards
Fertility dashboards are also used as IVF result dashboards to visualize successful pregnancies and the time it takes to get pregnant. Clinicians can analyze performance by evaluating the data with a mix of visualizations. For instance, bar charts can be used to compare outcomes, line charts can be used to track trends, pie charts can be used to show treatment distribution, and heatmaps can be used to show demographic performance. Clear KPI tiles at the top provide a quick view of priority data that requires immediate attention.
How to Create a Fertility Treatment Dashboard
You don’t need to build it from scratch. Just find the Mokkup.ai fertility dashboard template and add in your data and export it however you like. Follow these steps:
1. Create or Log in to Your Mokkup Account
Start by signing up on Mokkup.ai using your email. If you already have an account, just log in, and you’ll be good to go.
2. Choose and Customize Your Dashboard Template
The Fertility Intervention Review dashboard template is in the Templates section. Use the drag-and-drop editor to adjust KPIs, edit filters, or add elements based on your data.
3. Export to Your BI Tool
Once your dashboard wireframe is ready, use the BI Tool Export feature to send it directly to Power BI or Tableau for further analysis and enhancements. You can also download the dashboard as a PDF, PNG, or JPEG, embed it on a platform, or invite your team to collaborate.
Note: This is a Pro template. To use and customize this dashboard wireframe, you’ll need a Pro subscription on Mokkup. Upgrade anytime to unlock full access.
Benefits of Fertility Review Dashboards
This assisted reproduction data dashboard gives you a centralized view of operational and financial data to assist in informed decisions. Here are a few benefits of using this template:
- Establish fertility treatment outcome tracking in real-time that helps boost pregnancy rates.
- Make data-driven workflow improvements by identifying the bottlenecks in the treatment cycles and monitoring completion rates.
- Better performance benchmarking by comparing clinic locations, treatment types, and demographic groups.
- Clinicians can make faster operational decisions when the insights are rendered in real-time.
KPIs to Track in Fertility Dashboards
With this dashboard wireframe, you can track patient fertility success KPIs such as:
- Total Cases: Represents the total number of fertility treatment cases within the selected period.
- Average Treatment Cost: Calculates the average cost incurred for fertility treatments.
- Average Success Rate: Displays the average success rate of fertility treatments during the selected period.
- Cycle Completion Rate: Measures the percentage of fertility cycles completed successfully.
- Total Cases vs Success by Age Groups: The cases and success rates are segmented by patient age groups.
Frequently Asked Questions
1. Why is a Fertility Intervention Review important?
It helps identify what treatments are working, highlights areas for improvement, and supports personalized care plans. Reviews also enable clinics to optimize success rates and ensure efficient use of resources.
2. How do dashboards help with intervention reviews?
Dashboards provide visual summaries of treatment outcomes, cycle trends, and KPIs like success rate or cost per cycle, making it easier to analyze data and support evidence-based decisions.