What is an Irrigation & Water Distribution SCADA and Smart Irrigation Operations Dashboard?
The Irrigation & Water Distribution SCADA and Smart Irrigation Operations Dashboard is a centralized agricultural water management dashboard built for water utilities, municipal irrigation authorities, and network operators who need continuous visibility into distributed sensor infrastructure. It consolidates telemetry from field devices into a single operational view spanning system uptime, sensor health, communication performance, and irrigation automation outcomes. Using an irrigation SCADA dashboard like this, operations teams monitor system availability, communication success rates, and alert volumes without switching between disconnected platforms. Filters for region, irrigation zone, sensor type, and device status give teams precise control over every analysis. This smart irrigation operations monitoring tool converts raw telemetry into structured operational awareness.
How to Create an Irrigation & Water Distribution SCADA and Smart Irrigation Operations Dashboard
You don’t need to build your dashboard from scratch. Use Mokkup’s ready-to-use dashboard template to get started quickly. Here’s how:
1. Create or Log in to Your Mokkup Account
Start by signing up on Mokkup.ai using your email. If you already have an account, just log in, and you'll be good to go.
2. Choose and Customize Your Dashboard Template
Find the Irrigation & Water Distribution SCADA and Smart Irrigation Operations Dashboard template in the Templates section. Use the drag-and-drop editor to adjust KPIs, edit filters, or add elements based on your data.
3. Export to Your BI Tool
Once your dashboard wireframe is ready, use the BI Tool Export feature to send it directly to Power BI or Tableau for further analysis and enhancements. You can also download the dashboard as a PDF, PNG, or JPEG, embed it on a platform, or invite your team to collaborate.
Note: This is a Pro template. You'll need a Pro subscription on Mokkup to use and customize this dashboard wireframe. Upgrade anytime to unlock full access.
Irrigation & Water Distribution SCADA and Smart Irrigation Operations Dashboard Example
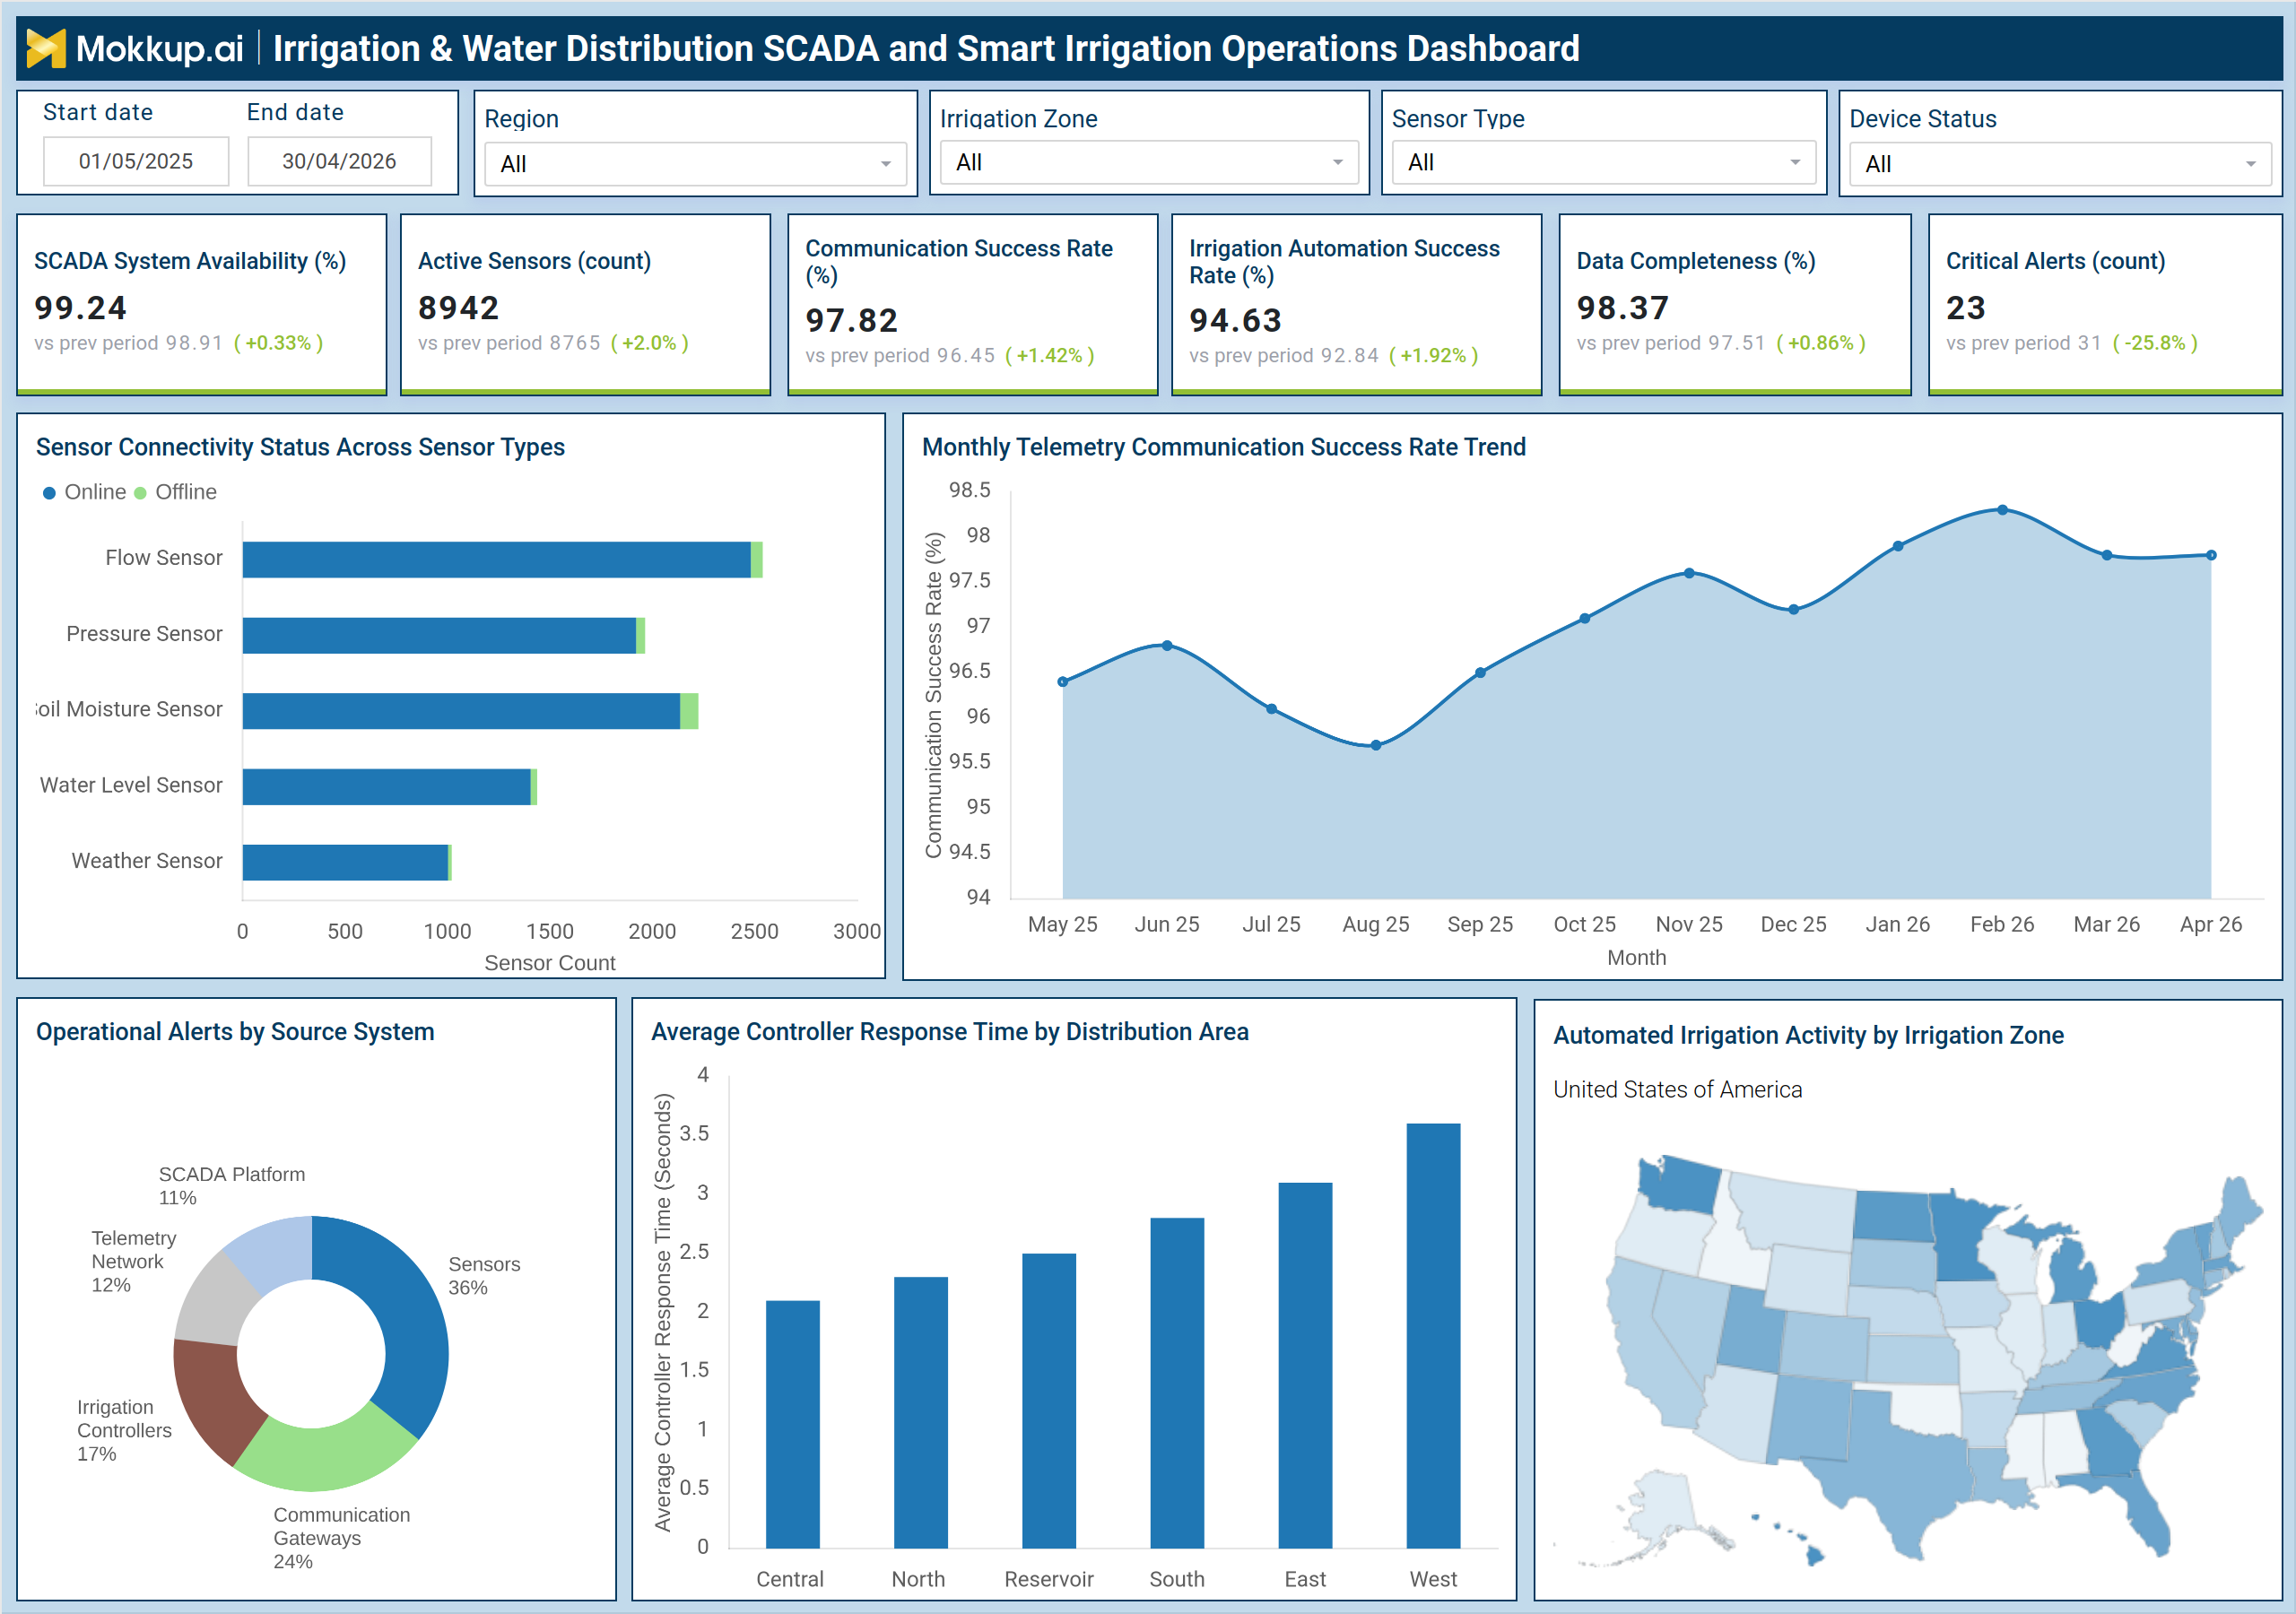
An irrigation operations team opens this dashboard at the start of each shift to confirm that sensor infrastructure is running cleanly and that overnight automated irrigation activity completed without incident. The core question is whether distribution zones are communicating as expected and whether any critical alerts require immediate attention.The Sensor Connectivity Status chart breaks down which sensor categories — flow, pressure, soil moisture, water level, and weather — are showing elevated offline counts. Managing water distribution sensor connectivity across large geographic footprints means pinpointing problems quickly, and cross-filtering by device status and irrigation zone turns a broad connectivity view into a targeted field dispatch decision.
The monthly telemetry trend line shows whether a communication success dip is isolated or building over weeks. The Operational Alerts by Source System breakdown identifies immediately whether issues originate from sensors, irrigation controllers, communication gateways, or the SCADA platform routing teams to the correct resolution path before manual investigation begins. For teams managing an agricultural water management dashboard at a regional scale, the irrigation zone activity map confirms that automated schedules are executing across all active areas, replacing manual schedule verification with direct visual confirmation.
How to Analyze Data in a Irrigation & Water Distribution SCADA and Smart Irrigation Operations Dashboard
Here is how you can analyze data from this dashboard:
- Filter by Irrigation Zone and Region to isolate sensor connectivity or alert trends to a specific distribution area
- Check Active Sensors count to detect unexpected drops in network coverage across the irrigation network
- Review Sensor Connectivity Status to identify which sensor types have elevated offline counts and prioritize field inspection
- Track the Monthly Telemetry Communication Success Rate Trend to distinguish isolated dips from sustained degradation
- Use Operational Alerts by Source System to route active alerts to the correct resolution team without manual investigation
- Benchmark Average Controller Response Time by Distribution Area to identify zones with performance gaps requiring review
- Reference the Automated Irrigation Activity map to confirm automation schedules are executing across all active zones
Benefits of an Irrigation & Water Distribution SCADA and Smart Irrigation Operations Dashboard
The following are the benefits of using this dashboard:
- Centralizes telemetry from flow, pressure, soil moisture, water level, and weather sensors into one operational view
- Reduces manual monitoring effort by surfacing sensor health and system uptime in a single interface
- Speeds alert triage by identifying which source system — sensor, controller, gateway, or SCADA platform, generated each alert
- Supports SCADA system availability monitoring across the full reporting period without accessing multiple platform tools
- Simplifies irrigation automation success rate tracking with a dedicated KPI tile visible from the main dashboard view
KPIs to Track in an Irrigation & Water Distribution SCADA and Smart Irrigation Operations Dashboard
The following key KPIs can be tracked by using this dashboard:
- SCADA System Availability (%): measures platform uptime percentage, the foundation of reliable irrigation SCADA dashboard performance
- Active Sensors (count): tracks the total number of sensors currently online and transmitting data across the network
- Communication Success Rate (%): captures the proportion of telemetry transmissions completing successfully, a direct measure of water distribution sensor connectivity health
- Irrigation Automation Success Rate (%): reflects the share of automated schedules executing without manual intervention, essential for irrigation automation success rate tracking
- Data Completeness (%): indicates the proportion of expected sensor data records received, flagging coverage gaps before they affect operations
- Critical Alerts (count): measures the volume of high-priority alerts generated in the reporting period, signaling active risks that require prompt attention
Frequently Asked Questions
1. What does SCADA system availability measure in this dashboard?
SCADA system availability captures the percentage of time the core platform remains fully operational during the reporting period. Teams rely on SCADA system availability monitoring to confirm infrastructure stability — any sustained decline is an escalation trigger.
2. How does the Irrigation Automation Success Rate help operations teams?
This KPI reflects how reliably automated irrigation schedules execute without requiring manual override. Teams use it as a quick check on whether smart irrigation operations monitoring is delivering as designed, and to flag controllers or zones where failure rates are elevated.
3. What should teams investigate when Critical Alerts spike unexpectedly?
Teams should first check the Operational Alerts by Source System breakdown to identify whether the spike originates from sensors, irrigation controllers, communication gateways, or the SCADA platform. Region and Device Status filters then narrow the affected scope for efficient field dispatch.