What is an LNG PSM Compliance & Audit Management Dashboard
An LNG PSM Compliance & Audit Management Dashboard is a strategic visualization platform designed to monitor, track, and report on process safety management (PSM) compliance and audit performance across LNG facilities. It aggregates critical safety and audit metrics such as PSM compliance rates, safety audit pass rates, high-risk findings, corrective action closure times, and finding severity distribution into a single, actionable interface.
By integrating PSM compliance tracking for LNG plants, process safety audit management, and high-risk findings closure tracking, this dashboard enables HSE managers, compliance officers, and facility leaders to maintain regulatory adherence, reduce process safety risks, and drive continuous improvement in safety culture. It serves as a central command center for audit planning, finding remediation, and demonstrating due diligence to regulators and stakeholders.
How to Create an LNG PSM Compliance & Audit Management Dashboard
You don't need to build your report from scratch, just start with a ready-to-use dashboard template from Mokkup. Add in your data and export it however you like. Here's how to do it:
1. Create or Log in to Your Mokkup Account
Start by signing up on Mokkup.ai using your email. If you already have an account, just log in, and you'll be good to go.
2. Choose and Customize Your Dashboard Template
Find the LNG PSM Compliance & Audit Management Dashboard template in the Templates section. Use the drag-and-drop editor to adjust KPIs, edit filters, or add elements based on your data.
3. Export to Your BI Tool
Once your dashboard wireframe is ready, use the BI Tool Export feature to send it directly to Power BI or Tableau for further analysis and enhancements. You can also download the dashboard as a PDF, PNG, or JPEG, embed it on a platform, or invite your team to collaborate.
Note: This is a Pro template. You'll need a Pro subscription on Mokkup to use and customize this dashboard wireframe. Upgrade anytime to unlock full access.
LNG PSM Compliance & Audit Management Dashboard Example
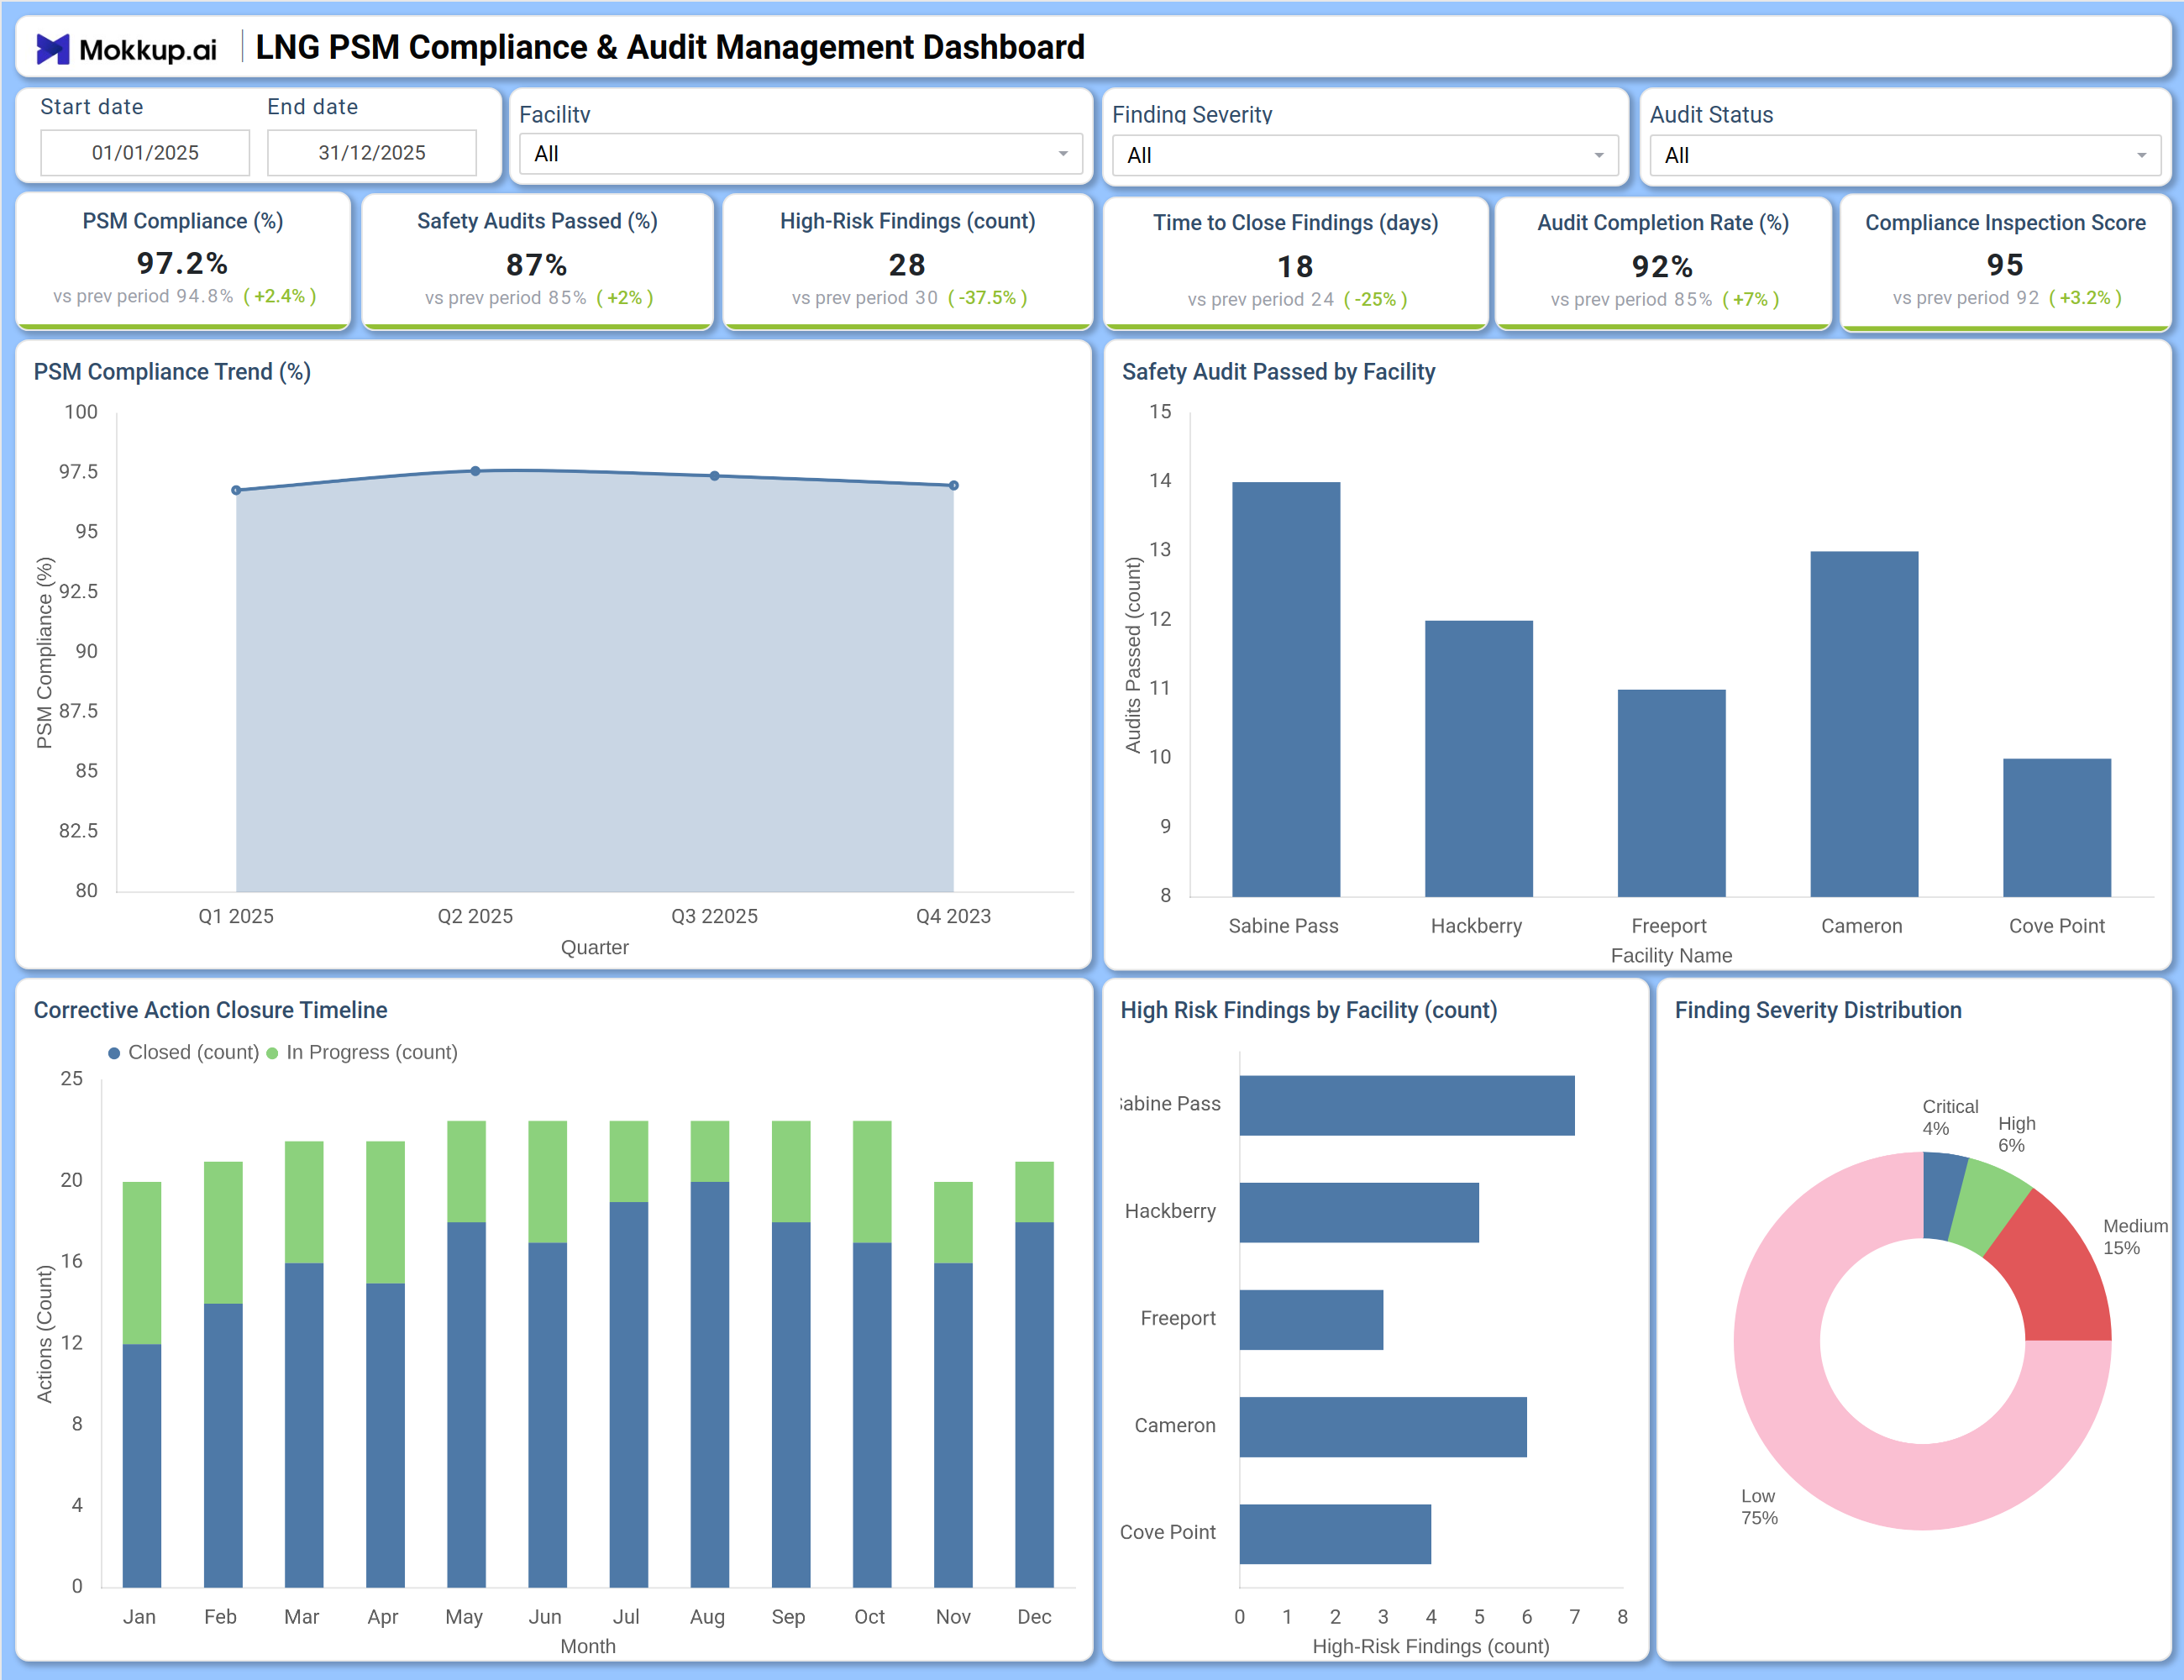
This dashboard delivers a comprehensive view of process safety compliance and audit performance across multiple LNG facilities. The Overview screen prominently displays six critical KPIs: PSM Compliance at 97.2% (up 2.4% from prior period), Safety Audits Passed at 87%, High-Risk Findings reduced to just 5 (a 37.5% decrease), Time to Close Findings improved to 18 days (25% faster), Audit Completion Rate at 92% (7% improvement), and Compliance Inspection Score at 95.
The PSM Compliance Trend chart tracks quarterly compliance levels, revealing improvement patterns and potential seasonal dips. Safety Audit Passed by Facility provides a facility-by-facility comparison, enabling benchmarking and identification of underperforming sites. The Corrective Action Closure Timeline shows closed versus in-progress findings over time, helping teams assess remediation velocity. High Risk Findings by Facility highlights locations requiring immediate attention, while the Finding Severity Distribution pie chart breaks down all findings by criticality: Critical (4%), High (6%), Medium (15%), and Low (75%). Together, these components enable LNG process safety auditing, PSM compliance monitoring, and risk-based corrective action prioritization.
How to Analyze Data in an LNG PSM Compliance & Audit Management Dashboard
Here is how you can analyze data from this dashboard:
- PSM Compliance (%): Track trends over time to ensure facilities consistently meet regulatory standards and to catch early signs of non-compliance.
- Safety Audits Passed (%): Measure how effectively safety programs are performing and how well sites are prepared for audits.
- High-Risk Findings (Count): Monitor critical safety issues to prioritize immediate action and allocate resources where they're needed most.
- Time to Close Findings (Days): Evaluate how quickly corrective actions are completed and identify delays or process bottlenecks.
- Audit Completion Rate (%): Ensure all scheduled audits are conducted on time and no facilities fall behind compliance timelines.
- Compliance Inspection Score: Use this as an overall indicator of how well each facility adheres to PSM standards and requirements.
- Safety Audit Performance by Facility: Compare audit results across locations to identify top-performing sites and replicate best practices.
- High-Risk Findings by Facility: Pinpoint underperforming sites that need additional support, training, or oversight.
- Finding Severity Distribution: Understand the spread of low, medium, and high-risk issues to ensure critical risks are addressed first.
- Corrective Action Closure Timeline: Monitor whether issue resolution is keeping pace with new findings to avoid backlog and risk accumulation.
Benefits of an LNG PSM Compliance & Audit Management Dashboard
The following are the benefits of using this dashboard:
- Centralized, Real-Time Visibility: Gain a unified view of PSM compliance and audit performance across all LNG facilities for better oversight and faster decision-making.
- Proactive Risk Mitigation: Identify high-risk findings early and track their closure to reduce the likelihood of incidents.
- Regulatory Compliance Support: Stay aligned with standards like OSHA PSM and EPA RMP, along with other global safety frameworks.
- Improved Audit Efficiency: Streamline audit processes by tracking completion rates and findings in a structured, consistent manner.
- Faster Issue Resolution: Detect delays in corrective actions and optimize workflows to reduce the time required to close findings.
- Stronger Safety Culture: Promote accountability and awareness by making compliance performance and improvement trends visible across teams.
- Facility Benchmarking & Best Practices: Compare performance across sites to identify leaders and replicate successful safety practices.
- Demonstrated Due Diligence: Maintain auditable compliance records to build trust with regulators, investors, and stakeholders.
KPIs to Track in an LNG PSM Compliance & Audit Management Dashboard
The following key KPIs can be tracked by using this dashboard:
- PSM Compliance (%): Overall percentage adherence to process safety management program requirements.
- Safety Audits Passed (%): Proportion of audits achieving a passing score or rating.
- High-Risk Findings: Number of audit findings classified as high or critical severity requiring immediate action.
- Time to Close Findings (days): Average duration from finding identification to final resolution.
- Audit Completion Rate (%): Percentage of scheduled audits that have been completed.
- Compliance Inspection Score: Composite score from regulatory or third-party inspections.
- Finding Severity Distribution: Breakdown of all findings by criticality level (Critical, High, Medium, Low).
- Corrective Action Closure Rate: Number of findings closed versus those still in progress over time.
- Facility-Level Compliance: Individual PSM compliance scores by facility for comparative analysis.
Frequently Asked Questions
1. What is PSM compliance in the LNG industry?
Process Safety Management (PSM) compliance refers to adherence to a set of regulations and standards (such as OSHA's PSM standard 29 CFR 1910.119) designed to prevent catastrophic releases of hazardous chemicals. It encompasses 14 elements, including process hazard analysis, mechanical integrity, management of change, and incident investigation.
2. How often should PSM audits be conducted?
Most regulations require comprehensive PSM compliance audits at least every three years. However, many companies conduct internal audits annually and external audits on a three-year cycle. This dashboard supports both frequencies.
3. How can this dashboard help reduce the time to close findings?
By tracking closure times and visualizing in-progress versus closed findings over time, the dashboard highlights bottlenecks and allows managers to reallocate resources or escalate issues that are stalling.
4. Can this dashboard integrate with existing audit management systems?
Yes. The Mokkup template can connect to leading audit management software, CMMS systems, or spreadsheets via CSV uploads, APIs, or BI tool connectors to pull finding and compliance data.
5. Who typically uses this dashboard?
HSE (Health, Safety & Environment) managers, compliance officers, plant managers, audit leads, and corporate safety directors use it to oversee PSM performance and drive improvement.