
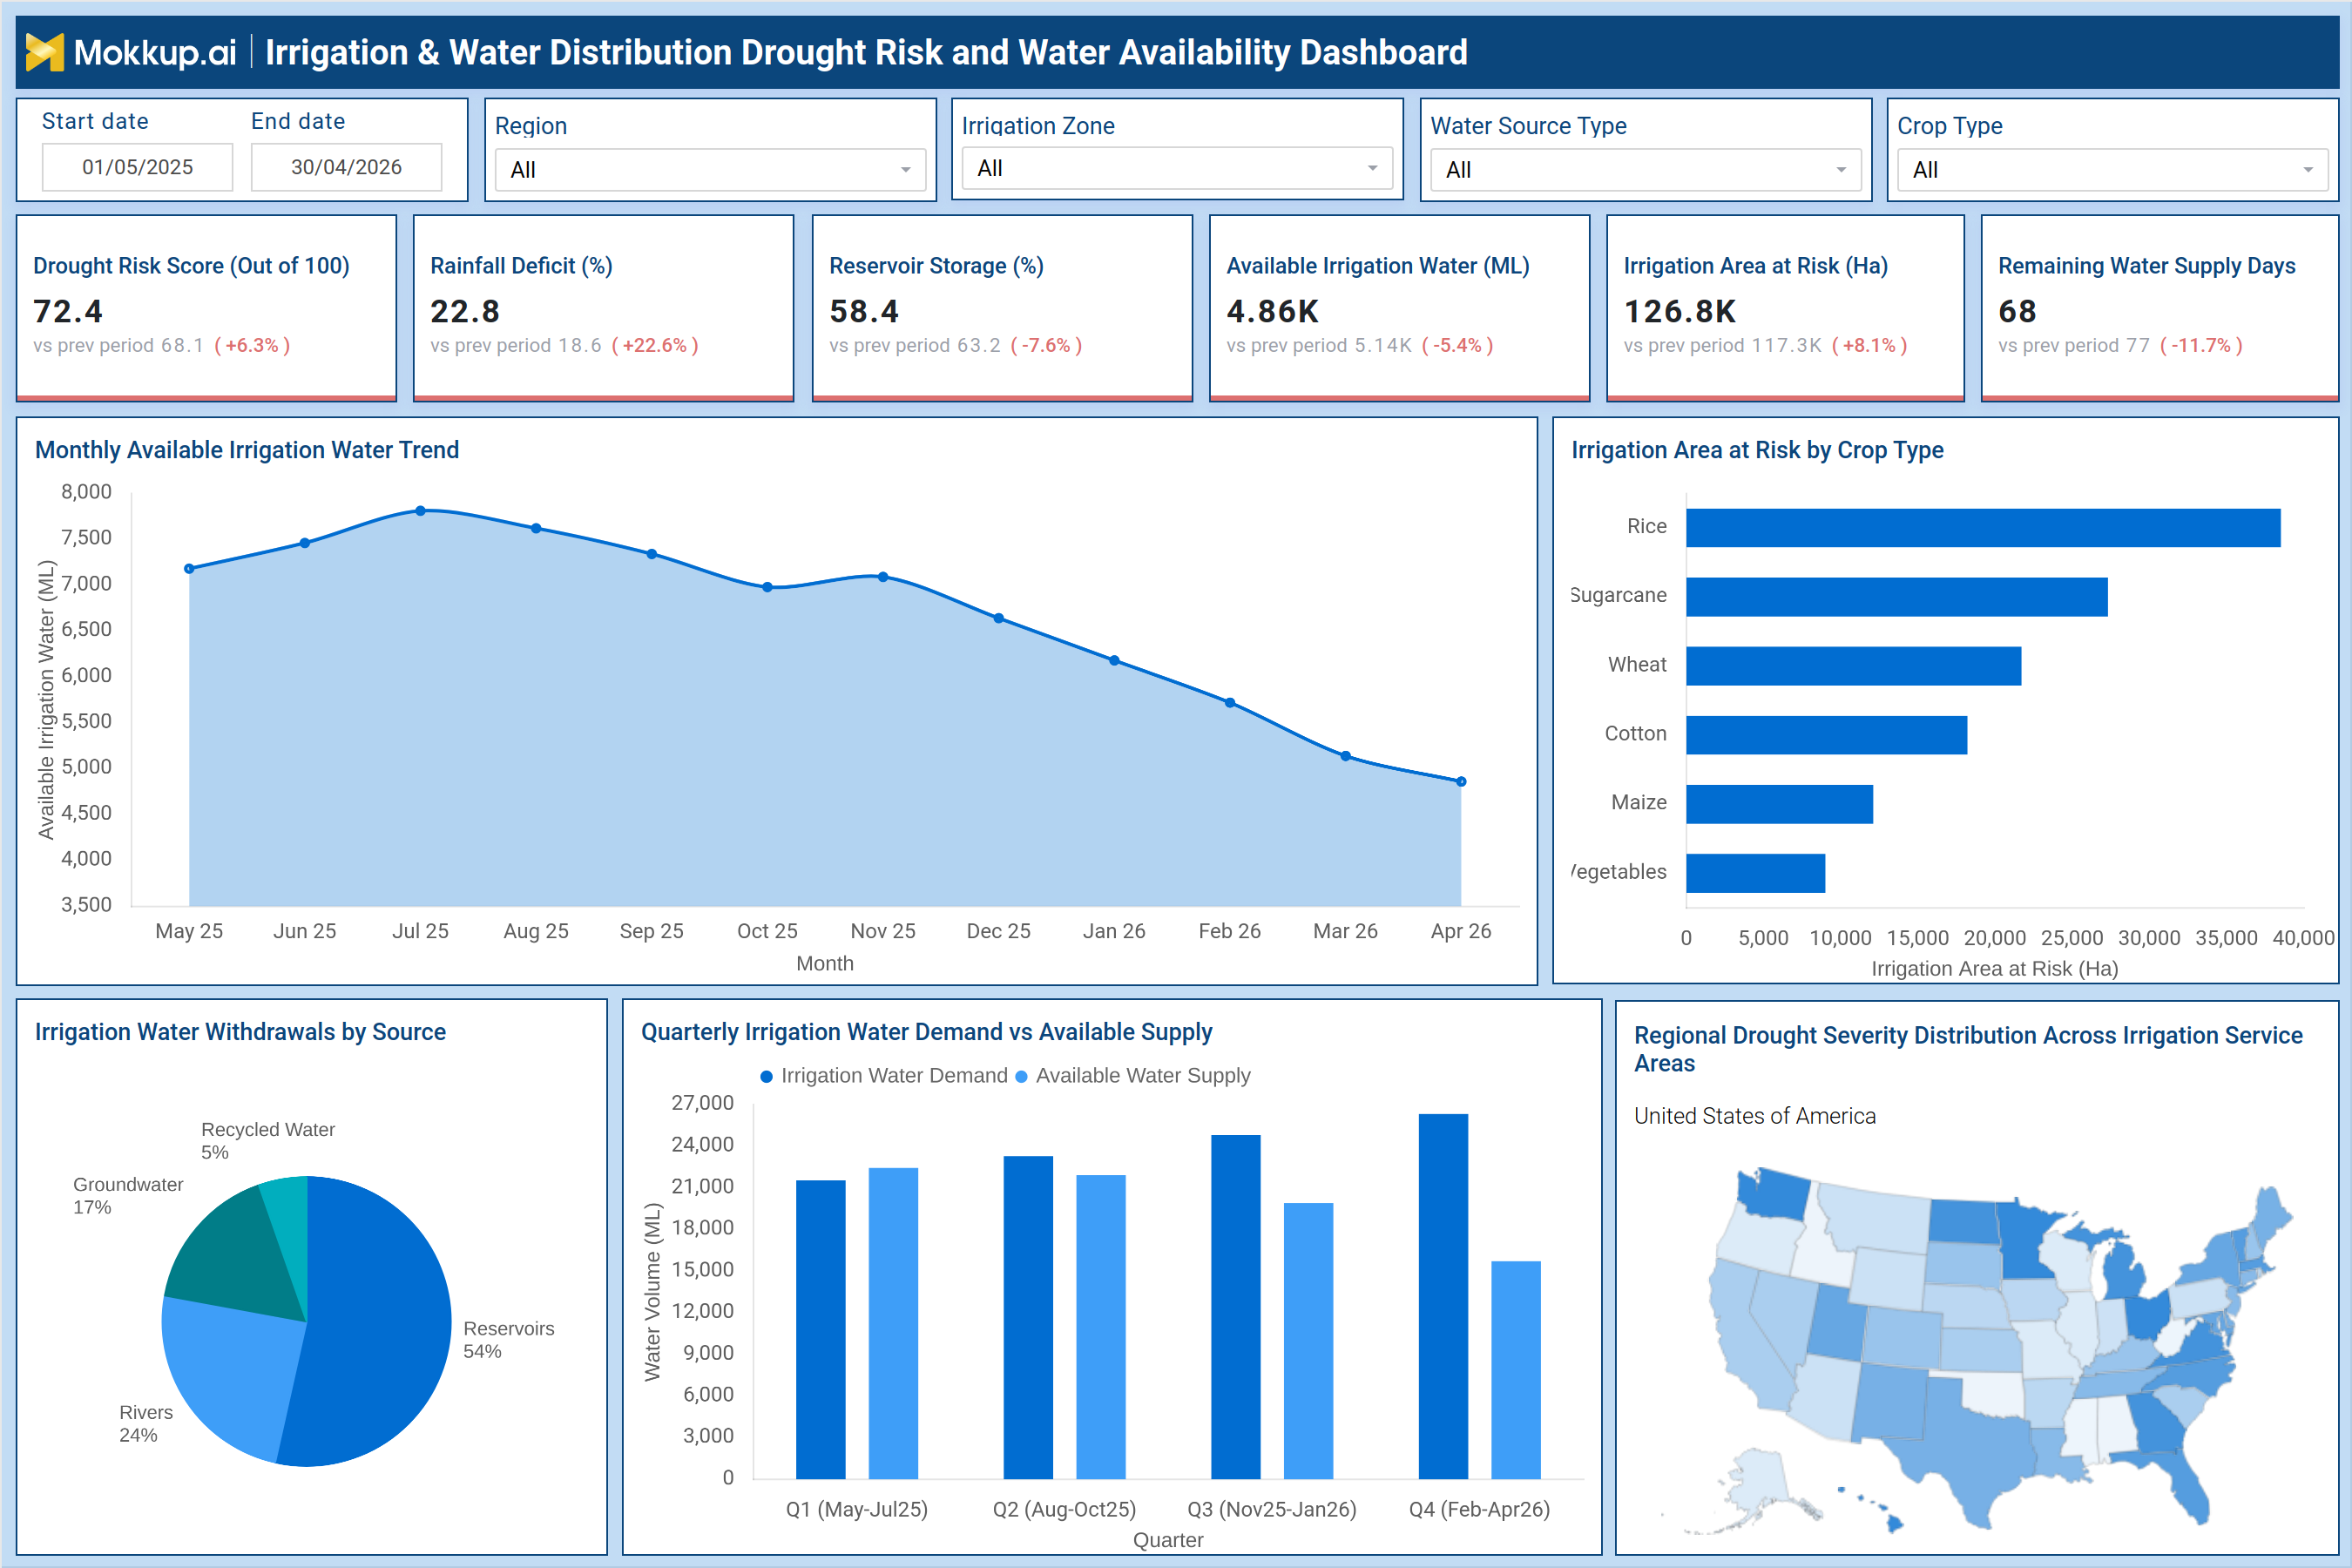
What is an Irrigation & Water Distribution Drought Risk and Water Availability Dashboard?
An irrigation & water distribution drought risk and water availability dashboard is a monitoring and planning solution designed to help water utilities, irrigation authorities, and agricultural agencies assess drought conditions, evaluate water availability, and manage irrigation resources effectively. The dashboard combines hydrological, operational, and demand-related metrics to provide a complete view of drought exposure, available water resources, and irrigation risk across regions and service areas. An irrigation and water distribution drought risk dashboard helps decision-makers monitor reservoir levels, rainfall deficits, irrigation demand, water withdrawals, and remaining water supply. By consolidating these indicators into a single platform, organizations can identify water scarcity risks early and implement mitigation strategies before shortages affect agricultural operations. The dashboard also serves as an irrigation drought risk and water availability monitoring dashboard by supporting proactive resource allocation, drought preparedness planning, and long-term water sustainability initiatives.
How to Create an Irrigation & Water Distribution Drought Risk and Water Availability Dashboard
You don't need to build your report from scratch, just start with a ready-to-use dashboard template from Mokkup. Add in your data and export it however you like. Here's how to do it:
1. Create or Log in to Your Mokkup Account
Start by signing up on Mokkup.ai using your email. If you already have an account, just log in, and you'll be good to go.
2. Choose and Customize Your Dashboard Template
Find the Irrigation & Water Distribution Drought Risk and Water Availability Dashboard template in the Templates section. Use the drag-and-drop editor to adjust KPIs, edit filters, or add elements based on your data.
3. Export to Your BI Tool
Once your dashboard wireframe is ready, use the BI Tool Export feature to send it directly to Power BI or Tableau for further analysis and enhancements. You can also download the dashboard as a PDF, PNG, or JPEG, embed it on a platform, or invite your team to collaborate.
Note: This is a Pro template. You'll need a Pro subscription on Mokkup to use and customize this dashboard wireframe. Upgrade anytime to unlock full access.
Irrigation & Water Distribution Drought Risk and Water Availability Dashboard Example
A regional irrigation authority responsible for supplying water across multiple agricultural zones can use this dashboard to monitor drought severity and water availability throughout the growing season. The dashboard may display key performance indicators such as Drought Risk Score, Rainfall Deficit, Reservoir Storage, Available Irrigation Water, Irrigation Area at Risk, and Remaining Water Supply Days. Operations teams can analyze monthly irrigation water availability trends to identify declining water reserves and anticipate shortages.
The water distribution drought risk analytics dashboard helps managers compare irrigation demand against available water supply to determine whether additional conservation measures are required. Crop-specific risk analysis allows planners to identify which agricultural sectors face the highest exposure during drought conditions. The dashboard also functions as an irrigation water supply risk management analytics solution by tracking water withdrawals from reservoirs, rivers, groundwater, and recycled water sources. Regional drought severity maps provide a geographic view of risk concentration, enabling targeted interventions and resource prioritization in vulnerable irrigation zones.
How to Analyze Data in Irrigation & Water Distribution Drought Risk and Water Availability Dashboard
Here is how you can analyze data from this dashboard:
- Monitor Drought Risk Score: Evaluate overall drought exposure levels to understand potential impacts on water availability and irrigation operations.
- Analyze Rainfall Deficit (%): Measure precipitation shortages against historical averages to identify areas experiencing reduced rainfall and increased drought risk.
- Track Reservoir Storage (%): Monitor reservoir capacity levels to assess available water reserves and support effective resource management.
- Monitor Available Irrigation Water (ML): Track the volume of water available for irrigation to ensure sufficient supply for agricultural and operational needs.
- Review Irrigation Area at Risk (Ha): Identify agricultural zones vulnerable to water shortages to prioritize mitigation strategies and resource allocation.
- Track Remaining Water Supply Days: Estimate how long current water resources can meet demand under existing consumption patterns and supply conditions.
- Analyze Monthly Available Irrigation Water Trends: Review seasonal fluctuations in water availability to support forecasting, planning, and drought preparedness efforts.
- Review Irrigation Area at Risk by Crop Type: Assess drought vulnerability across different crop categories to prioritize protection measures and optimize water distribution.
- Monitor Irrigation Water Withdrawals by Source: Analyze water extraction from reservoirs, rivers, groundwater, and other sources to understand resource dependency and sustainability risks.
- Compare Irrigation Water Demand Versus Available Supply: Evaluate current and projected water demand against available resources to identify potential shortages and supply gaps.
- Analyze Regional Drought Severity Distribution: Compare drought conditions across regions to identify high-risk service areas and target intervention efforts effectively.
- Use Historical Trends for Planning: Leverage historical drought, rainfall, and water availability data to improve drought preparedness, forecasting, and long-term water allocation strategies.
Benefits of Irrigation & Water Distribution Drought Risk and Water Availability Dashboard
The following are the benefits of using this dashboard:
- Improves Visibility into Drought Conditions: Provides real-time insights into drought severity, rainfall deficits, and water resource availability to support informed decision-making.
- Supports Proactive Drought Preparedness: Enables early identification of drought risks, helping organizations develop response plans and mitigation strategies before conditions worsen.
- Optimizes Irrigation Water Allocation: Supports efficient distribution of available water resources by aligning supply with irrigation priorities and demand requirements.
- Reduces the Risk of Water Shortages: Helps identify potential supply gaps early, minimizing disruptions during critical agricultural growing seasons.
- Enhances Reservoir and Groundwater Management: Monitors water storage levels and resource utilization to ensure sustainable management of reservoirs, aquifers, and other water sources.
- Improves Long-Term Water Sustainability Planning: Provides historical and predictive insights that support strategic water conservation, allocation, and infrastructure planning efforts.
- Helps Prioritize High-Risk Irrigation Zones: Identifies agricultural areas most vulnerable to drought conditions, enabling targeted interventions and resource allocation.
- Supports Crop Protection Strategies: Facilitates risk-based water distribution to protect high-value or drought-sensitive crops during periods of limited water availability.
- Enhances Decision-Making with Centralized Analytics: Consolidates drought, supply, and demand metrics into a single platform for faster and more informed operational decisions.
- Improves Monitoring of Water Demand and Supply Balance: Continuously compares available water resources with consumption needs to support effective resource planning and management.
- Supports Regulatory and Environmental Initiatives: Helps organizations meet water management requirements and sustainability goals through improved monitoring and reporting capabilities.
- Strengthens Climate Resilience: Enables organizations to adapt to changing weather patterns and long-term climate challenges through proactive drought management and resource planning.
KPIs to Track in Irrigation & Water Distribution Drought Risk and Water Availability Dashboard
The following key KPIs can be tracked by using the irrigation water supply risk management analytics dashboard:
- Drought Risk Score (Out of 100): Measures overall drought severity and water scarcity risk.
- Rainfall Deficit (%): Tracks the percentage shortfall in rainfall compared to expected levels.
- Reservoir Storage (%): Measures available water stored in reservoirs.
- Available Irrigation Water (ML): Tracks total water available for irrigation use.
- Irrigation Area at Risk (Ha): Measures agricultural land potentially affected by water shortages.
- Remaining Water Supply Days: Estimates the number of days current water resources can support demand.
Frequently Asked Questions
1. Why is a drought risk and water availability dashboard important?
It helps irrigation authorities and water utilities monitor water scarcity risks, manage available resources, and improve drought preparedness.
2. What data is typically monitored in this dashboard?
The dashboard tracks drought risk scores, rainfall deficits, reservoir storage, irrigation water availability, supply duration, and irrigation areas at risk.
3. How does the dashboard support water resource planning?
It provides visibility into current and projected water availability, helping planners allocate resources efficiently and reduce drought-related disruptions.