What is an Irrigation Water Allocation & Demand Balancing Dashboard?
The Irrigation Water Allocation & Demand Balancing Dashboard is a structured planning tool designed for water resource managers, irrigation district administrators, and agricultural operations teams. It tracks total irrigation demand against allocated water volumes across districts, regions, and crop types, giving planners a clear picture of where supply and demand diverge. By consolidating key metrics such as equity compliance rate, projected seasonal shortfall, and supply-demand balance into a single view, this irrigation water demand tracking dashboard eliminates the need for fragmented spreadsheets and disconnected reports. Teams responsible for water allocation planning across agricultural zones rely on this dashboard to make data-backed decisions about how water is distributed, restricted, and monitored throughout the irrigation season.
How to Create an Irrigation Water Allocation & Demand Balancing Dashboard
You don't need to build your report from scratch, just start with a ready-to-use dashboard template from Mokkup. Add in your data and export it however you like. Here's how to do it:
1. Create or Log in to Your Mokkup Account
Start by signing up on Mokkup.ai using your email. If you already have an account, just log in, and you'll be good to go.
2. Choose and Customize Your Dashboard Template
Find the Irrigation Water Allocation & Demand Balancing Dashboard template in the Templates section. Use the drag-and-drop editor to adjust KPIs, edit filters, or add elements based on your data.
3. Export to Your BI Tool
Once your dashboard wireframe is ready, use the BI Tool Export feature to send it directly to Power BI or Tableau for further analysis and enhancements. You can also download the dashboard as a PDF, PNG, or JPEG, embed it on a platform, or invite your team to collaborate.
Note: This is a Pro template. You'll need a Pro subscription on Mokkup to use and customize this dashboard wireframe. Upgrade anytime to unlock full access.
Irrigation Water Allocation & Demand Balancing Dashboard Example
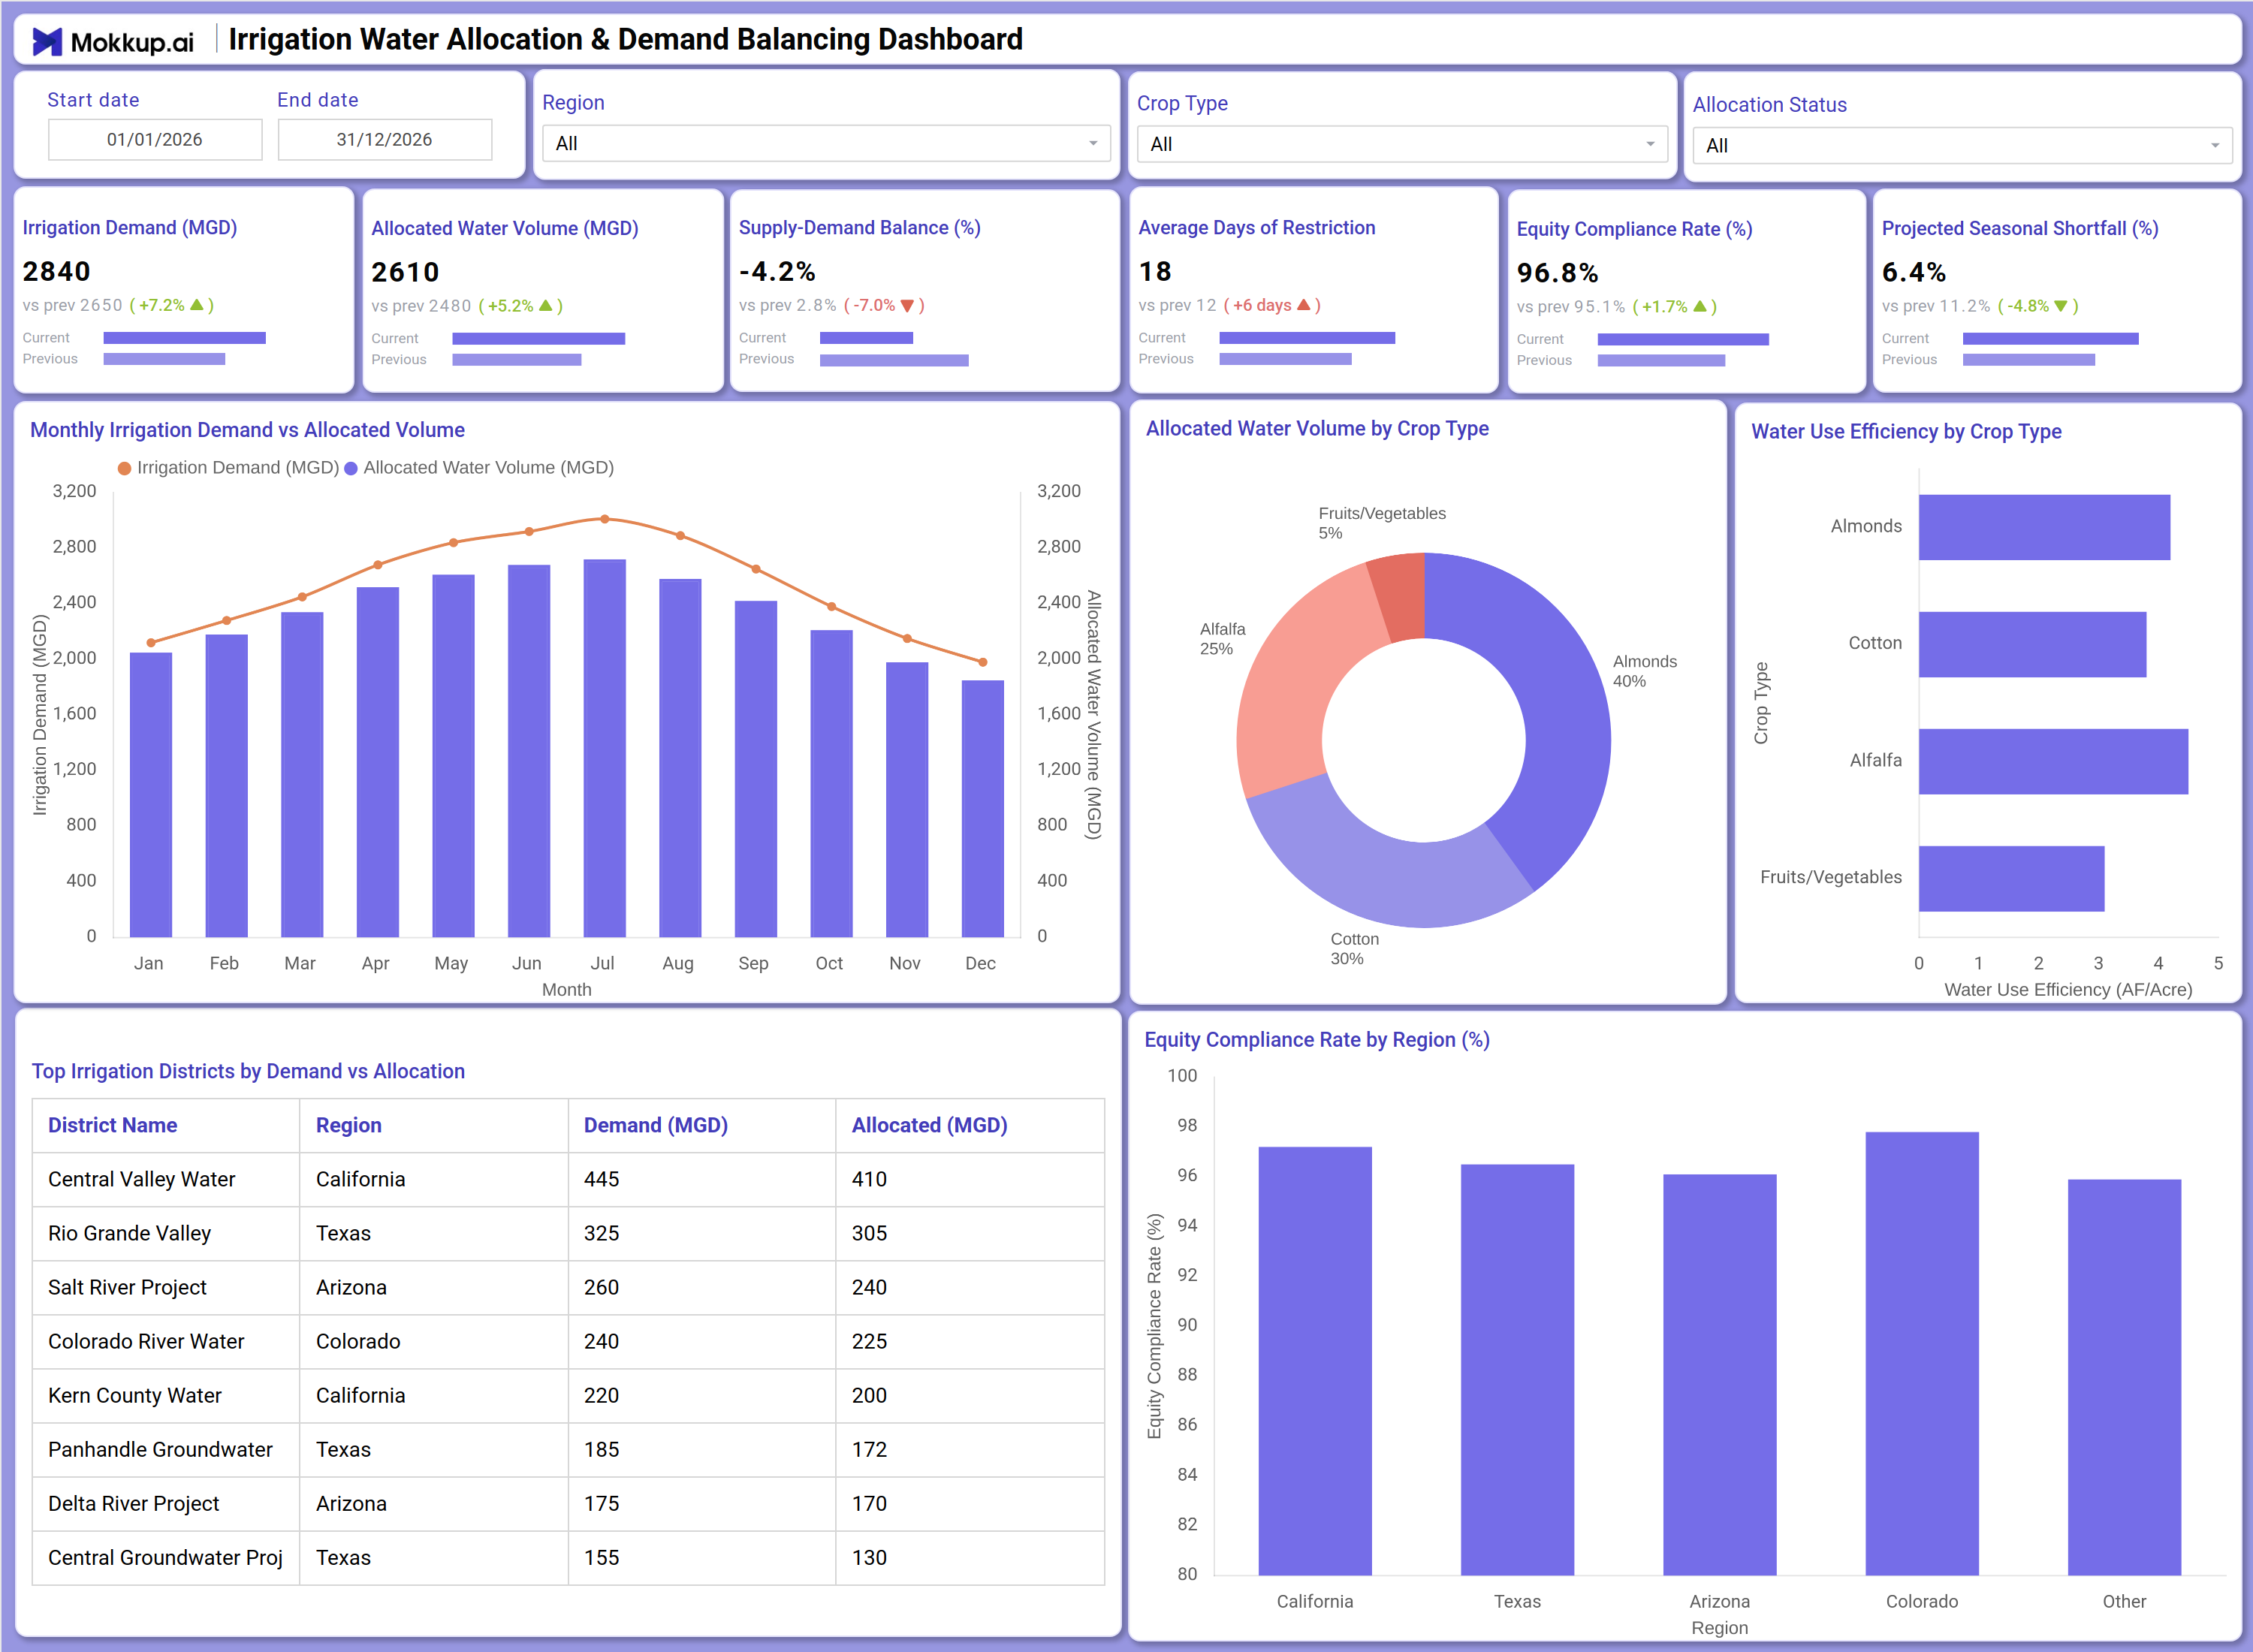
An irrigation district planner opens this dashboard at the start of each week to assess whether allocated volumes are keeping pace with actual demand across the region. The KPI tiles at the top give an immediate reading on supply-demand balance and projected seasonal shortfall, signaling whether any corrective action is needed before conditions worsen. Using the crop-type water use efficiency analysis, the planner identifies which crops are consuming more water per acre than anticipated and flags those segments for review. The monthly demand vs. allocation trend chart helps the team compare current irrigation cycles with historical patterns, supporting proactive adjustments before peak-demand months arrive. Across all views, the equity compliance rate by region bar chart ensures that water distribution practices remain consistent and fair across all districts, a critical requirement for regulatory reporting and agricultural water equity compliance.
How to Analyze Data in an Irrigation Water Allocation & Demand Balancing Dashboard
Here is how you can analyze data from this dashboard:
- Use the Region filter to isolate irrigation performance data for a specific state or district.
- Apply the Crop Type filter to compare demand and allocation across Almonds, Cotton, Alfalfa, and Fruits/Vegetables.
- Use the Allocation Status filter to view only districts with active, restricted, or shortfall allocation status.
- Monitor the Monthly Irrigation Demand vs Allocated Volume chart to identify months where demand consistently exceeds allocation.
- Review the Allocated Water Volume by Crop Type donut chart to assess crop-level share of total water distribution.
- Analyze the Water Use Efficiency by Crop Type bar chart to identify which crops consume the most water per acre relative to peers.
- Review the Top Irrigation Districts by Demand vs Allocation table to find districts with the largest gaps between demand and supply.
- Track the Equity Compliance Rate by Region chart to ensure all regions meet irrigation water equity standards across the season.
- Monitor Supply-Demand Balance (%) to detect early signs of system-wide water stress before restrictions become unavoidable.
- Use the date range filter to compare current season performance against prior periods for trend analysis.
Benefits of an Irrigation Water Allocation & Demand Balancing Dashboard
The following are the benefits of using this dashboard:
- Centralizes irrigation demand, allocation, and compliance data across all districts in one structured template.
- Supports agricultural water equity compliance monitoring across multiple regions simultaneously.
- Reduces manual reporting effort with pre-built KPI tiles covering demand, shortfall, and restriction days.
- Enables crop-level analysis of water use efficiency to guide precision allocation decisions.
- Provides a regional breakdown of equity compliance rates for regulatory audit and performance review.
- Helps water resource managers align seasonal allocations with actual demand trends across crop types.
- Gives district administrators and planners a shared view of irrigation water allocation planning status.
KPIs to Track in an Irrigation Water Allocation & Demand Balancing Dashboard
The following key KPIs can be tracked by using this dashboard:
- Total Irrigation Demand (MGD): Measures the total volume of water requested across all irrigation districts, essential for irrigation water demand tracking against available supply.
- Allocated Water Volume (MGD): Tracks the total volume of water formally assigned to districts, compared against demand to identify shortfall or surplus conditions.
- Supply-Demand Balance (%): Quantifies the percentage gap between water supply and demand; a negative value signals an active supply shortfall requiring intervention.
- Average Days of Restriction: Measures how many days on average water use is restricted across districts, key to understanding operational impact of supply constraints.
- Equity Compliance Rate (%): Evaluates whether water is being distributed fairly across districts and regions, central to agricultural water equity compliance and regulatory reporting.
- Projected Seasonal Shortfall (%): Tracks the estimated percentage of unmet demand for the full season, critical for forward-looking irrigation water allocation planning before peak demand arrives.
Frequently Asked Questions
1. What industries benefit most from the Irrigation Water Allocation & Demand Balancing Dashboard?
This dashboard is built for irrigation district administrators, agricultural water managers, and regional water authorities. It is particularly useful for operations spanning multiple crop types and geographic regions where allocation equity and compliance tracking are ongoing priorities.
2. Can this dashboard track water use efficiency across different crop types?
Yes. The Water Use Efficiency by Crop Type horizontal bar chart displays efficiency values in AF/acre for almonds, cotton, alfalfa, and fruits/vegetables. This allows planners to compare crop-level consumption patterns and identify where demand exceeds efficient use benchmarks.
3. How does the Equity Compliance Rate by Region chart work?
The bar chart displays the equity compliance rate as a percentage for each region, including California, Texas, Arizona, Colorado, and Other. It shows how consistently water is distributed relative to established equity standards, supporting both internal review and external regulatory reporting.