
What is an Energy Consumption & Efficiency Dashboard?
Managing energy consumption and improving efficiency are crucial challenges for organizations across sectors. The Energy Consumption & Efficiency Dashboard template provides a data-driven approach to monitoring energy patterns, understanding equipment performance, and enhancing operational efficiency. By consolidating key metrics in a unified platform, this dashboard wireframe enables facility managers and administrators to make informed decisions that optimize energy usage and reduce operational costs.
Energy Efficiency Dashboard Example
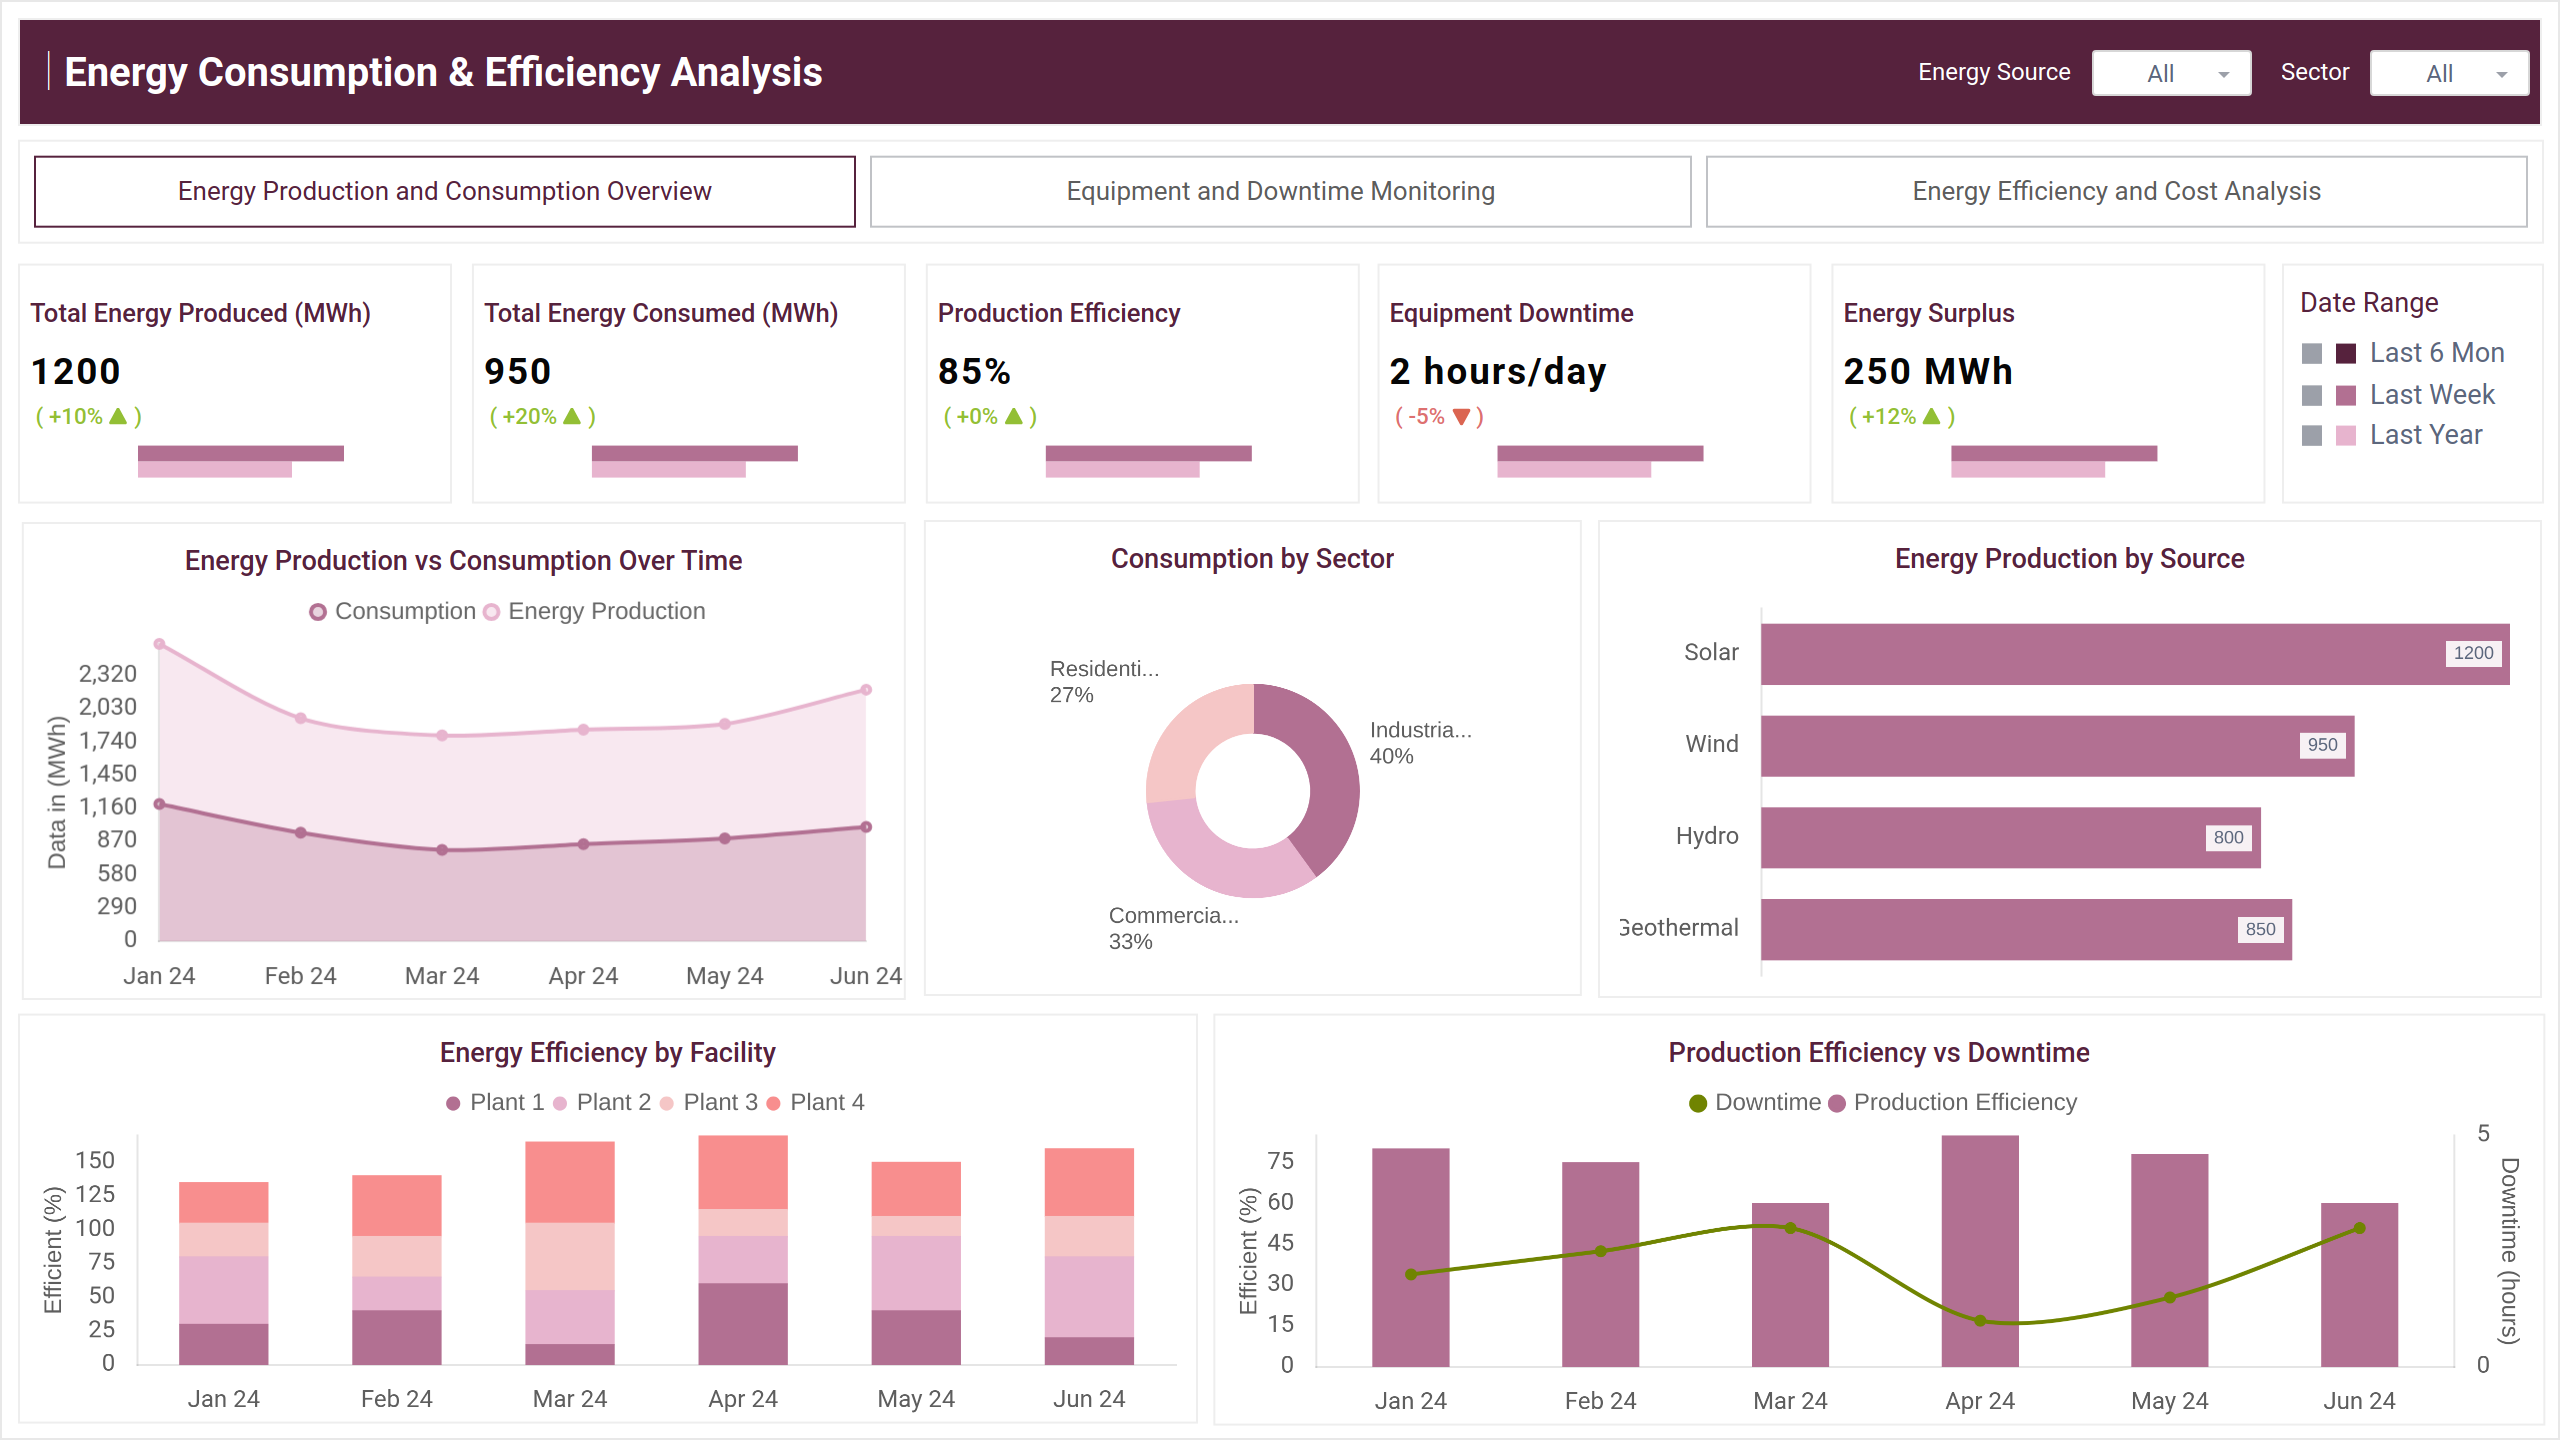
The Mokkup’s energy efficiency dashboard wireframe centralizes critical metrics like energy production, consumption trends, system efficiency, downtime, and energy surplus into a clean, insightful layout. Built for facility managers, sustainability teams, and operations leads, this template offers a data-driven view of energy usage, equipment performance, and cost impact, helping organizations identify inefficiencies, plan maintenance, and boost sustainability efforts.
How to Analyze Data in Energy Dashboards
Energy dashboard wireframe provides a comprehensive view of energy production, consumption, and efficiency. Here are the key points:
- Track Energy Consumption: Monitor energy use across different sources and sectors.
- Identify Efficiency Gaps: Spot areas where energy efficiency can be improved.
- Monitor Production and Consumption Trends: Analyze energy usage patterns over time.
- Evaluate Equipment Performance: Keep track of equipment performance and downtime.
How to Create an Energy Efficiency Dashboard
You don’t need to build your report from scratch—just start with a ready-to-use sample energy usage dashboard template from Mokkup. Add in your data and export it however you like. Here’s how to do it:
1. Create or Log in to Your Mokkup Account
Start by signing up on Mokkup.ai using your email. Already have an account? Just log in, and you’re good to go.
2. Choose and Customize Your Dashboard Template
Find the energy efficiency report dashboard in the Templates section. Use the drag-and-drop editor to adjust KPIs, edit filters, or add elements based on your data.
3. Export to Your BI Tool
Once your dashboard wireframe is ready, use the BI Tool Export feature to send it directly to Power BI or Tableau for further analysis and enhancements. You can also download the dashboard as a PDF, PNG, or JPEG, embed it on a platform, or invite your team to collaborate.
Note: This is a Pro template. To use and customize this dashboard wireframe, you’ll need a Pro subscription on Mokkup. Upgrade anytime to unlock full access.
Benefits of Energy Efficiency Dashboards
The Energy Efficiency Dashboard helps organizations monitor energy use, identify inefficiencies, and boost facility performance. It simplifies power management, reduces costs, and supports sustainability goals. Here are the key benefits:
- Live Energy Tracking: Monitor production and consumption
- Cost Optimization: Spot energy waste and reduce operational expenses
- Better Maintenance: Track equipment performance and plan upkeep
- Sustainability Focus: Measure renewable use and meet ESG targets
- Facility Benchmarking: Compare efficiency across locations
Energy dashboards help turn energy data into clear actions. They’re a smart way to save costs and support a greener future.
KPIs to Track in Energy Dashboards
Energy dashboard wireframes are only as useful as the metrics they track. By focusing on the right KPIs, organizations can better understand energy usage, spot inefficiencies, and take steps to improve performance. These indicators provide the insights needed to manage resources wisely and support sustainability goals.
- Total Energy Produced (MWh): Monitors the total energy generation across all sources, currently at 1200 MWh with a +10% increase.
- Total Energy Consumed (MWh): Tracks the total energy consumption, showing 950 MWh with a +20% increase.
- Production Efficiency: Measures the overall system efficiency, currently at 85% with a stable performance.
- Equipment Downtime: Monitors system interruptions, currently at 2 hours/day with a -5% improvement.
- Energy Surplus: Tracks excess energy production, showing 250 MWh with a +12% increase.
Frequently Asked Questions
Q1. How can energy dashboards help reduce costs?
Energy dashboards help track energy consumption, identify inefficiencies, and optimize energy use, which leads to cost savings by avoiding waste and improving resource allocation.
Q2. What key metrics should I focus on in an energy dashboard?
Focus on metrics like total energy consumed, production efficiency, equipment downtime, and energy surplus to monitor performance and identify areas for improvement.