What is an Irrigation Pumping Station & Control Facility Operations Dashboard?
An Irrigation Pumping Station & Control Facility Operations Dashboard is a centralized analytics solution used to monitor the operational performance, reliability, and efficiency of irrigation pumping infrastructure. It helps irrigation authorities, water distribution utilities, and agricultural water management teams track pump utilization, runtime performance, maintenance compliance, SCADA alerts, and flow distribution across operational regions. This type of dashboard combines operational metrics, maintenance KPIs, and control facility monitoring into a single interface for faster decision-making. The dashboard supports continuous monitoring of pumping stations, pump load utilization, equipment availability, and failure incidents. Using an irrigation pumping station operations dashboard, teams can identify underperforming assets, detect operational disruptions, and optimize irrigation flow delivery. An irrigation control facility operational analytics dashboard also improves visibility into SCADA communication issues, downtime trends, and preventive maintenance activities to reduce operational risk and improve water delivery reliability.
How to Create an Irrigation Pumping Station & Control Facility Operations Dashboard
You don’t need to build your report from scratch; just start with a ready-to-use dashboard template from Mokkup. Add in your data and export it however you like. Here’s how to do it:
1. Create or Log in to Your Mokkup Account
Start by signing up on Mokkup.ai using your email. If you already have an account, just log in, and you’ll be good to go.
2. Choose and Customize Your Dashboard Template
Find the Irrigation Pumping Station & Control Facility Operations Dashboard template in the Templates section. Use the drag-and-drop editor to adjust KPIs, edit filters, or add elements based on your data.
3. Export to Your BI Tool
Once your dashboard wireframe is ready, use the BI Tool Export feature to send it directly to Power BI or Tableau for further analysis and enhancements. You can also download the dashboard as a PDF, PNG, or JPEG, embed it on a platform, or invite your team to collaborate.
Note: This is a Pro template. You’ll need a Pro subscription on Mokkup to use and customize this dashboard wireframe. Upgrade anytime to unlock full access.
Irrigation Pumping Station & Control Facility Operations Dashboard Example
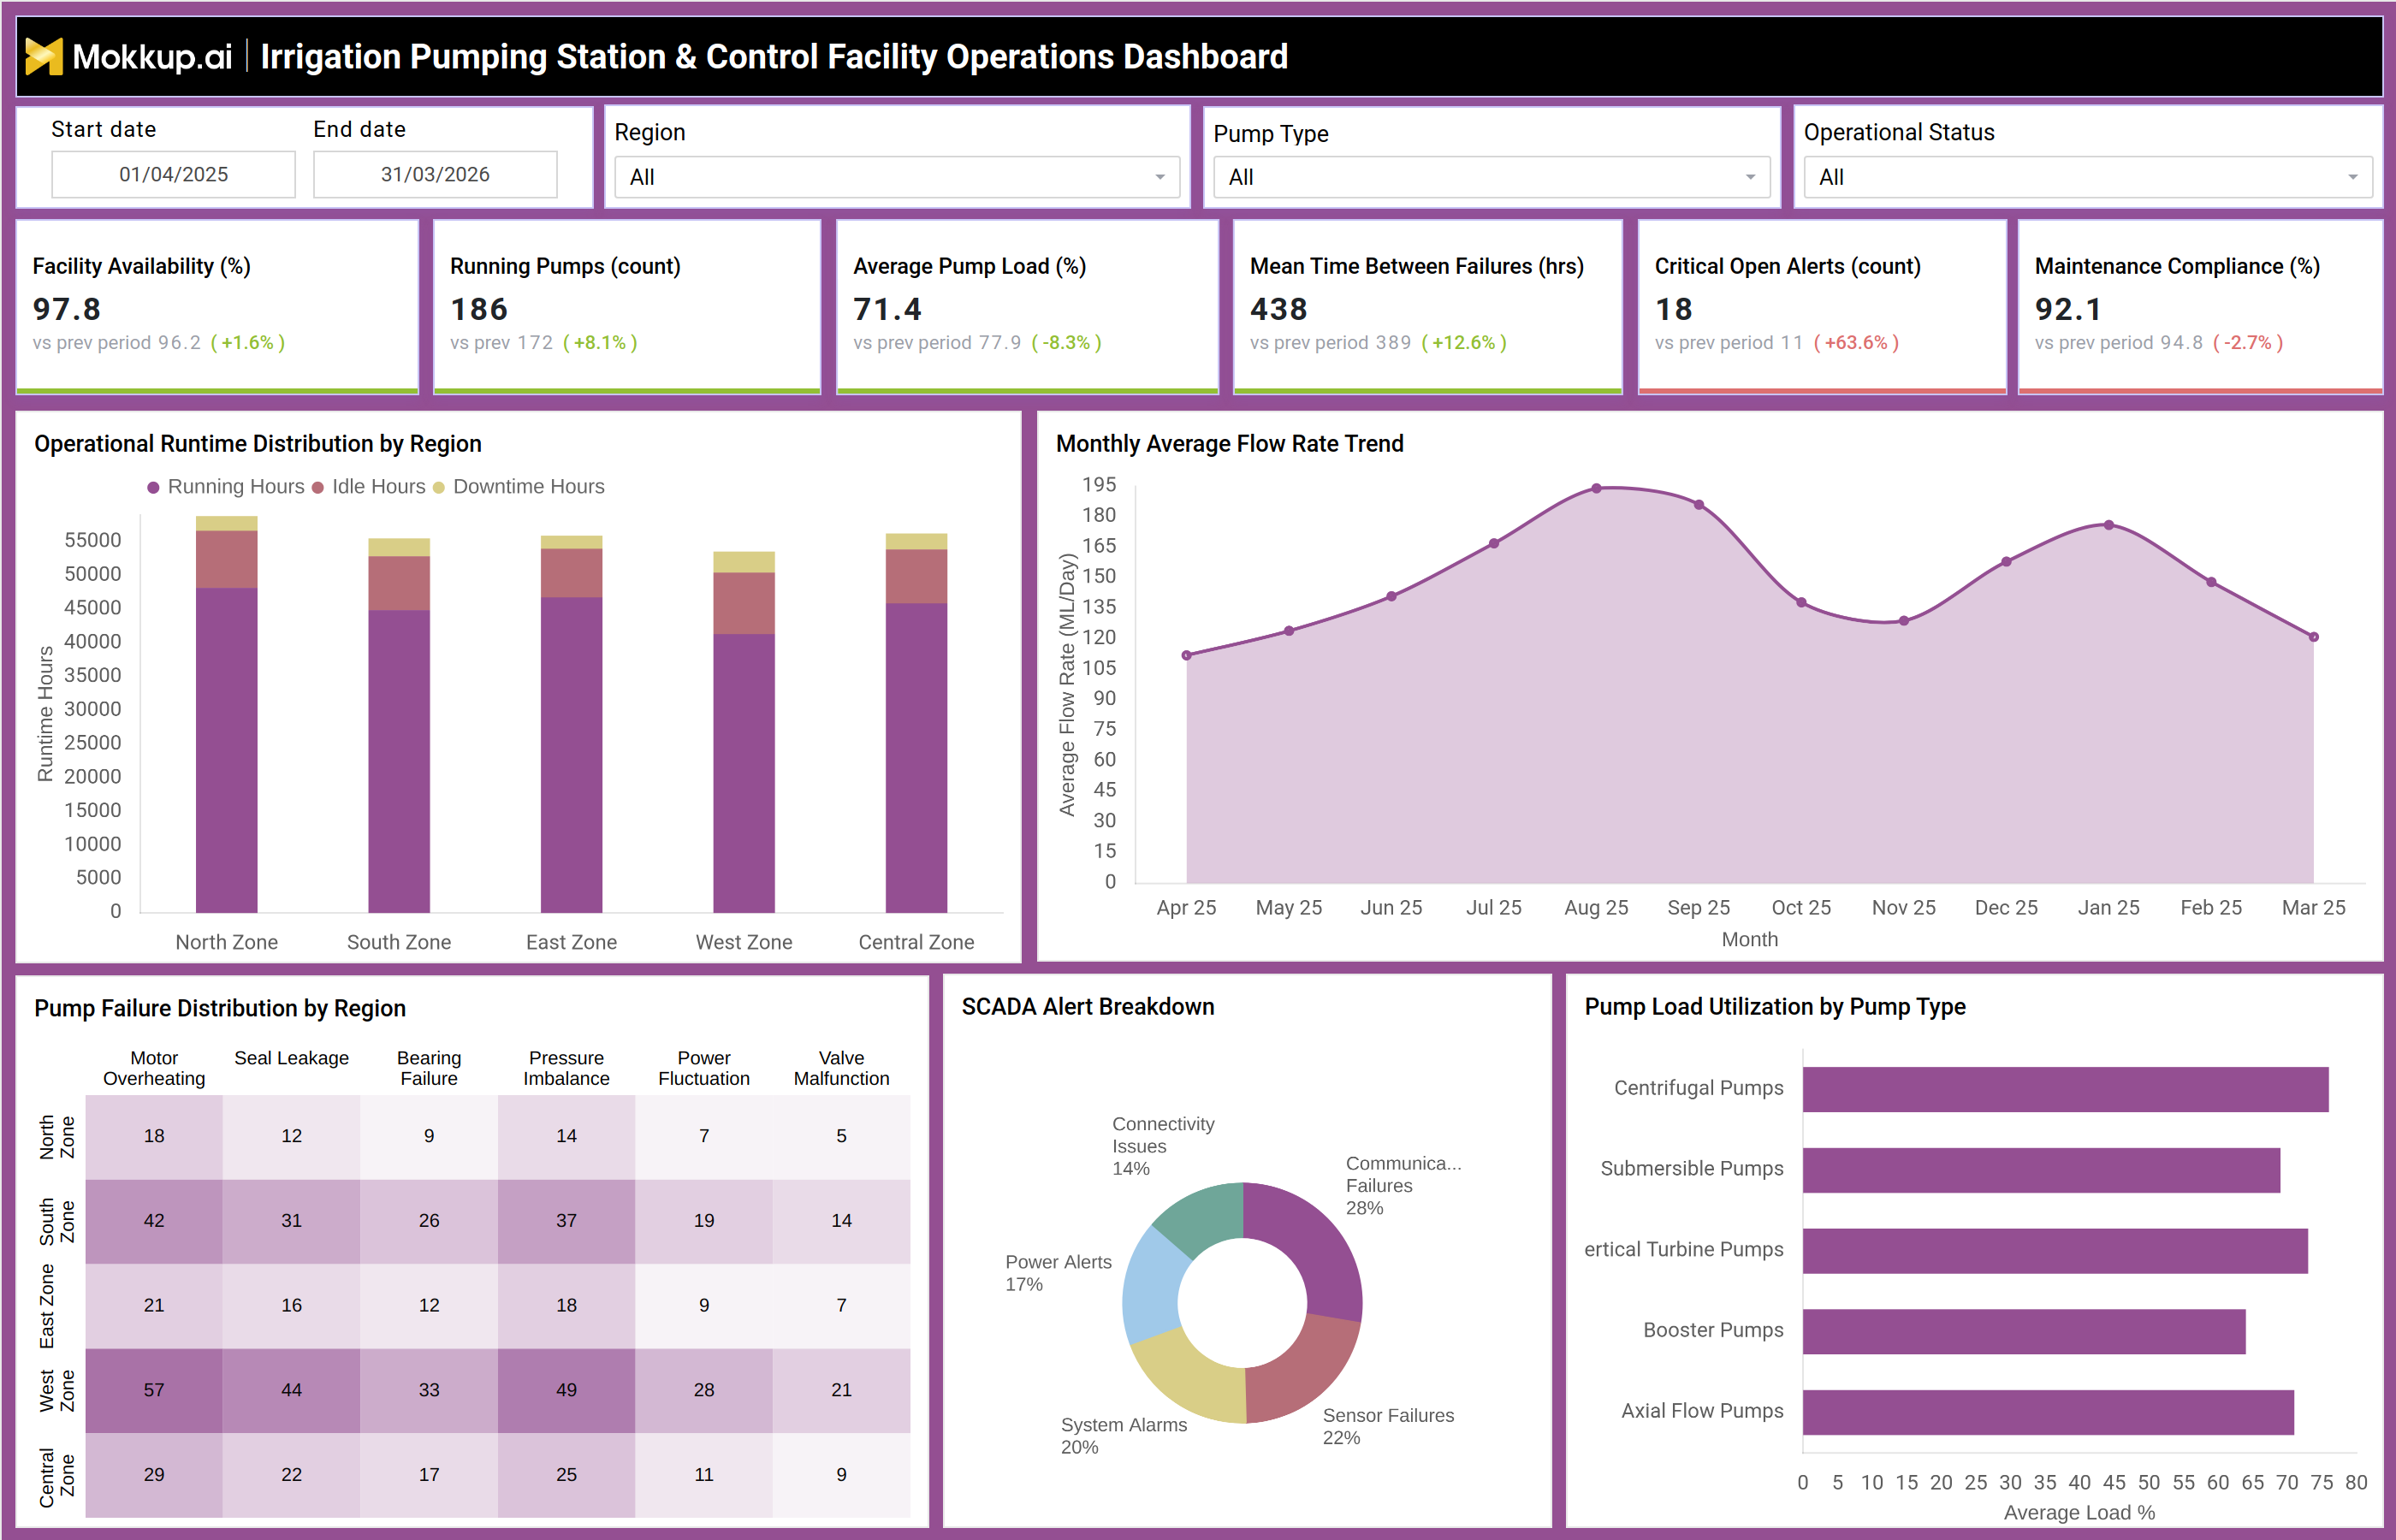
A regional irrigation authority managing multiple pumping stations across agricultural zones can use this irrigation pumping station performance monitoring dashboard to monitor operational conditions. The dashboard may display KPIs such as Facility Availability, Running Pumps Count, Average Pump Load, Mean Time Between Failures, Critical Open Alerts, and Maintenance Compliance. Operations teams can analyze runtime distribution across North, South, East, West, and Central zones to identify areas with high idle hours or downtime.
A pump failure heatmap helps maintenance teams understand the most frequent failure causes, including motor overheating, seal leakage, pressure imbalance, and valve malfunction. The irrigation pump station efficiency KPI dashboard also tracks average flow rate trends and pump utilization by pump type, helping engineers optimize energy usage and operational efficiency. Additionally, the water distribution pumping station monitoring dashboard enables teams to monitor SCADA alert categories such as communication failures, sensor failures, and power alerts. This improves response times and supports proactive maintenance planning across irrigation infrastructure networks.
How to Analyze Data in Irrigation Pumping Station & Control Facility Operations Dashboard
Here is how you can analyze data from this dashboard:
- Monitor Facility Availability (%) to evaluate operational readiness of irrigation pumping stations.
- Analyze Running Pumps Count to understand the current operational load across irrigation zones.
- Track Average Pump Load (%) to identify overloaded or underutilized pump assets.
- Review Mean Time Between Failures (MTBF) to evaluate reliability performance of pumping infrastructure.
- Monitor Critical Open Alerts to identify unresolved operational or SCADA-related issues.
- Compare Maintenance Compliance (%) against planned schedules to ensure preventive maintenance execution.
- Analyze Operational Runtime Distribution by Region to identify downtime-heavy zones.
- Review Monthly Average Flow Rate Trend to monitor seasonal irrigation demand changes.
- Use Pump Failure Distribution heatmaps to identify recurring mechanical and electrical failures.
- Track SCADA Alert Breakdown to understand communication, connectivity, and sensor-related risks.
- Analyze Pump Load Utilization by Pump Type to optimize operational efficiency across centrifugal, booster, and turbine pumps.
- Compare regional operational performance to prioritize maintenance and modernization activities.
Benefits of Irrigation Pumping Station & Control Facility Operations Dashboard
The following are the benefits of using such Irrigation pump and control facility performance dashboard:
- Improves visibility into irrigation pumping infrastructure performance.
- Helps reduce operational downtime through proactive monitoring.
- Supports preventive maintenance planning and execution.
- Improves irrigation water distribution reliability across regions.
- Enables faster response to SCADA system alerts and failures.
- Helps optimize pump load utilization and energy efficiency.
- Reduces maintenance costs by identifying recurring failure patterns.
- Supports operational benchmarking across irrigation zones.
- Improves decision-making using centralized operational analytics.
- Enhances water delivery continuity during peak irrigation demand periods.
- Helps engineering teams identify critical operational bottlenecks.
- Supports long-term irrigation infrastructure performance management.
KPIs to Track in Irrigation Pumping Station & Control Facility Operations Dashboard
The following key KPIs can be tracked by using this dashboard:
- Facility Availability (%): Measures operational readiness of irrigation pumping facilities.
- Running Pumps (count): Tracks the number of actively operating pumps.
- Average Pump Load (%): Measures average operational load across pumping systems.
- Mean Time Between Failures (hrs): Tracks average operational time between equipment failures.
- Critical Open Alerts (count): Measures unresolved operational and SCADA alerts.
- Maintenance Compliance (%): Tracks completion of planned maintenance activities.
Frequently Asked Questions
1. Why is an irrigation pumping station operations dashboard important?
It helps utilities and irrigation authorities monitor pump reliability, operational efficiency, maintenance performance, and flow delivery across irrigation networks.
2. What data is commonly tracked in this dashboard?
The dashboard tracks facility availability, pump runtime, maintenance compliance, SCADA alerts, flow rate trends, downtime, and equipment failure patterns.
3. How does this dashboard improve irrigation operations?
It provides operational visibility, helps reduce downtime, improves maintenance planning, and supports efficient water distribution management.