
What is an Irrigation and Water Distribution Utilities Pipes, Valves & Equipment Supply Chain Dashboard?
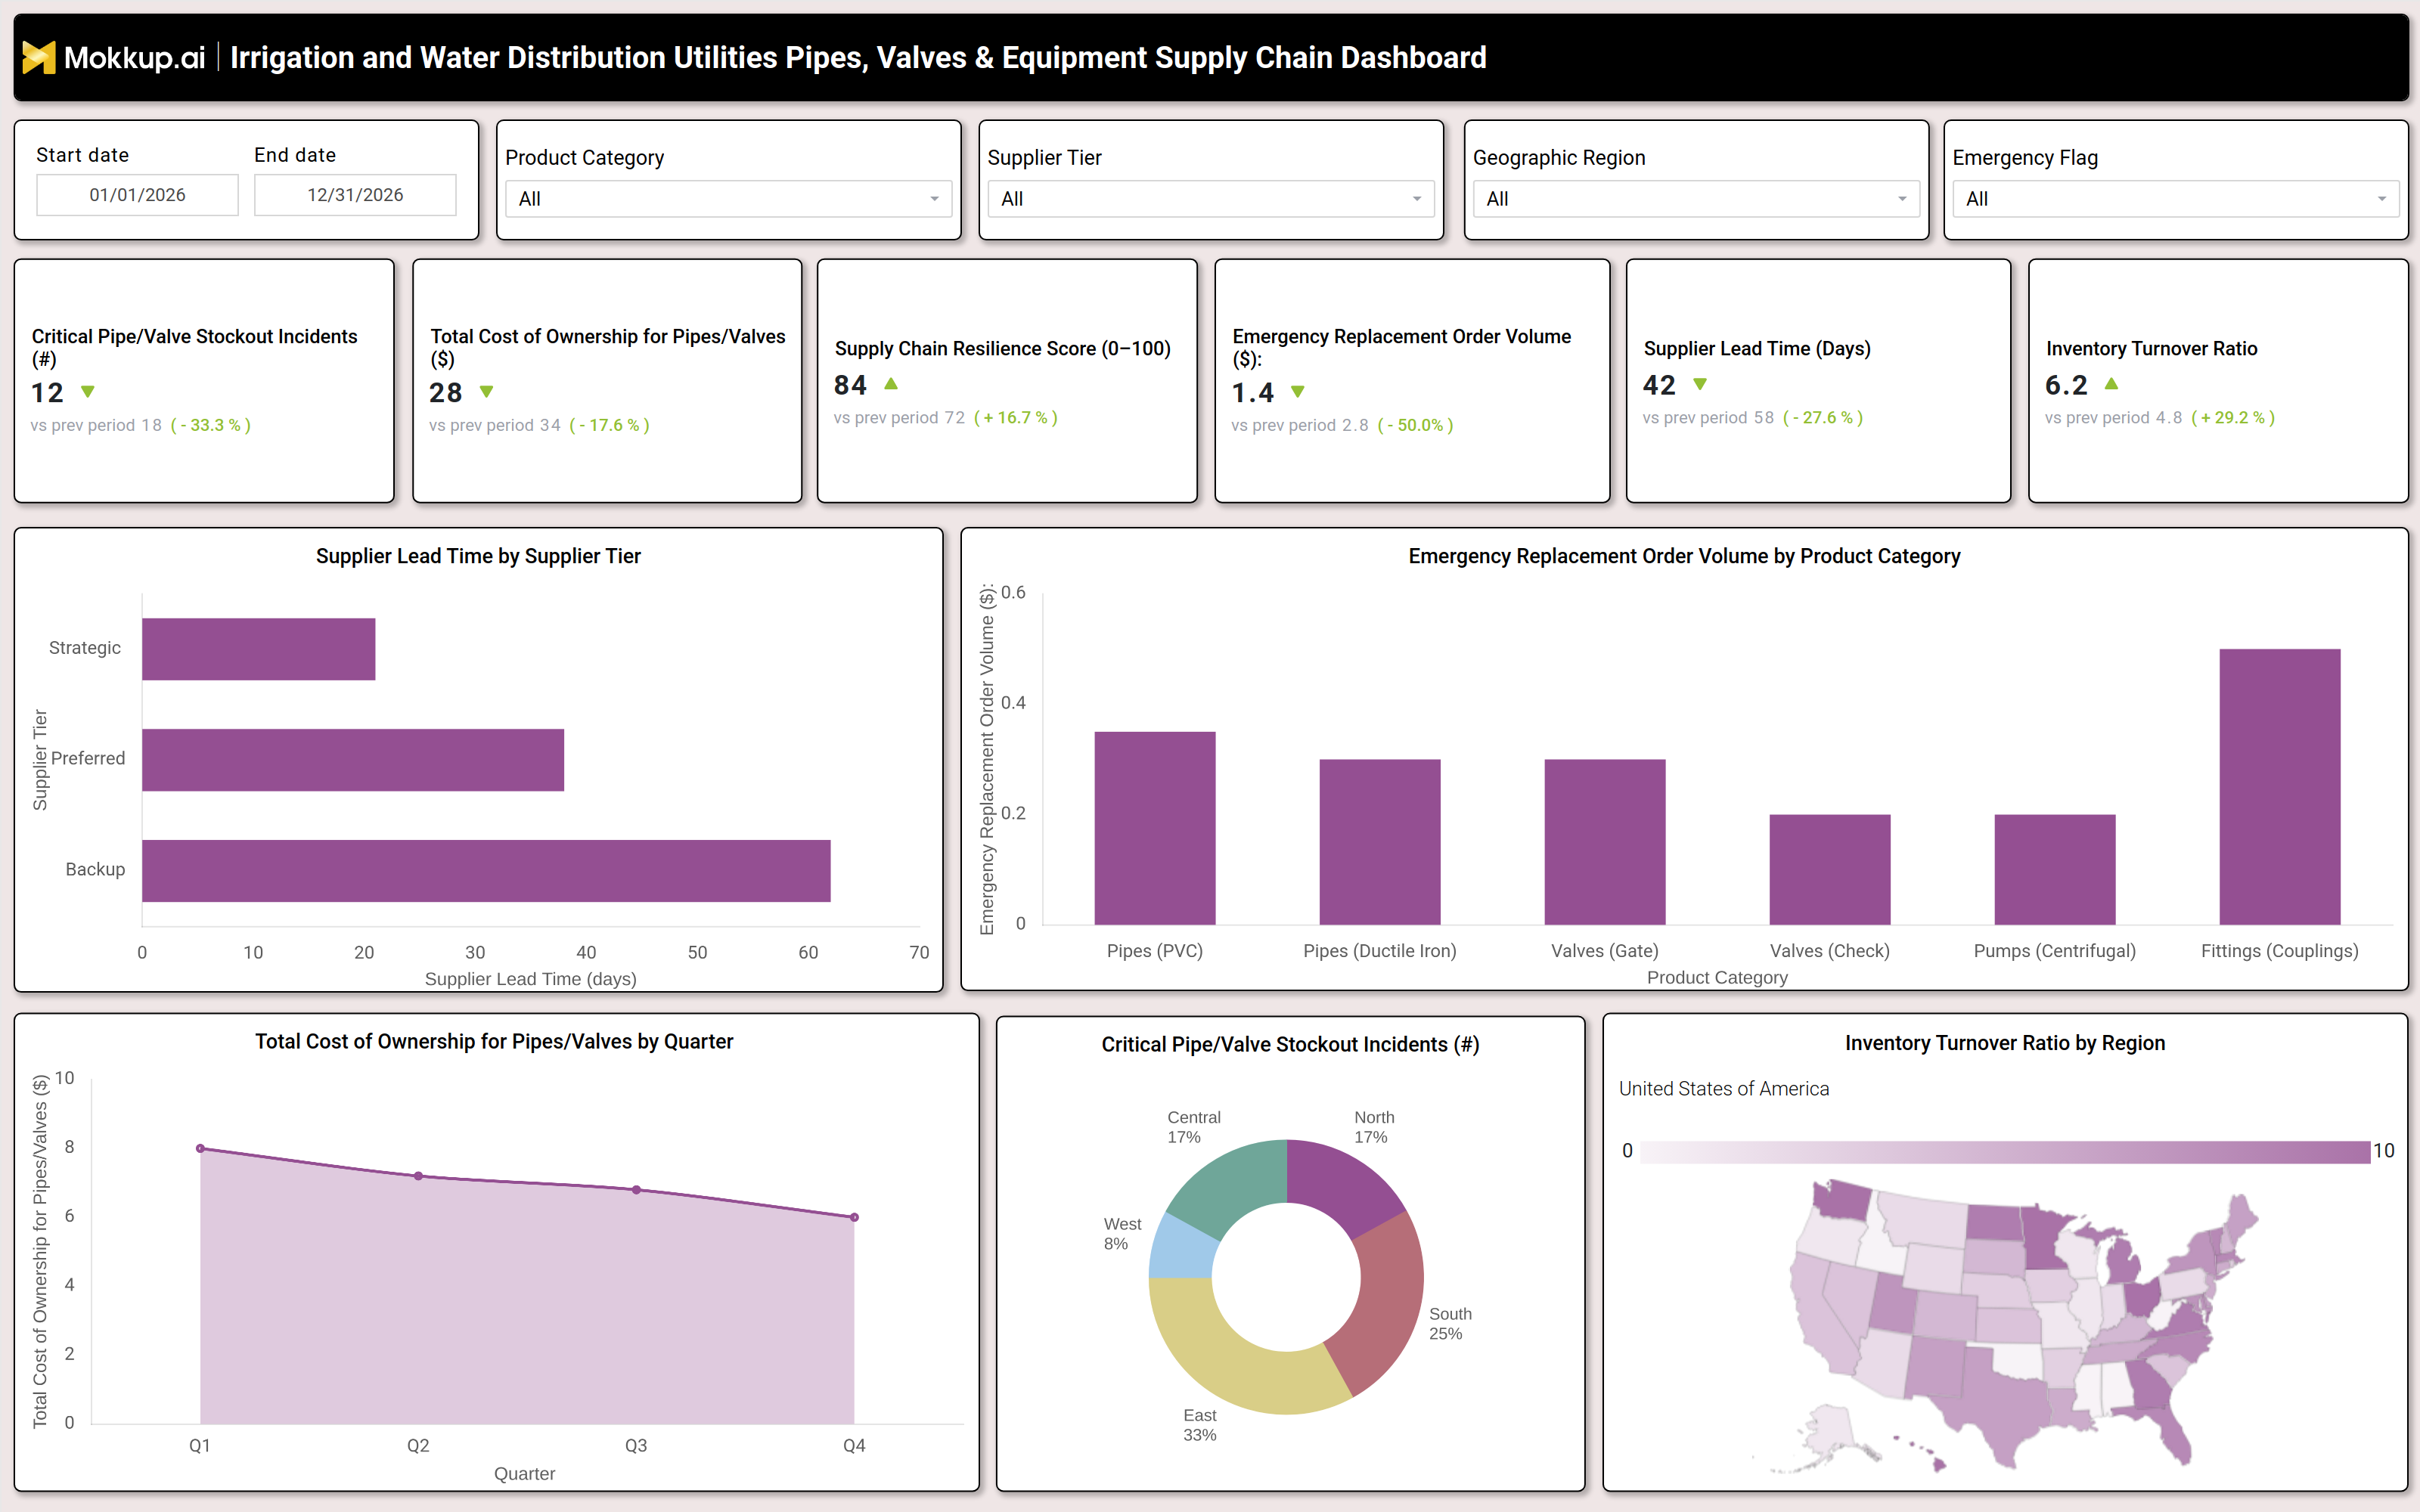
The Irrigation and Water Distribution Utilities Pipes, Valves & Equipment Supply Chain Dashboard is a purpose-built analytics tool for procurement and operations teams managing water distribution supply chain management across regional networks. It centralizes tracking of critical stockout incidents water infrastructure teams face, alongside supplier lead times, total cost of ownership pipes, valves, and supply network resilience, giving leaders a single view of supply health. The dashboard monitors performance across product categories, including PVC and ductile iron pipes, gate and check valves, centrifugal pumps, and couplings, enabling teams to align procurement strategy with service continuity goals. Water utilities, irrigation districts, and infrastructure planners rely on it to reduce emergency procurement, improve supplier performance, and sustain uninterrupted field operations.
How to Create an Irrigation and Water Distribution Utilities Pipes, Valves & Equipment Supply Chain Dashboard
You don’t need to build your report from scratch, just start with a ready-to-use dashboard template from Mokkup. Add in your data and export it however you like. Here’s how to do it:
1. Create or Log in to Your Mokkup Account
Start by signing up on Mokkup.ai using your email. If you already have an account, just log in, and you'll be good to go.
2. Choose and Customize Your Dashboard Template
Find the Irrigation and Water Distribution Utilities Pipes, Valves & Equipment Supply Chain Dashboard template in the Templates section. Use the drag and drop editor to adjust KPIs, edit filters, or add elements based on your data.
3. Export to Your BI Tool
Once your dashboard wireframe is ready, use the BI Tool Export feature to send it directly to Power BI or Tableau for further analysis and enhancements. You can also download the dashboard as a PDF, PNG, or JPEG, embed it on a platform, or invite your team to collaborate.
Note: This is a Pro template. You'll need a Pro subscription on Mokkup to use and customize this dashboard wireframe. Upgrade anytime to unlock full access.
Irrigation and Water Distribution Utilities Pipes, Valves & Equipment Supply Chain Dashboard Example
A procurement manager at a water utility opens this dashboard at the start of a planning cycle to evaluate how well the water supply network has performed over the selected period. The overview immediately surfaces whether pipe and valve inventory tracking is under control, highlighting whether stockout incidents have increased compared to the previous period and whether overall supply resilience has improved. If the resilience score has declined, the team investigates which supplier tier or product category is creating the most exposure before the next procurement cycle begins. This opening scan replaces hours of manual report compilation with a single structured view that aligns procurement, operations, and leadership around the same performance picture.
The lead time analysis helps procurement teams determine whether strategic or backup suppliers are meeting acceptable delivery windows. If backup suppliers are showing significantly longer lead times than preferred or strategic partners, planners can accelerate negotiations or increase safety stock thresholds for high-risk categories like valves and fittings. This view also helps teams evaluate whether current supplier tier classifications are aligned with actual delivery performance or whether reclassification is needed to protect supply continuity during high-demand periods. Supply chain managers use the regional stockout breakdown to identify which geographic areas are most vulnerable to supply shortfalls.
How to Analyze Data in an Irrigation and Water Distribution Utilities Pipes, Valves & Equipment Supply Chain Dashboard
Here is how you can analyze data from this dashboard:
- Use the Emergency Flag filter to isolate procurement events triggered by emergency conditions and assess their frequency and cost impact across product categories.
- Review Critical Pipe/Valve Stockout Incidents to determine which regions are experiencing the most supply shortfalls and where inventory replenishment should be prioritized.
- Monitor the Supplier Lead Time by Supplier Tier chart to detect which supplier tier is causing the longest delivery delays before they disrupt field operations.
- Analyze the Emergency Replacement Order Volume by Product Category chart to identify which product lines generate the most unplanned procurement activity and where irrigation equipment supplier lead time pressure is highest.
- Compare the Inventory Turnover Ratio by Region map to find geographic areas with the lowest stock rotation and target them for replenishment strategy adjustments.
- Investigate the Critical Pipe/Valve Stockout Incidents donut chart to identify which geographic regions contribute the most to overall stockout risk across the network.
- Filter by Product Category to align procurement monitoring with specific material types such as PVC pipes, gate valves, or centrifugal pumps.
- Track Total Cost of Ownership for Pipes/Valves by Quarter over time to measure progress in reducing total cost of ownership pipes valves and identify quarters where cost control efforts have been most effective.
Benefits of a Irrigation and Water Distribution Utilities Pipes, Valves & Equipment Supply Chain Dashboard
The following are the benefits of using this dashboard:
- Centralizes stockout incidents, supplier lead times, and cost metrics across product categories and supplier tiers in one structured template.
- Supports pipe and valve inventory tracking across all supplier tiers and geographic regions with prebuilt KPI tiles and visualizations.
- Reduces manual data compilation for procurement reporting with prebuilt KPI tiles and chart layouts covering pipes, valves, pumps, and fittings.
- Enables region level analysis of supply chain resilience score water utilities teams depend on to guide strategic sourcing and inventory positioning decisions.
- Provides a quarterly line chart breakdown of total cost of ownership for operational efficiency planning across procurement cycles.
- Helps procurement managers align with service continuity standards without rebuilding supply chain reports from scratch.
- Gives operations leadership and field procurement teams a shared view of supply risk, emergency order trends, and inventory health.
KPIs to Track in a Irrigation and Water Distribution Utilities Pipes, Valves & Equipment Supply Chain Dashboard
The following key KPIs can be tracked by using this dashboard:
- Supply Chain Resilience Score (0–100): A composite measure of supply reliability in water distribution supply chain management evaluating how well the network can absorb disruptions and sustain material availability across all product tiers.
- Critical Pipe/Valve Stockout Incidents (#): Tracks the number of critical stockout incidents water infrastructure teams face key to prioritizing emergency procurement and preventing unplanned service interruptions.
- Total Cost of Ownership for Pipes/Valves ($): Quantifies the full procurement and lifecycle cost across pipe and valve categories enabling cost control analysis across supplier relationships and purchase volumes.
- Emergency Replacement Order Volume ($): Measures unplanned procurement spend triggered by emergency replacements directly tied to irrigation equipment supplier lead time gaps and supply planning effectiveness.
- Supplier Lead Time (Days): Evaluates delivery performance across Strategic, Preferred, and Backup supplier tiers against accepted timelines supporting timely material replenishment workflows.
- Inventory Turnover Ratio: Tracks how efficiently pipe and valve inventory is cycled across geographic regions including East, West, North, South, and Central, surfacing areas where stock is moving too slowly.
Frequently Asked Questions
1. What teams use an Irrigation and Water Distribution Utilities Pipes, Valves & Equipment Supply Chain Dashboard?
Procurement teams, supply chain managers, operations planners, and infrastructure maintenance teams responsible for water utility service continuity typically rely on this dashboard.
2. How does this dashboard improve procurement performance for water utilities?
By surfacing supplier lead time trends across Strategic, Preferred, and Backup tiers and highlighting which product categories drive the highest emergency order volumes, teams can renegotiate contracts and preposition inventory before outages occur.
3. Can this dashboard track emergency procurement activity by product category?
Yes the Emergency Replacement Order Volume by Product Category chart breaks down unplanned spend across pipes, valves, pumps, and fittings, enabling teams to identify which materials most frequently trigger emergency orders.