What is an Electric Power Transmission Infrastructure Health Monitor Dashboard
An Electric Power Transmission Infrastructure Health Monitor Dashboard is a centralized analytics solution designed for electric power utilities and Transmission System Operators (TSOs) to monitor the health, reliability, and risk profile of transmission assets. It functions as an electric grid transmission asset health monitoring dashboard, consolidating operational, maintenance, inspection, and performance data into measurable KPIs.
This dashboard wireframe provides visibility into high-voltage transmission lines, substations, transformers, circuit breakers, and voltage regulators. It enables utilities to measure asset condition, track Mean Time Between Failures (MTBF), monitor Mean Time To Repair (MTTR), and assess asset criticality. As an electric transmission network health index dashboard, it assigns a composite health score to assets and infrastructure portfolios. The dashboard also acts as an electric power transmission asset reliability dashboard, supporting preventive maintenance, risk assessment, and lifecycle planning. For TSOs, it extends into a TSO capital planning and infrastructure health dashboard, helping prioritize CapEx allocation based on asset degradation and failure risk.
How to Create an Electric Power Transmission Infrastructure Health Monitor Dashboard
You don’t need to build your report from scratch, just start with a ready-to-use Electric Power Transmission Infrastructure Health Monitor dashboard template from Mokkup. Add in your data and export it however you like. Here’s how to do it:
1. Create or Log in to Your Mokkup Account
Start by signing up on Mokkup.ai using your email. If you already have an account, just log in, and you’ll be good to go.
2. Choose and Customize Your Dashboard Template
Find the Electric Power Transmission Infrastructure Health Monitor Dashboard template in the Templates section. Use the drag-and-drop editor to adjust KPIs, edit filters, or add elements based on your data.
3. Export to Your BI Tool
Once your dashboard wireframe is ready, use the BI Tool Export feature to send it directly to Power BI or Tableau for further analysis and enhancements. You can also download the dashboard as a PDF, PNG, or JPEG, embed it on a platform, or invite your team to collaborate.
Note: This is a Pro template. You’ll need a Pro subscription on Mokkup to use and customize this dashboard wireframe. Upgrade anytime to unlock full access.
Electric Power Transmission Infrastructure Health Monitor Dashboard Example
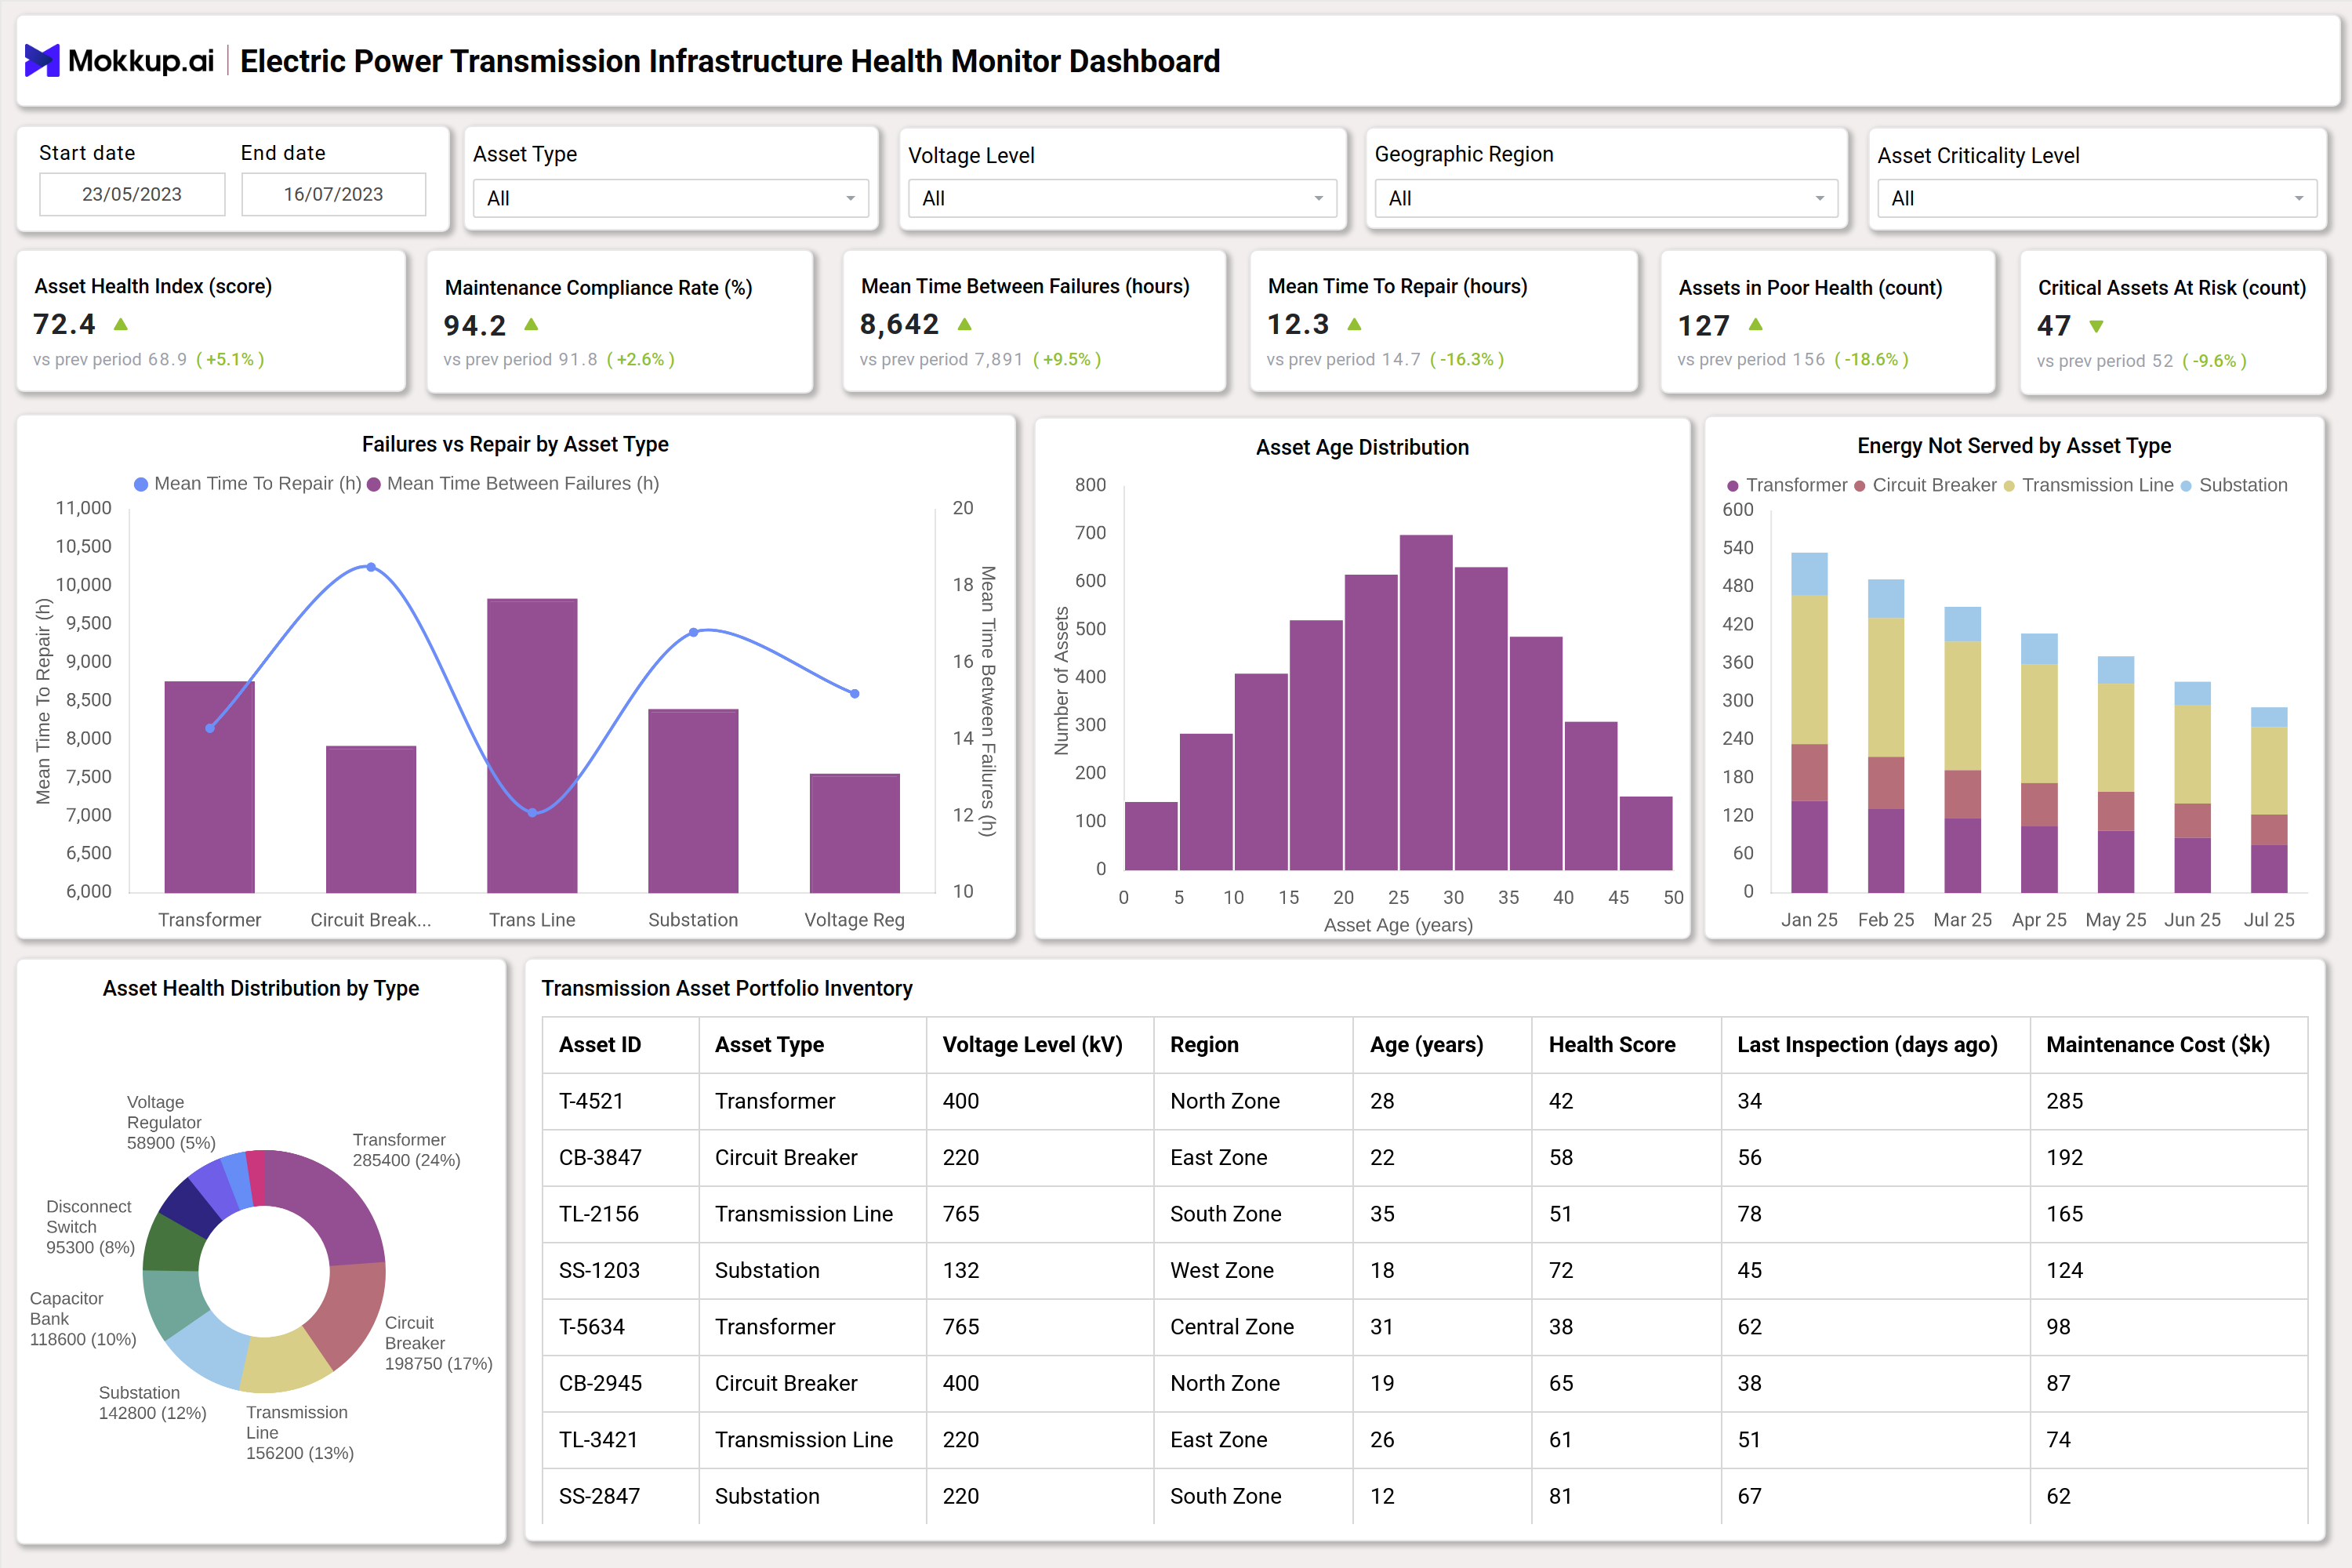
The dashboard example demonstrates a structured layout built for transmission operators. At the top level, filters allow users to analyze data by asset type, voltage level (132 kV, 220 kV, 400 kV, 765 kV), geographic region, asset criticality, and date range. The dashboard visualizes failures versus repair time by asset type, allowing operators to compare transformer, transmission line, circuit breaker, and substation performance. The asset age distribution chart identifies aging infrastructure clusters, critical for lifecycle planning.
Energy Not Served (ENS) by asset type shows the operational impact of failures. The asset health distribution donut visual highlights portfolio-level health segmentation. A detailed transmission asset inventory table provides asset-level insights including voltage rating, age, health score, last inspection, and maintenance cost. This structure makes the solution both a utility transmission asset performance management dashboard and a power grid infrastructure reliability KPI reporting dashboard, enabling executives and operations teams to act on data.
How to Analyze Data in an Electric Power Transmission Infrastructure Health Monitor Dashboard
Here is how you can analyze data from this dashboard:
- Overall Network Health: Review the Asset Health Index to understand the overall condition of the transmission network.
- Reliability Gap Analysis: Compare MTBF and MTTR trends to identify reliability gaps and repair efficiency issues.
- Failure Frequency Monitoring: Analyze asset types with high failure frequency to detect recurring or systemic problems.
- Voltage & Region Health Review: Evaluate assets in poor health segmented by voltage level and region to identify vulnerable areas.
- Maintenance Effectiveness Check: Cross-check maintenance compliance against asset degradation rates to validate maintenance strategies.
- Aging Asset Identification: Identify assets older than 25–30 years to support replacement and upgrade planning.
- Reliability Impact Assessment: Monitor Energy Not Served (ENS) to understand the financial and operational impact of outages.
- Critical Asset Prioritization: Prioritize assets with low health scores and high operational importance for immediate action.
- Inspection Delay Analysis: Track inspection delays and correlate them with rising failure risks.
- Regional Performance Comparison: Use region level filters to compare infrastructure health and performance across zones.
Benefits of an Electric Power Transmission Infrastructure Health Monitor Dashboard
The following are the benefits of using this dashboard:
- Improved Grid Reliability: Strengthens network stability through continuous asset health monitoring.
- Data Driven Maintenance: Enables better scheduling using asset performance and reliability insights.
- Reduced Unplanned Outages: Helps prevent transmission disruptions through early risk detection.
- Predictive Maintenance Support: Facilitates proactive maintenance strategies based on asset condition data.
- High Risk Asset Identification: Highlights vulnerable transmission lines and substations requiring attention.
- Regulatory Reporting Support: Simplifies compliance through structured asset and reliability KPIs.
- Capital Investment Alignment: Helps prioritize infrastructure upgrades based on asset health indicators.
- Maintenance Cost Optimization: Improves allocation of maintenance budgets and resources.
- Executive Transparency: Provides leadership with clear infrastructure performance insights.
- Long Term Grid Resilience: Strengthens future grid stability through informed asset lifecycle management.
KPIs to Track in Electric Power Transmission Infrastructure Health Monitor Dashboard
The following key KPIs can be tracked by using this dashboard:
- Asset Health Index (Composite Score): Measures overall condition of transmission infrastructure
- Mean Time Between Failures (MTBF): Indicates reliability of transmission assets
- Mean Time To Repair (MTTR): Measures maintenance efficiency
- Maintenance Compliance Rate (%): Tracks adherence to preventive maintenance schedules
- Assets in Poor Health (Count): Identifies assets below acceptable condition thresholds
- Critical Assets at Risk: Highlights high-impact assets requiring immediate attention
- Energy Not Served (ENS): Quantifies outage impact on supply reliability
- Asset Age Distribution: Supports lifecycle and replacement planning
- Maintenance Cost per Asset: Evaluates cost efficiency
- Failure Rate by Asset Type: Detects asset category risk concentration
Frequently Asked Questions
Q1. What is the purpose of a transmission infrastructure health dashboard?
It provides real-time visibility into transmission asset condition, reliability metrics, and failure risks to support operational and strategic decisions.
Q2. Who uses an Electric Power Transmission Infrastructure Health Monitor Dashboard?
Transmission System Operators (TSOs), grid operations managers, maintenance teams, reliability engineers, and utility executives.
Q3. How does the dashboard help reduce transmission failures?
By identifying declining asset health, tracking MTBF and MTTR trends, and highlighting high-risk infrastructure before failure occurs.
Q4. Can this dashboard support capital planning?
Yes. It functions as a TSO capital planning and infrastructure health dashboard, enabling investment prioritization based on asset risk and lifecycle stage.
Q5. What data sources integrate into this dashboard?
SCADA systems, asset management systems (AMS), maintenance logs, inspection reports, outage records, and financial systems.
Q6. How does it improve regulatory compliance?
It standardizes reliability KPIs and ensures accurate performance reporting aligned with regulatory requirements.