
What Is an Irrigation and Water Distribution Utilities Revenue, Billing & Distribution Cost Dashboard?
An Irrigation and Water Distribution Utilities Revenue, Billing & Distribution Cost Dashboard is a data-driven analytics tool designed to help water utilities monitor financial performance, billing efficiency, and operational expenses. This dashboard consolidates key metrics, including total billed revenue, non-revenue water losses, distribution costs, customer arrears, and revenue recovery rates, into a single, interactive interface. By tracking these metrics, utilities can identify inefficiencies in billing processes, reduce water losses, optimize distribution expenses, and improve revenue collection. Unlike traditional spreadsheets, this dashboard provides visual trend analysis, service zone comparisons, and customer segment breakdowns, enabling utility managers to make data-backed decisions. Whether for municipal water systems, agricultural irrigation networks, or wastewater utilities, this dashboard ensures financial transparency and operational cost control.
How to Create an Irrigation and Water Distribution Utilities Revenue, Billing & Distribution Cost Dashboard
You don't need to build your report from scratch, just start with a ready-to-use dashboard template from Mokkup. Add in your data and export it however you like. Here's how to do it:
1. Create or Log in to Your Mokkup Account
Start by signing up on Mokkup.ai using your email. If you already have an account, just log in, and you'll be good to go.
2. Choose and Customize Your Dashboard Template
Find the Irrigation and Water Distribution Utilities Revenue, Billing & Distribution Cost Dashboard template in the Templates section. Use the drag-and-drop editor to adjust KPIs, edit filters, or add elements based on your data.
3. Export to Your BI Tool
Once your dashboard wireframe is ready, use the BI Tool Export feature to send it directly to Power BI or Tableau for further analysis and enhancements. You can also download the dashboard as a PDF, PNG, or JPEG, embed it on a platform, or invite your team to collaborate.
Note: This is a Pro template. You'll need a Pro subscription on Mokkup to use and customize this dashboard wireframe. Upgrade anytime to unlock full access.
Irrigation and Water Distribution Utilities Revenue, Billing & Distribution Cost Dashboard Example
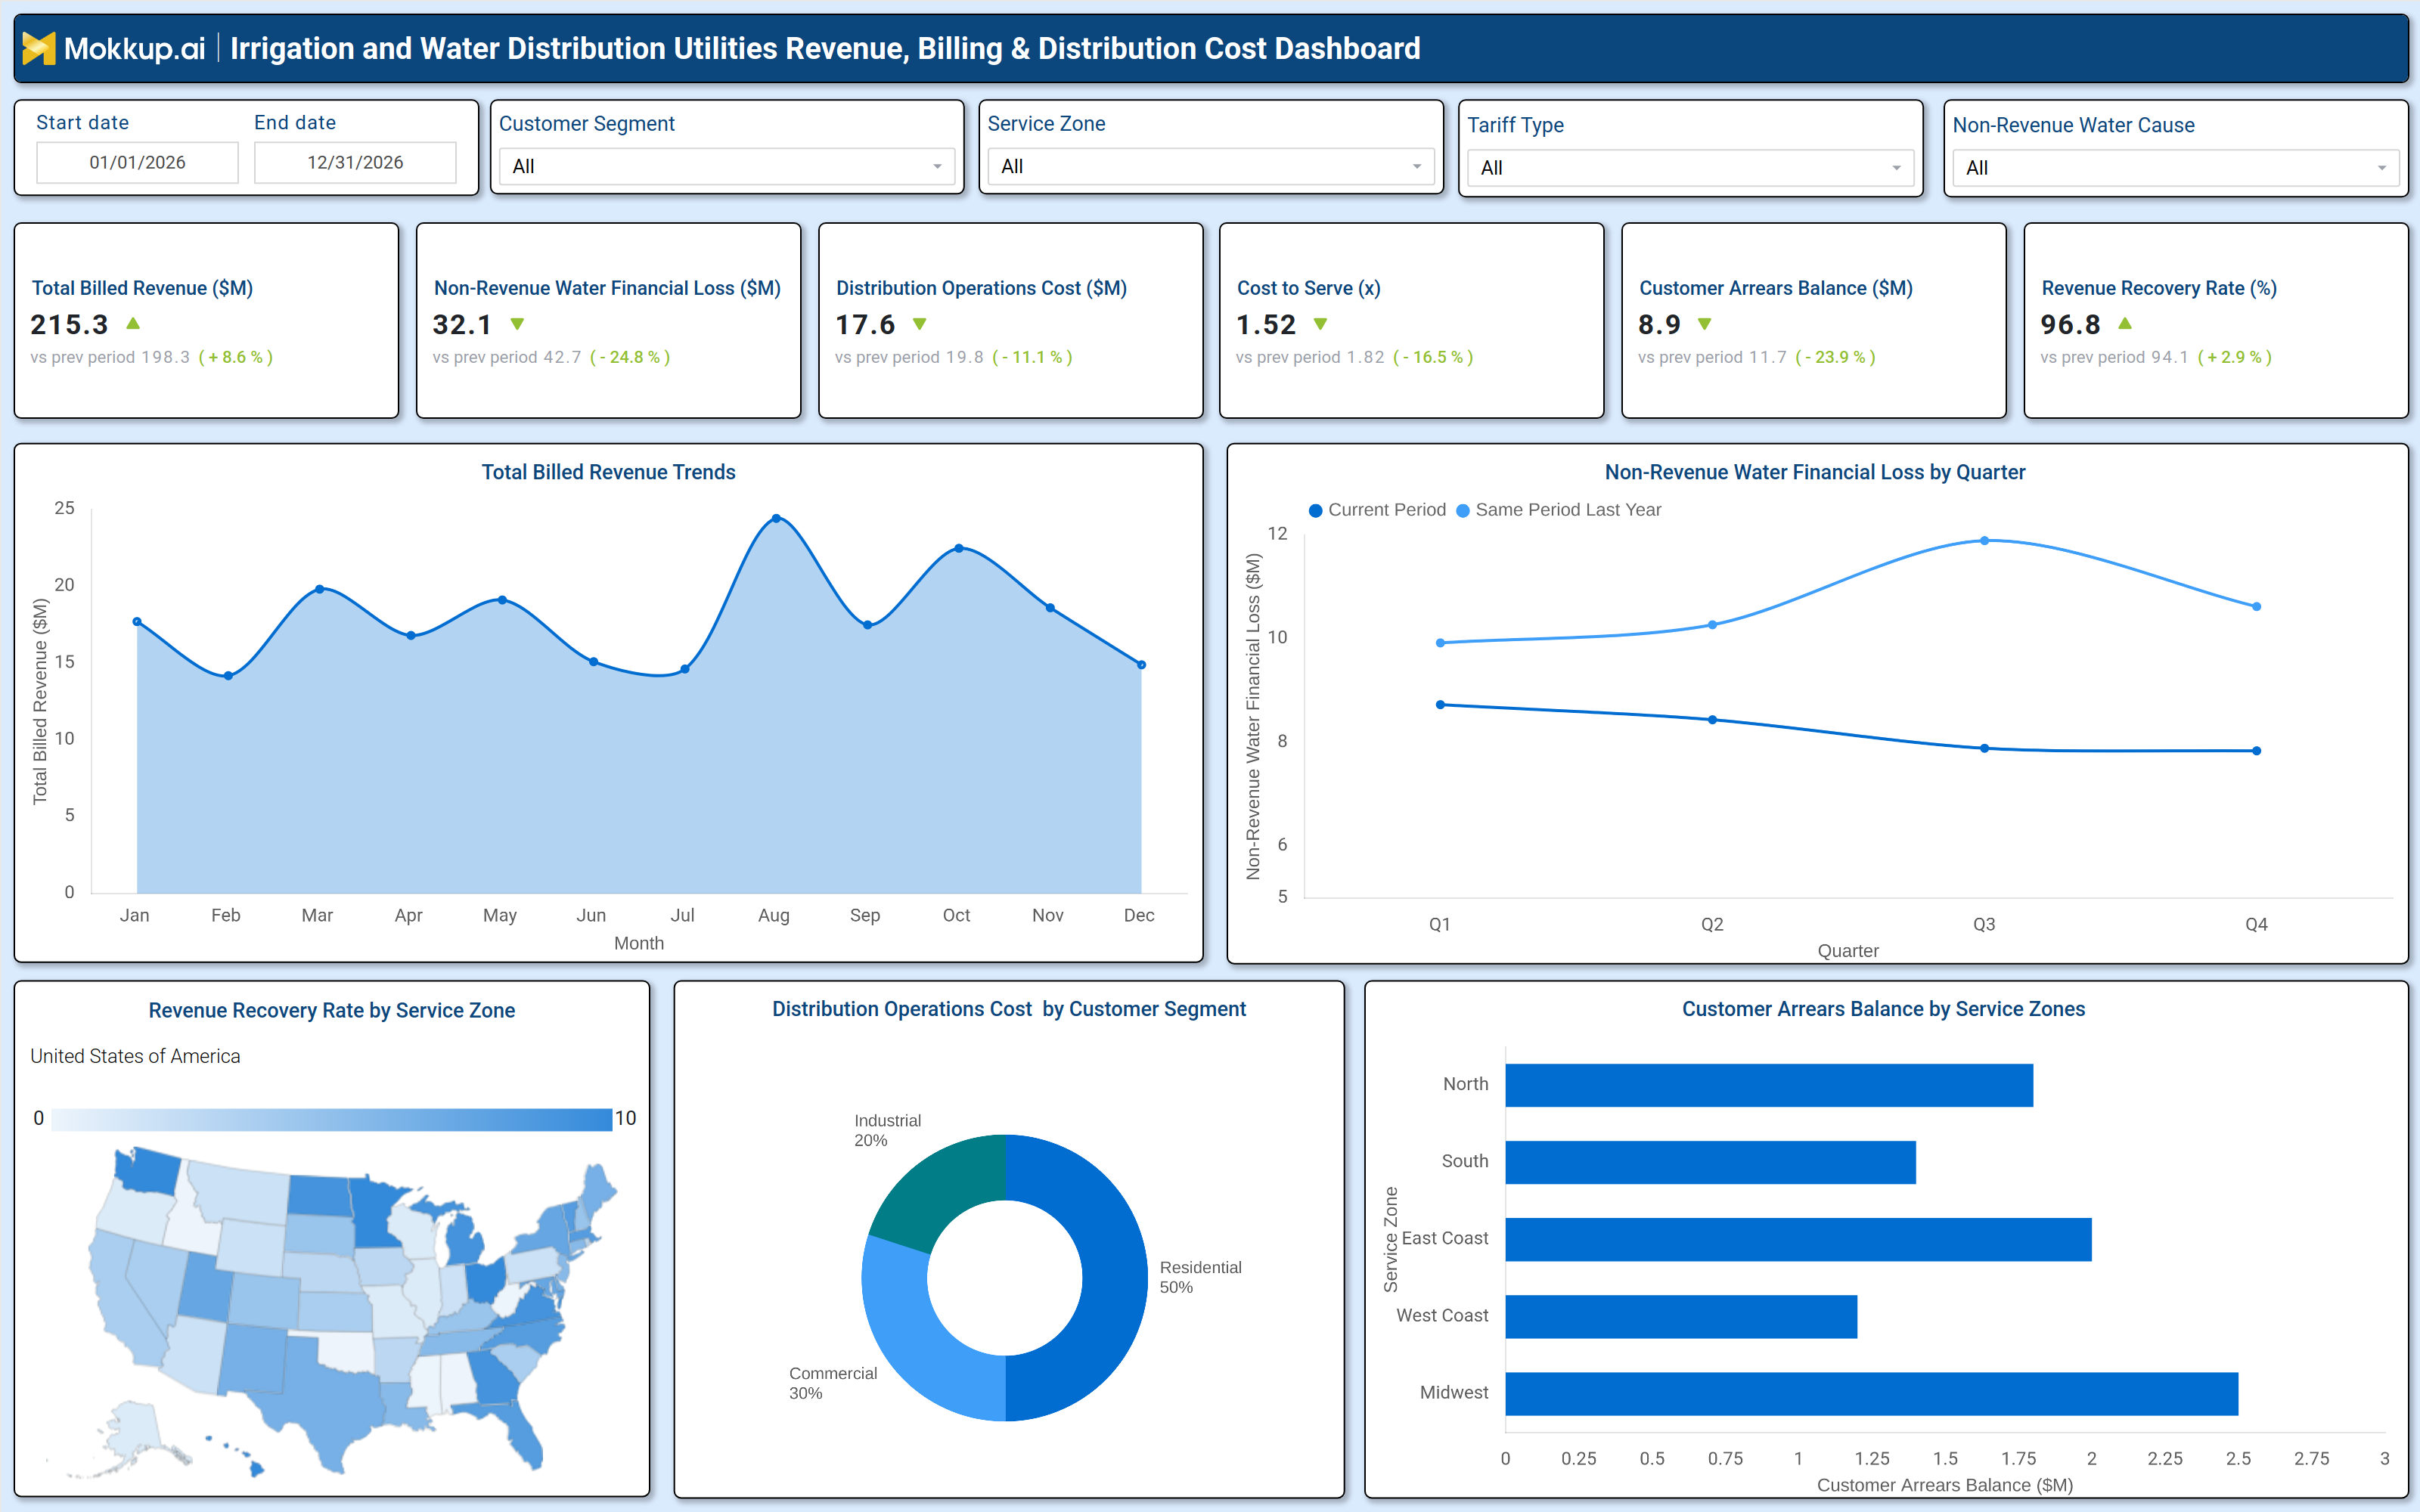
A well-structured revenue recovery rate dashboard includes interactive filters for date ranges, customer segments, service zones, tariff types, and non-revenue water causes. Key performance tiles display total billed revenue, non-revenue water financial loss, distribution operations cost, cost-to-serve ratio, customer arrears balance, and revenue recovery rate, with comparisons against previous periods. Trend charts show monthly billed revenue fluctuations and quarterly non-revenue water losses, helping utilities detect seasonal patterns. A geographic heatmap highlights revenue recovery rates by service zone, while a pie chart breaks down distribution costs by customer segment (residential, commercial, industrial). Additional visuals track customer arrears by region and cost-to-serve trends, providing a comprehensive view of financial health. Together, these components form a customer arrears tracking dashboard that enhances billing accuracy, reduces losses, and optimizes distribution expenses.
How to Analyze Data in an Irrigation and Water Distribution Utilities Revenue, Billing & Distribution Cost Dashboard
Here is how you can analyze data from this dashboard:
- Review Total Billed Revenue Trends: Analyze billed revenue across different time periods to assess overall financial performance, identify growth patterns, and support strategic financial planning.
- Track Non-Revenue Water Financial Losses: Monitor revenue losses caused by water leakage, theft, unauthorized consumption, or inaccurate metering to reduce financial leakage and improve operational accountability.
- Monitor Distribution Operations Costs: Evaluate water distribution expenses to identify cost inefficiencies, optimize resource utilization, and control operational spending.
- Compare Cost-to-Serve Ratios: Assess the relationship between operational costs and revenue generated to evaluate pricing strategies, service profitability, and overall operational efficiency.
- Analyze Customer Arrears Balances: Track outstanding customer payments and overdue balances to improve collection strategies, reduce bad debt, and strengthen cash flow management.
- Measure Revenue Recovery Rates: Evaluate the effectiveness of billing and payment collection processes by measuring how much billed revenue is successfully recovered over time.
- Break Down Costs by Customer Segment: Analyze operational and service costs across residential, commercial, and industrial customer groups to optimize tariff structures and improve profitability.
- Use Service Zone Comparisons: Compare financial performance across different service zones to identify regions with high losses, low revenue generation, or operational inefficiencies.
- Evaluate Historical Financial Trends: Review long-term financial data to identify performance improvements, declining trends, and opportunities for strategic optimization and cost reduction.
Benefits of an Irrigation and Water Distribution Utilities Revenue, Billing & Distribution Cost Dashboard
The following are the benefits of using this dashboard:
- Improves Financial Transparency: Consolidates revenue, operational costs, and financial loss data into a single view, enabling better visibility into overall utility financial performance.
- Reduces Non-Revenue Water Losses: Supports data-driven identification of leaks, theft, and metering inaccuracies to minimize water and revenue losses.
- Optimizes Distribution Expenses: Identifies cost-saving opportunities within water distribution operations to improve budget utilization and operational efficiency.
- Enhances Billing Efficiency: Improves billing and payment collection processes through continuous monitoring of arrears balances and revenue recovery rates.
- Supports Tariff Adjustments: Analyzes cost-to-serve ratios across different customer segments to help design fair, sustainable, and profitable tariff structures.
- Strengthens Revenue Collection: Enables targeted collection strategies by identifying service zones or customer groups with consistently high arrears balances.
- Enables Data-Driven Decision-Making: Provides actionable financial and operational insights that support informed decisions for utility managers and financial planners.
- Increases Operational Efficiency: Streamlines water distribution and billing processes to reduce inefficiencies, improve service delivery, and enhance overall utility performance.
KPIs to Track in a Irrigation and Water Distribution Utilities Revenue, Billing & Distribution Cost Dashboard
The following key KPIs can be tracked by using this dashboard:
- Total Billed Revenue ($M): Measures the total income generated from water billing.
- Non Revenue Water Financial Loss ($M): Tracks the financial impact of water lost due to leaks, theft, or metering errors.
- Distribution Operations Cost ($M): Monitors expenses related to water delivery and infrastructure maintenance.
- Cost to Serve Ratio (x): Evaluates the cost efficiency of delivering water per unit of revenue.
- Customer Arrears Balance ($M): Tracks unpaid bills to assess collection effectiveness.
- Revenue Recovery Rate (%): Measures the percentage of billed revenue successfully collected.
Frequently Asked Questions
1. What is a non-revenue water financial loss dashboard used for?
It helps utilities track revenue, billing efficiency, and distribution expenses to optimize financial performance.
2. Who should use an irrigation distribution billing dashboard?
Water utility managers, financial analysts, operations teams, and municipal decision-makers.
3. What data sources feed into this water utility revenue and cost dashboard?
Billing systems, SCADA (Supervisory Control and Data Acquisition), customer management platforms, and financial records.