What is an Irrigation and Water Distribution Agriculture & Municipal Supply Dashboard?
An Irrigation and Water Distribution Agriculture & Municipal Supply Dashboard is a centralized analytics tool designed to monitor, track, and optimize water usage across agricultural and municipal sectors. This dashboard integrates data from water utilities, irrigation systems, and customer supply networks to provide actionable insights on water distribution efficiency, consumption patterns, and operational performance.
By consolidating bulk water sales, drought impact indices, supply reliability scores, and infrastructure leakages, this dashboard helps water managers, farmers, and municipal authorities make data-driven decisions. It enables better resource allocation, reduces water waste, and ensures compliance with regulatory standards. Whether tracking agricultural irrigation fulfillment rates or per capita water use in cities, this dashboard serves as a single source of truth for water supply management.
How to Create an Irrigation and Water Distribution Agriculture & Municipal Supply Dashboard
You don’t need to build your report from scratch, just start with a ready-to-use Irrigation and Water Distribution Agriculture & Municipal Supply dashboard template from Mokkup. Add in your data and export it however you like. Here’s how to do it:
1. Create or Log in to Your Mokkup Account
Start by signing up on Mokkup.ai using your email. If you already have an account, just log in, and you’ll be good to go.
2. Choose and Customize Your Dashboard Template
Find the Irrigation and Water Distribution Agriculture & Municipal Supply Dashboard template in the Templates section. Use the drag-and-drop editor to adjust KPIs, edit filters, or add elements based on your data.
3. Export to Your BI Tool
Once your dashboard wireframe is ready, use the BI Tool Export feature to send it directly to Power BI or Tableau for further analysis and enhancements. You can also download the dashboard as a PDF, PNG, or JPEG, embed it on a platform, or invite your team to collaborate.
Note: This is a Pro template. You’ll need a Pro subscription on Mokkup to use and customize this dashboard wireframe. Upgrade anytime to unlock full access.
Irrigation and Water Distribution Agriculture & Municipal Supply Dashboard Example
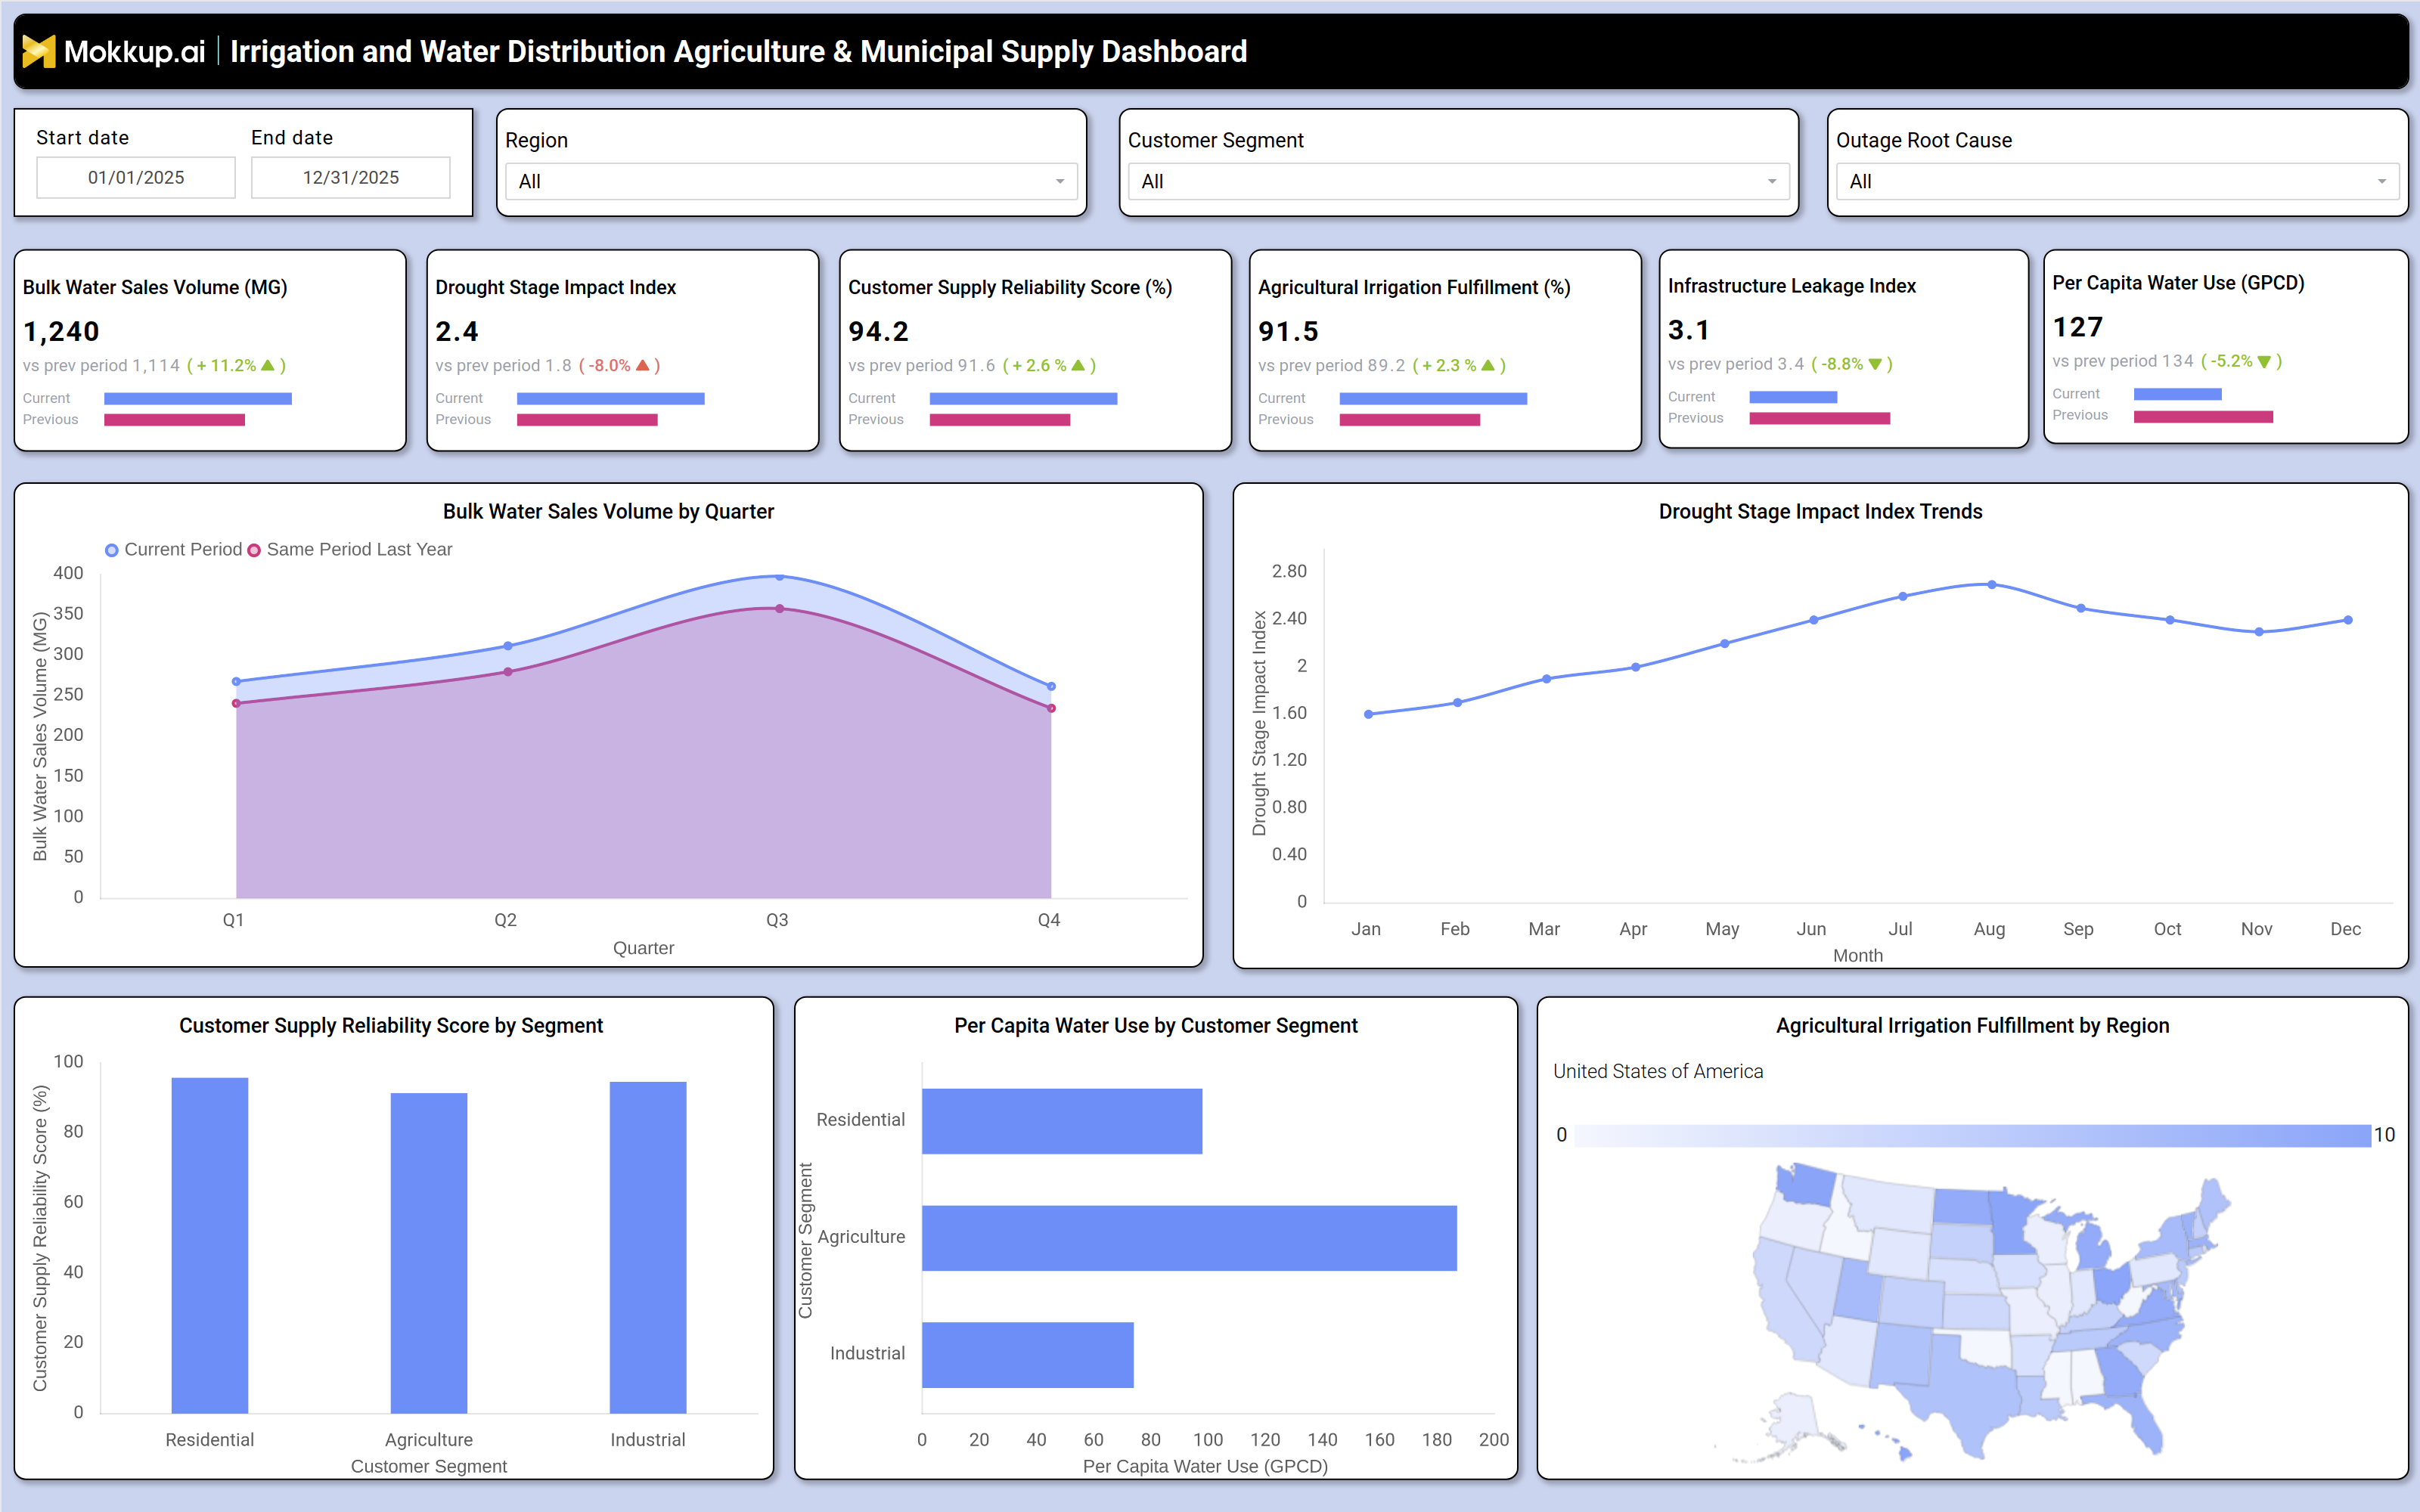
A well-designed irrigation fulfillment tracking dashboard includes interactive filters for date ranges, regions, customer segments, and outage root causes, allowing users to drill down into specific data points. Key performance tiles display bulk water sales volume, drought stage impact index, customer supply reliability scores, agricultural irrigation fulfillment rates, infrastructure leakage indices, and per capita water use.
Trend charts compare current water sales against previous periods, while drought impact trends highlight seasonal variations. A customer supply reliability breakdown by segment (residential, agricultural, industrial) helps identify service gaps. A geographic map visualizes irrigation fulfillment by region, while per capita water use charts reveal consumption patterns across different customer types. Together, these components provide a comprehensive view of water distribution efficiency, enabling utilities and farmers to optimize supply chains and reduce waste.
How to Analyze Data in an Irrigation and Water Distribution Agriculture & Municipal Supply Dashboard
Here is how you can analyze data from this dashboard:
- Track Water Sales Trends: Review bulk water sales volumes to identify seasonal demand changes.
- Monitor Drought Impact: Analyze drought stage indices to assess water scarcity risks.
- Assess Supply Reliability: Track customer reliability scores to identify service disruptions.
- Evaluate Irrigation Fulfillment: Compare agricultural delivery rates against targets to optimize allocation.
- Analyze Leakage Trends: Monitor infrastructure leakage indices to reduce nonrevenue water loss.
- Review Per Capita Usage: Compare water consumption across customer segments to support conservation efforts.
- Prioritize Regional Performance: Use geographic breakdowns to identify high-leakage or low-fulfillment areas.
- Benchmark Historical Trends: Compare current performance against historical data to measure improvement.
Benefits of an Irrigation and Water Distribution Agriculture & Municipal Supply Dashboard
The following are the benefits of using this dashboard:
- Improved Distribution Efficiency: Identifies leaks, waste, and supply gaps quickly.
- Stronger Drought Resilience: Supports adaptive planning with real-time drought monitoring.
- Optimized Irrigation Management: Helps improve agricultural water allocation and scheduling.
- Reduced Water Losses: Monitors infrastructure leakage to minimize nonrevenue water.
- Data-Driven Decision-Making: Supports utilities, farmers, and municipalities with actionable insights.
- Better Compliance Monitoring: Tracks supply reliability and water management performance.
- Lower Operational Costs: Reduces waste and improves network efficiency.
- Sustainable Water Usage: Encourages conservation through consumption analysis and monitoring.
KPIs to Track in an Irrigation and Water Distribution Agriculture & Municipal Supply Dashboard
The following key KPIs can be tracked by using this water leakage index dashboard:
- Bulk Water Sales Volume (MG): Measures total water distributed to agricultural and municipal customers.
- Drought Stage Impact Index: Assesses the severity of drought conditions and their effect on water supply.
- Customer Supply Reliability Score (%): Evaluates the consistency of water delivery to end users.
- Agricultural Irrigation Fulfillment (%): Tracks how well irrigation demands are met for farming operations.
- Infrastructure Leakage Index: Quantifies water losses due to pipeline leaks and system inefficiencies.
- Per Capita Water Use (GPCD): Monitors average water consumption per person, helping identify conservation opportunities.
Frequently Asked Questions
Q1. What is a drought impact monitoring dashboard used for?
It tracks water supply efficiency, monitors leaks, and optimizes irrigation and municipal distribution.
Q2. What data sources feed into this municipal customer supply dashboard?
SCADA systems, smart meters, weather data, irrigation controllers, and utility billing records.
Q3. Who should use a water distribution dashboard for agriculture?
Water utilities, farmers, municipal authorities, and agricultural businesses managing water resources.