What is an Electric Power Retail Customer Engagement & Campaign Impact Dashboard?
An Electric Power Retail Customer Engagement & Campaign Impact Dashboard is a centralized analytics solution designed to help electricity retail utilities monitor, measure, and optimize customer communication initiatives. This dashboard consolidates outreach data across multiple channels, such as email, SMS, website notifications, social media, and direct messaging to provide a unified view of campaign performance and functions as a utility customer outreach campaign performance dashboard for electric power retail utilities.
By tracking reach, engagement, conversions, and cost efficiency, the dashboard supports data-driven decision-making for customer communication teams, marketing leaders, and utility executives. It acts as a utility customer outreach and engagement reporting dashboard that aligns outreach strategies with operational goals, regulatory requirements, and customer experience improvement initiatives
How to Create an Electric Power Retail Customer Engagement & Campaign Impact Dashboard
You don’t need to build your report from scratch, just start with a ready-to-use dashboard template from Mokkup. Add in your data and export it however you like. Here’s how to do it:
1. Create or Log in to Your Mokkup Account
Start by signing up on Mokkup.ai using your email. If you already have an account, just log in, and you’ll be good to go.
2. Choose and Customize Your Dashboard Template
Find the Electric Power Retail Customer Engagement & Campaign Impact Dashboard template in the Templates section. Use the drag-and-drop editor to adjust KPIs, edit filters, or add elements based on your data.
3. Export to Your BI Tool
Once your dashboard wireframe is ready, use the BI Tool Export feature to send it directly to Power BI or Tableau for further analysis and enhancements. You can also download the dashboard as a PDF, PNG, or JPEG, embed it on a platform, or invite your team to collaborate.
Note: This is a Pro template. You’ll need a Pro subscription on Mokkup to use and customize this dashboard wireframe. Upgrade anytime to unlock full access.
Electric Power Retail Customer Engagement & Campaign Impact Dashboard Example
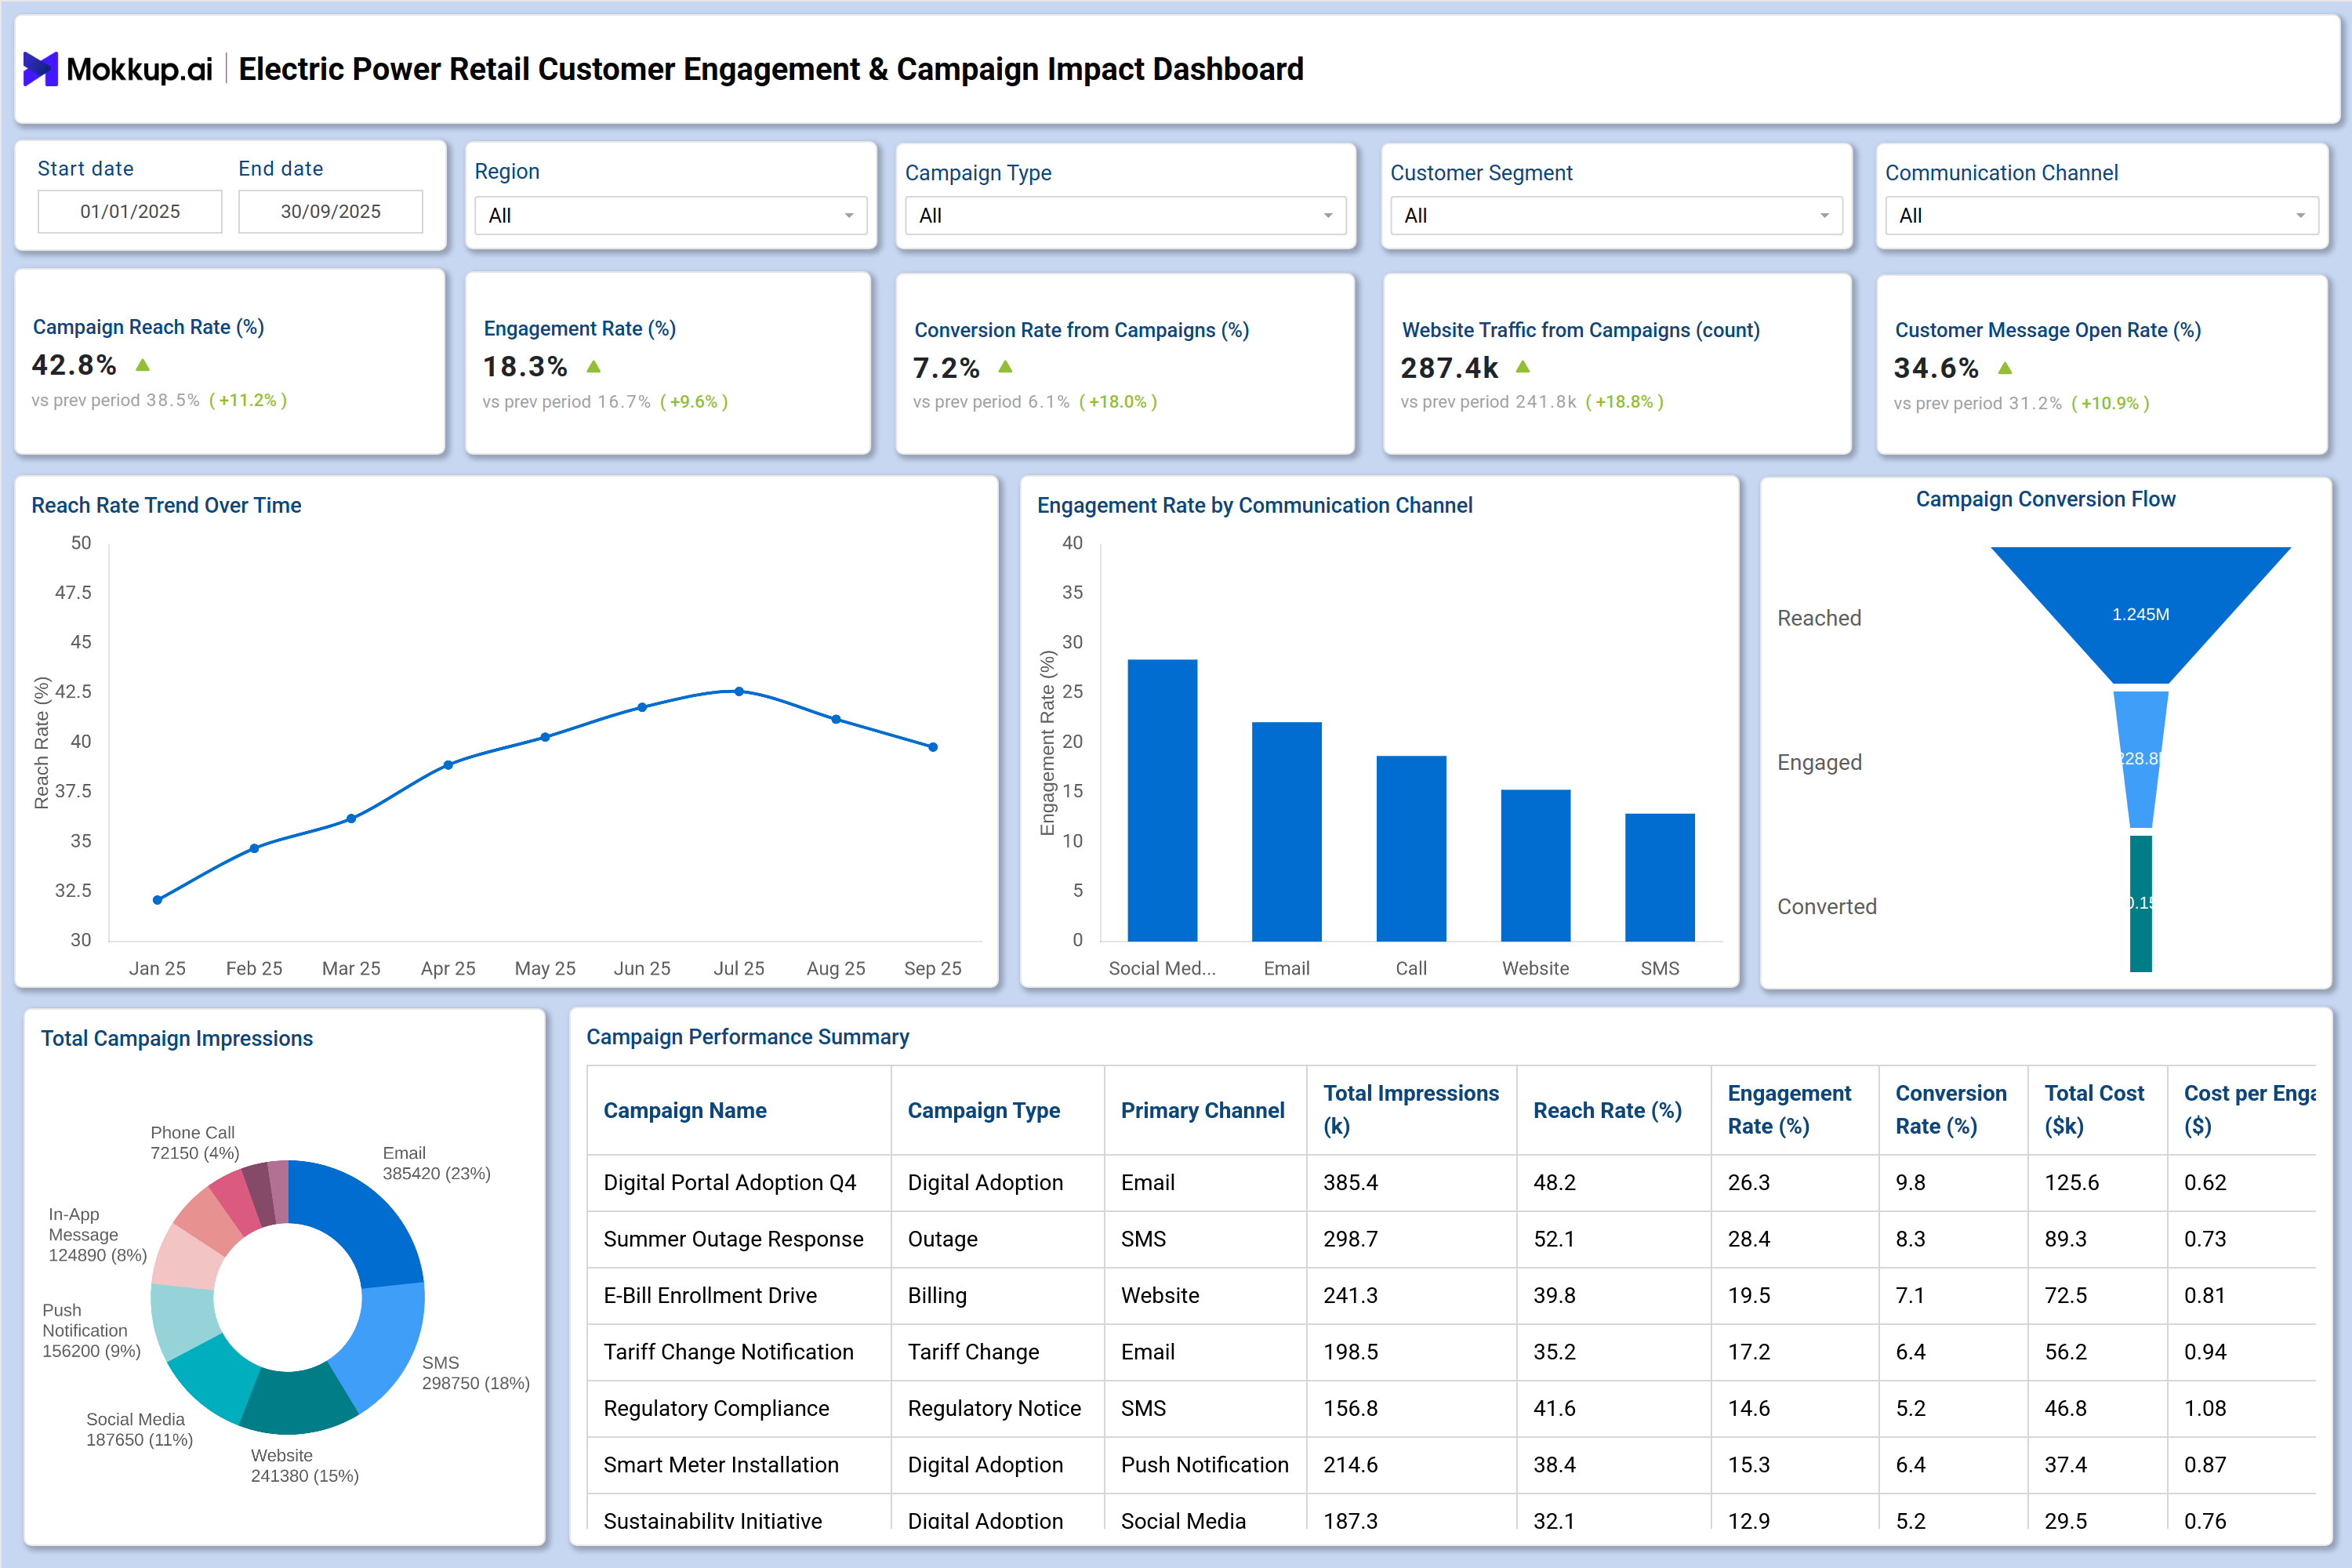
A typical electric power retail customer outreach dashboard presents filters for date range, region, campaign type, customer segment, and communication channel, allowing stakeholders to analyze performance at different levels. Key performance indicators such as campaign reach rate, engagement rate, conversion rate, website traffic from campaigns, and message open rates are displayed prominently for quick executive insights.
Visuals include trend lines showing reach over time, bar charts comparing engagement by communication channel, funnel views illustrating campaign conversion flow, and distribution charts highlighting total campaign impressions by channel. Detailed tables summarize campaign-level performance, enabling utilities to compare costs, engagement efficiency, and conversion outcomes. This structure enables utilities to operate an electricity utility marketing campaign impact dashboard that links customer behavior directly to outreach investments.
How to Analyze Data in an Electric Power Retail Customer Engagement & Campaign Impact Dashboard
Here is how you can analyze data from this dashboard:
- Engagement Overview: Start by reviewing overall campaign reach and engagement trends to identify periods of increased or reduced customer responsiveness.
- Channel Effectiveness: Compare engagement rates across communication channels to determine which channels perform best for different campaign types.
- Conversion Funnel: Analyze the flow from reached to engaged to converted customers to pinpoint drop-off points in outreach efforts.
- Digital Adoption Signals: Review website traffic generated from campaigns to measure self-service behavior and digital adoption.
- Segment-Level Insights: Segment performance by customer type, region, or campaign category to uncover targeted improvement opportunities.
- Cost Efficiency: Evaluate campaign cost metrics against engagement and conversion rates to assess operational efficiency.
- Historical Benchmarking: Use historical comparisons to understand how current campaigns stack up against previous outreach initiatives.
Benefits of an Electric Power Retail Customer Engagement & Campaign Impact Dashboard
The following are the benefits of using this dashboard for utility customer outreach analytics for electric power retailers
- Improves visibility into customer communication performance across all outreach channels
- Supports data-driven optimization of marketing and customer engagement strategies
- Enhances measurement of campaign effectiveness and customer response behavior
- Helps utilities improve ROI tracking using an electricity retail campaign ROI analytics dashboard
- Enables proactive adjustments to outreach strategies based on insights
- Reduces manual reporting effort by centralizing outreach analytics
- Aligns customer communication performance with business and regulatory objectives
KPIs to Track in Electric Power Retail Customer Engagement & Campaign Impact Dashboard
The following key KPIs can be tracked by using this dashboard:
- Campaign Reach Rate: Measures the percentage of targeted customers who received the outreach communication across all channels.
- Customer Engagement Rate: Indicates the proportion of reached customers who interacted with the campaign through clicks, replies, or actions.
- Conversion Rate from Outreach Campaigns: Tracks the percentage of engaged customers who completed a defined outcome such as bill payment, enrollment, or service adoption.
- Website Traffic Generated from Campaigns: Measures the volume of customer visits to utility digital platforms driven directly by outreach campaigns.
- Customer Message Open Rate: Shows the percentage of delivered messages that were opened by customers, indicating message visibility and subject effectiveness.
- Total Campaign Impressions: Represents the total number of times campaign messages were displayed to customers across all communication channels.
- Engagement Rate by Communication Channel: Compares customer interaction levels across channels such as email, SMS, mobile app, and web notifications.
- Cost per Engagement: Calculates the average cost incurred for each customer interaction generated by the outreach campaign.
- Cost per Conversion: Measures the cost required to achieve one successful customer action or conversion through outreach efforts.
- Campaign ROI: Evaluates the financial return generated from campaigns relative to total outreach costs.
- Customer Response Time: Measures the average time taken by customers to respond after receiving outreach communication.
- Channel-wise Outreach Performance: Provides a comparative view of reach, engagement, and conversions by individual communication channels.
Frequently Asked Questions
1. What is the primary purpose of a customer outreach dashboard for electric power retailers?
The primary purpose is to measure and optimize customer communication effectiveness by tracking outreach performance, engagement, and conversions across multiple channels.
2. Who should use this dashboard in an electric power retail organization?
Marketing teams, customer experience managers, digital transformation leaders, and utility executives use this dashboard to monitor outreach impact and customer behavior.
3. How does this dashboard help improve campaign ROI?
By correlating costs with engagement and conversion metrics, the dashboard functions as an electricity retail campaign ROI analytics dashboard, enabling better allocation of outreach budgets.