What is an Invoice Management Dashboard?
An Invoice Management Dashboard is a centralized system designed to help finance teams track purchases, payables, vendor dues, and payment timelines in real-time. It consolidates invoice data from multiple systems and presents it through visual elements, including bar charts, line charts, pie charts, and tabular summaries.
This centralized invoice tracking system dashboard serves as a finance invoice tracking tool, supporting invoice approval workflows, payment processing, exception handling, and overdue monitoring. It gives decision-makers an integrated view of total purchases, payable amounts, overdue invoices, upcoming payments, outstanding balances by department, and payment cycle efficiency. By simplifying data visibility, finance teams can reduce processing delays, improve aging analysis, and optimize working capital.
How to Create an Invoice Management Dashboard
You don’t need to build your report from scratch—just start with a ready-to-use dashboard template from Mokkup. Add in your data and export it however you like. Here’s how to do it:
1. Create or Log in to Your Mokkup Account
Start by signing up on Mokkup.ai using your email. If you already have an account, just log in, and you’ll be good to go.
2. Choose and Customize Your Dashboard Template
Find the Invoice Management Dashboard template in the Templates section. Use the drag-and-drop editor to adjust KPIs, edit filters, or add elements based on your data.
3. Export to Your BI Tool
Once your dashboard wireframe is ready, use the BI Tool Export feature to send it directly to Power BI or Tableau for further analysis and enhancements. You can also download the dashboard as a PDF, PNG, or JPEG, embed it on a platform, or invite your team to collaborate.
Note: This is a Pro template. You’ll need a Pro subscription on Mokkup to use and customize this dashboard wireframe. Upgrade anytime to unlock full access.
Invoice Management Dashboard Example
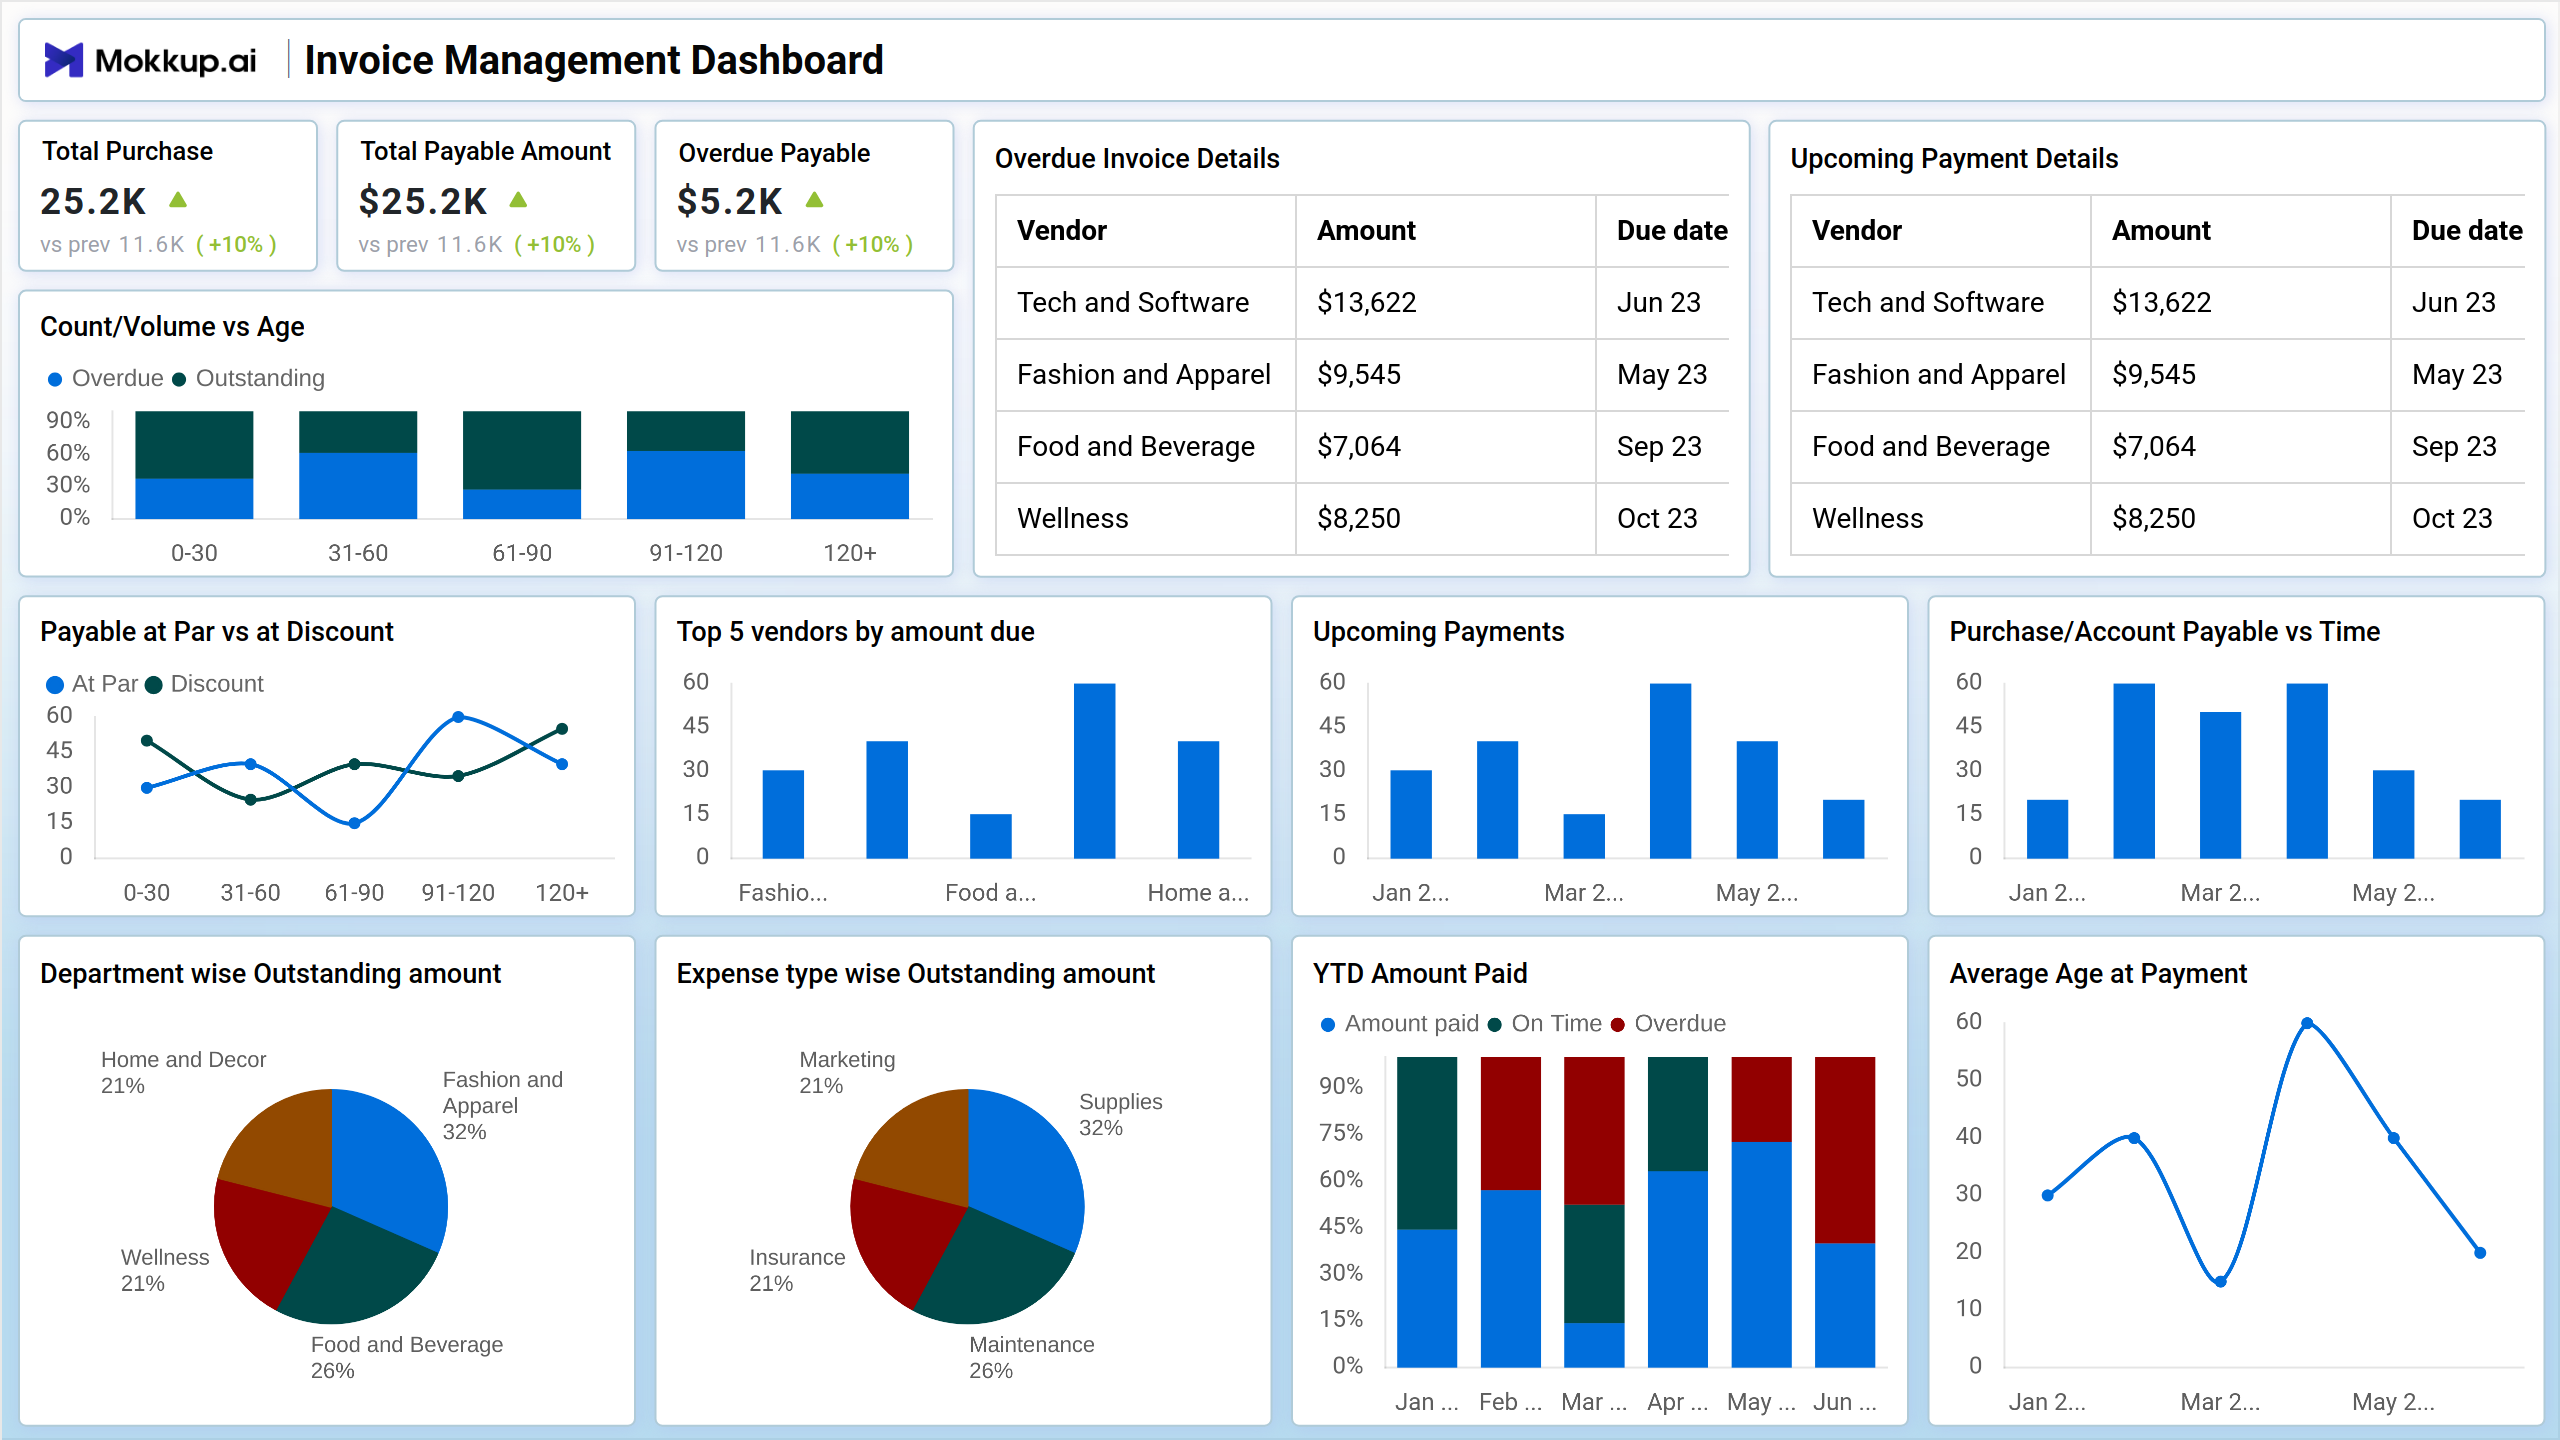
A typical Invoice Management Dashboard, such as the one shown in the template, includes KPI cards for Total Purchase, Total Payable Amount, and Overdue Payable. It visualizes invoice status using stacked bar charts for aging categories. The dashboard example also includes a detailed table for overdue invoice details and upcoming payment schedules, displaying vendor names, invoice amounts, and due dates. Bar charts highlight upcoming payments and vendor-wise amounts due, giving clarity on high-value vendors.
Pie charts break down department-wise outstanding balances and expense-type contributions, supporting cost allocation and category-level analysis. A line chart tracks the average age at payment, while a stacked bar chart displays the YTD amount paid, with on-time and overdue segments. This example shows how an accounts payable invoice analytics dashboard can streamline visibility across multiple financial dimensions.
How to Analyze Data in Invoice Management Dashboards
This finance invoice tracking dashboard analyzes data in the following ways:
- Review KPI Cards: Understand the overall payable position by tracking total purchases, outstanding amounts, and overdue exposure.
- Analyze Invoice Aging: Evaluate overdue vs. outstanding invoices across buckets to detect delay patterns.
- Check Overdue Invoice Details: Use vendor-level overdue tables to prioritize follow-ups.
- Monitor Upcoming Payments: Assess near-term cash requirements and payment schedules.
- Compare Par vs. Discount Payables: Identify Early Payment Discount Opportunities.
- Evaluate Vendor Concentration: Track top vendors by amount due to manage financial dependencies.
- Assess Department-wise Dues: Identify departments contributing to higher outstanding balances.
- Review Expense Type Distribution: Understand which cost categories drive payables.
- Track YTD Payment Behavior: Identify on-time vs. overdue trends to analyze payment discipline.
- Monitor Payment Age: Use average age at payment charts to detect inefficiencies in the payment process.
Benefits of Invoice Management Dashboards
Here are the benefits of implementing the invoice payment cycle time dashboard:
- Real-Time Payables Visibility: Instantly monitor outstanding payables, overdue amounts, and payment trends.
- Stronger Workflow Efficiency: Supports structured invoice approval workflow dashboards to reduce delays.
- Improved Vendor Management: Enables timely communication and prioritization for high-value vendors.
- Better Budget Allocation: Helps understand spending patterns through department and expense-type analytics.
- Optimized Cash Flow: Offers visibility into upcoming payments and invoice payment cycle time.
- Higher Process Compliance: Tracks invoice status, aging, and payment timelines to ensure adherence.
- Reduced Manual Effort: Eliminates dependency on spreadsheets through centralized and automated tracking.
- Accurate Forecasting: Improves predictability of financial obligations with future-dated payment insights.
KPIs to Track in Invoice Management Dashboards
- Total Purchase: Shows the total value of invoices raised for goods and services within a selected period.
- Total Payable Amount: Represents the total outstanding liability pending payment. This KPI helps finance teams understand the current level of payables.
- Overdue Payable: Captures the total invoice amount that has passed its due date. It signals payment delays and potential vendor risk that needs immediate attention.
- Overdue Invoice Details: Lists overdue invoices with vendor names, amounts, and due dates.
- Upcoming Payment Details: Shows invoices that are approaching their due date. It supports effective cash-flow planning and ensures timely disbursements.
- Payable at Par vs. at Discount: Compares invoices paid at regular terms vs. those eligible for early-payment discounts.
- Top 5 Vendors by Amount Due: Highlights vendors with the highest outstanding dues. It helps monitor vendor dependencies and manage high-value relationships.
- Upcoming Payments: Charts near-term payment obligations to support short-term financial planning. It improves visibility into expected cash outflows.
- YTD Amount Paid: Tracks the total amount paid during the year, segmented into on-time and overdue payments.
- Average Age at Payment: Measures the average number of days taken to process and pay invoices.
Frequently Asked Questions
1. How to create an effective invoice management system?
An effective system centralizes all invoices, standardizes approval workflows, and uses dashboards for real-time tracking.
2. What metrics should be tracked in billing dashboards?
Important metrics include total payables and receivables, overdue invoices, upcoming payments, YTD payments, aging analysis, and top vendors or customers.
3. Best practices for accounts receivable monitoring?
It is best to track overdue payments, monitor customer payment behavior, segment receivables, and set automated reminders.
4. How to automate invoice processing workflows?
Invoice processing can be automated with e-invoicing, approval routing, AI or RPA matching, and automated reminders.
5. What features are essential in payment tracking tools?
Key features include real-time tracking, automated alerts, aging analysis, vendor and customer breakdowns, ERP integration, and forecasting.