
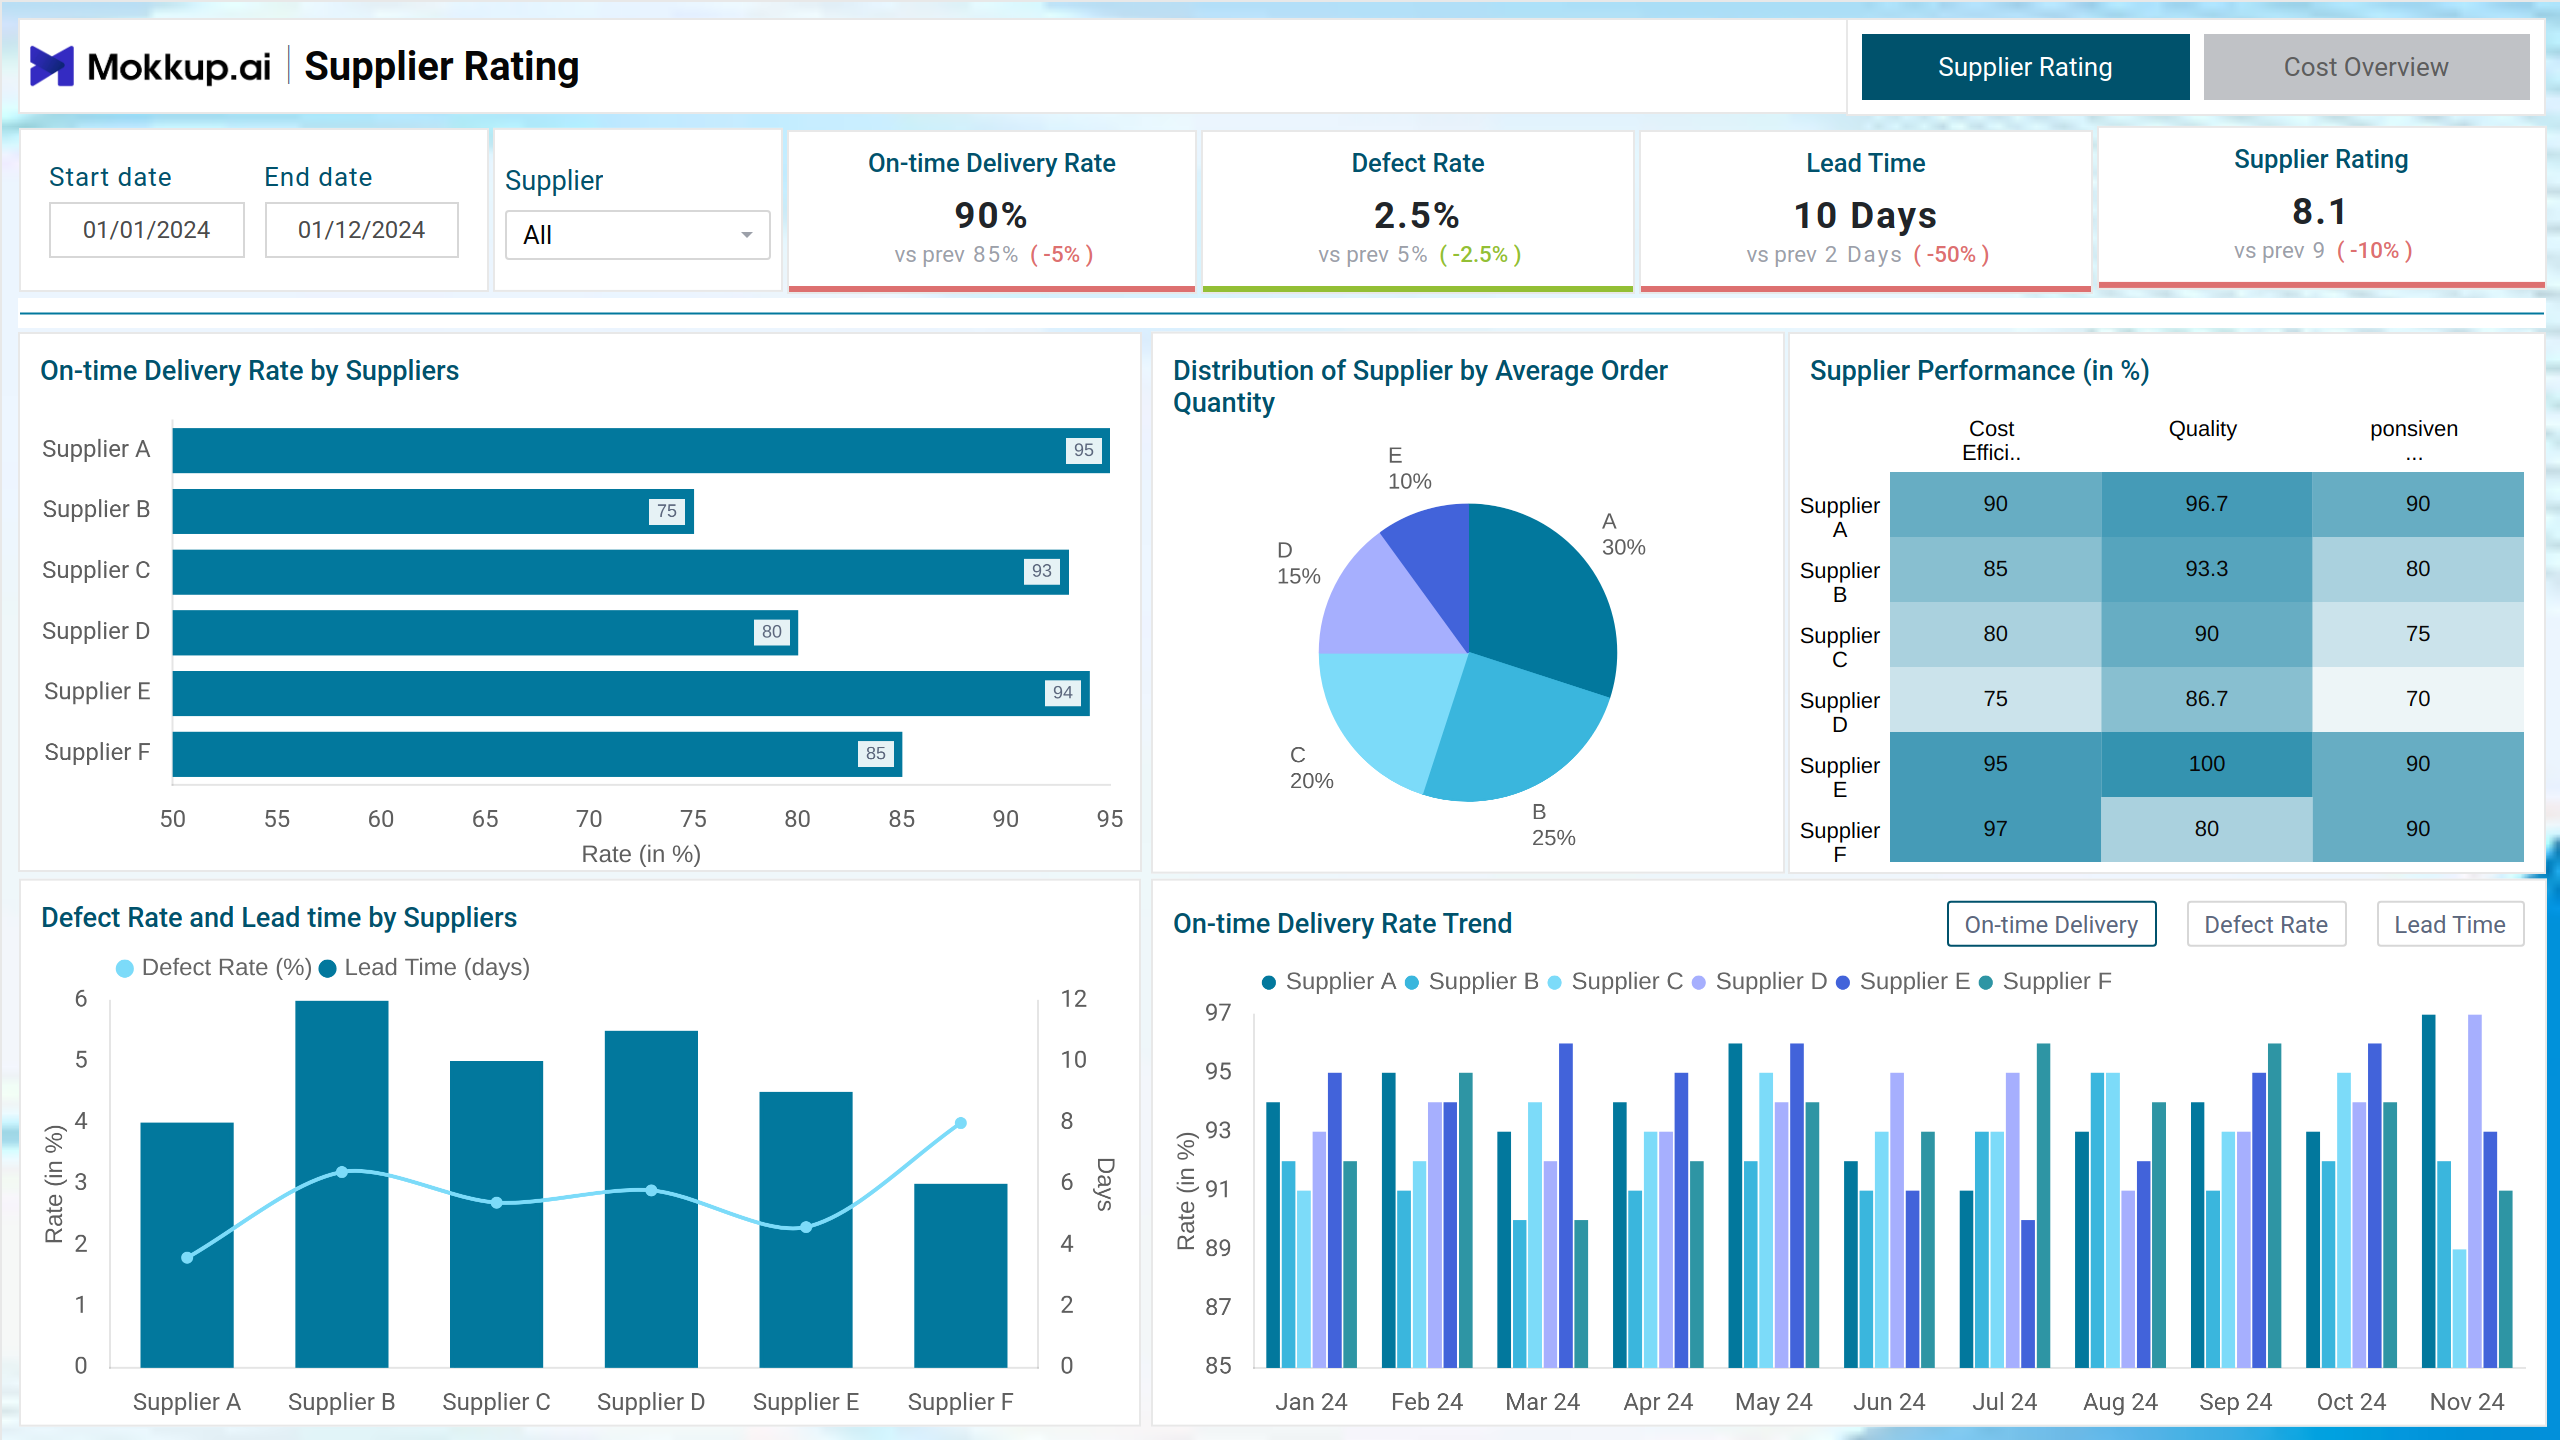
The Vendor Performance Dashboard template is designed for the manufacturing industry to evaluate and compare supplier performance and associated costs. This dashboard enables logistics and procurement teams to monitor supplier delivery metrics, identify cost inefficiencies, and drive strategic supplier management.
Supplier Performance Overview
This screen focuses on evaluating supplier performance using key delivery, quality, and efficiency metrics to improve decision-making and relationships. It presents key figures on timeliness, reliability, and performance variations over time. The visual breakdown helps in identifying strengths and areas for improvement, ensuring better decision-making for maintaining strong partnerships and reducing operational risks.
Key Terms to Know
- On-time Delivery Rate: Percentage of orders delivered on or before the promised date.
- Defect Rate: Percentage of defective units received from suppliers.
- Lead Time: Average time for a supplier to fulfill an order.
- Supplier Rating: Overall performance score based on combined metrics.
- On-time Delivery Rate by Suppliers: Compares delivery performance across suppliers.
- Distribution of Suppliers by Average Order Quantity: Displays supplier distribution based on average order size.
- Supplier Performance (%): Compares supplier performance across key dimensions:
- Defect Rate and Lead Time by Suppliers: Displays the relationship between defect rate and lead time.
Cost Overview
This screen provides detailed insights into supplier-related costs, enabling cost optimization and performance comparisons. It features interactive elements, visual breakdowns, and comparative analytics to track fluctuations over time. The layout effectively categorizes key data points, enabling informed decision-making through charts, tables, and detailed performance indicators.
Key Terms to Know
- Total Procurement Cost: Total expenditure incurred for procurement.
- Average Cost per Supplier: Average procurement cost per supplier.
- Average Cost per Unit: Cost incurred per unit of material.
- Rework Cost: Total cost of reworking defective materials.
- Cost Variance: Difference between expected and actual procurement costs.
- Breakdown of Procurement Cost by Supplier: Identifies high-cost suppliers for cost control.
- Rework Cost Breakdown: Helps prioritize areas contributing to rework costs.
- Procurement Cost Trend: Tracks cost fluctuations and identifies trends requiring attention.
- Volume vs Average Cost vs Defect Rate: Analyzes supplier performance based on cost, defect rate, and order volume.
- Cost by Category and Supplier: Compares procurement costs for raw materials and finished goods across suppliers.
- Supplier-Related Performance Table: Provides a detailed supplier-level comparison to support decision-making.
Dashboard Template Insights
Here are the key insights the dashboard wireframe provides:
- Gain a clear view of vendor performance based on key metrics like delivery time, quality, and reliability.
- Spot underperforming vendors and address issues to enhance supply chain efficiency.
- Track procurement expenses and negotiate better terms with data-backed insights.
- Maintain strong partnerships by monitoring contract adherence and service consistency.
Conclusion
This dashboard wireframe empowers procurement and logistics teams to monitor supplier performance, optimize procurement costs, and enhance decision-making. With insights into on-time delivery, defect rates, lead times, and cost breakdowns, this dashboard provides a comprehensive view of supplier efficiency and areas for improvement.