
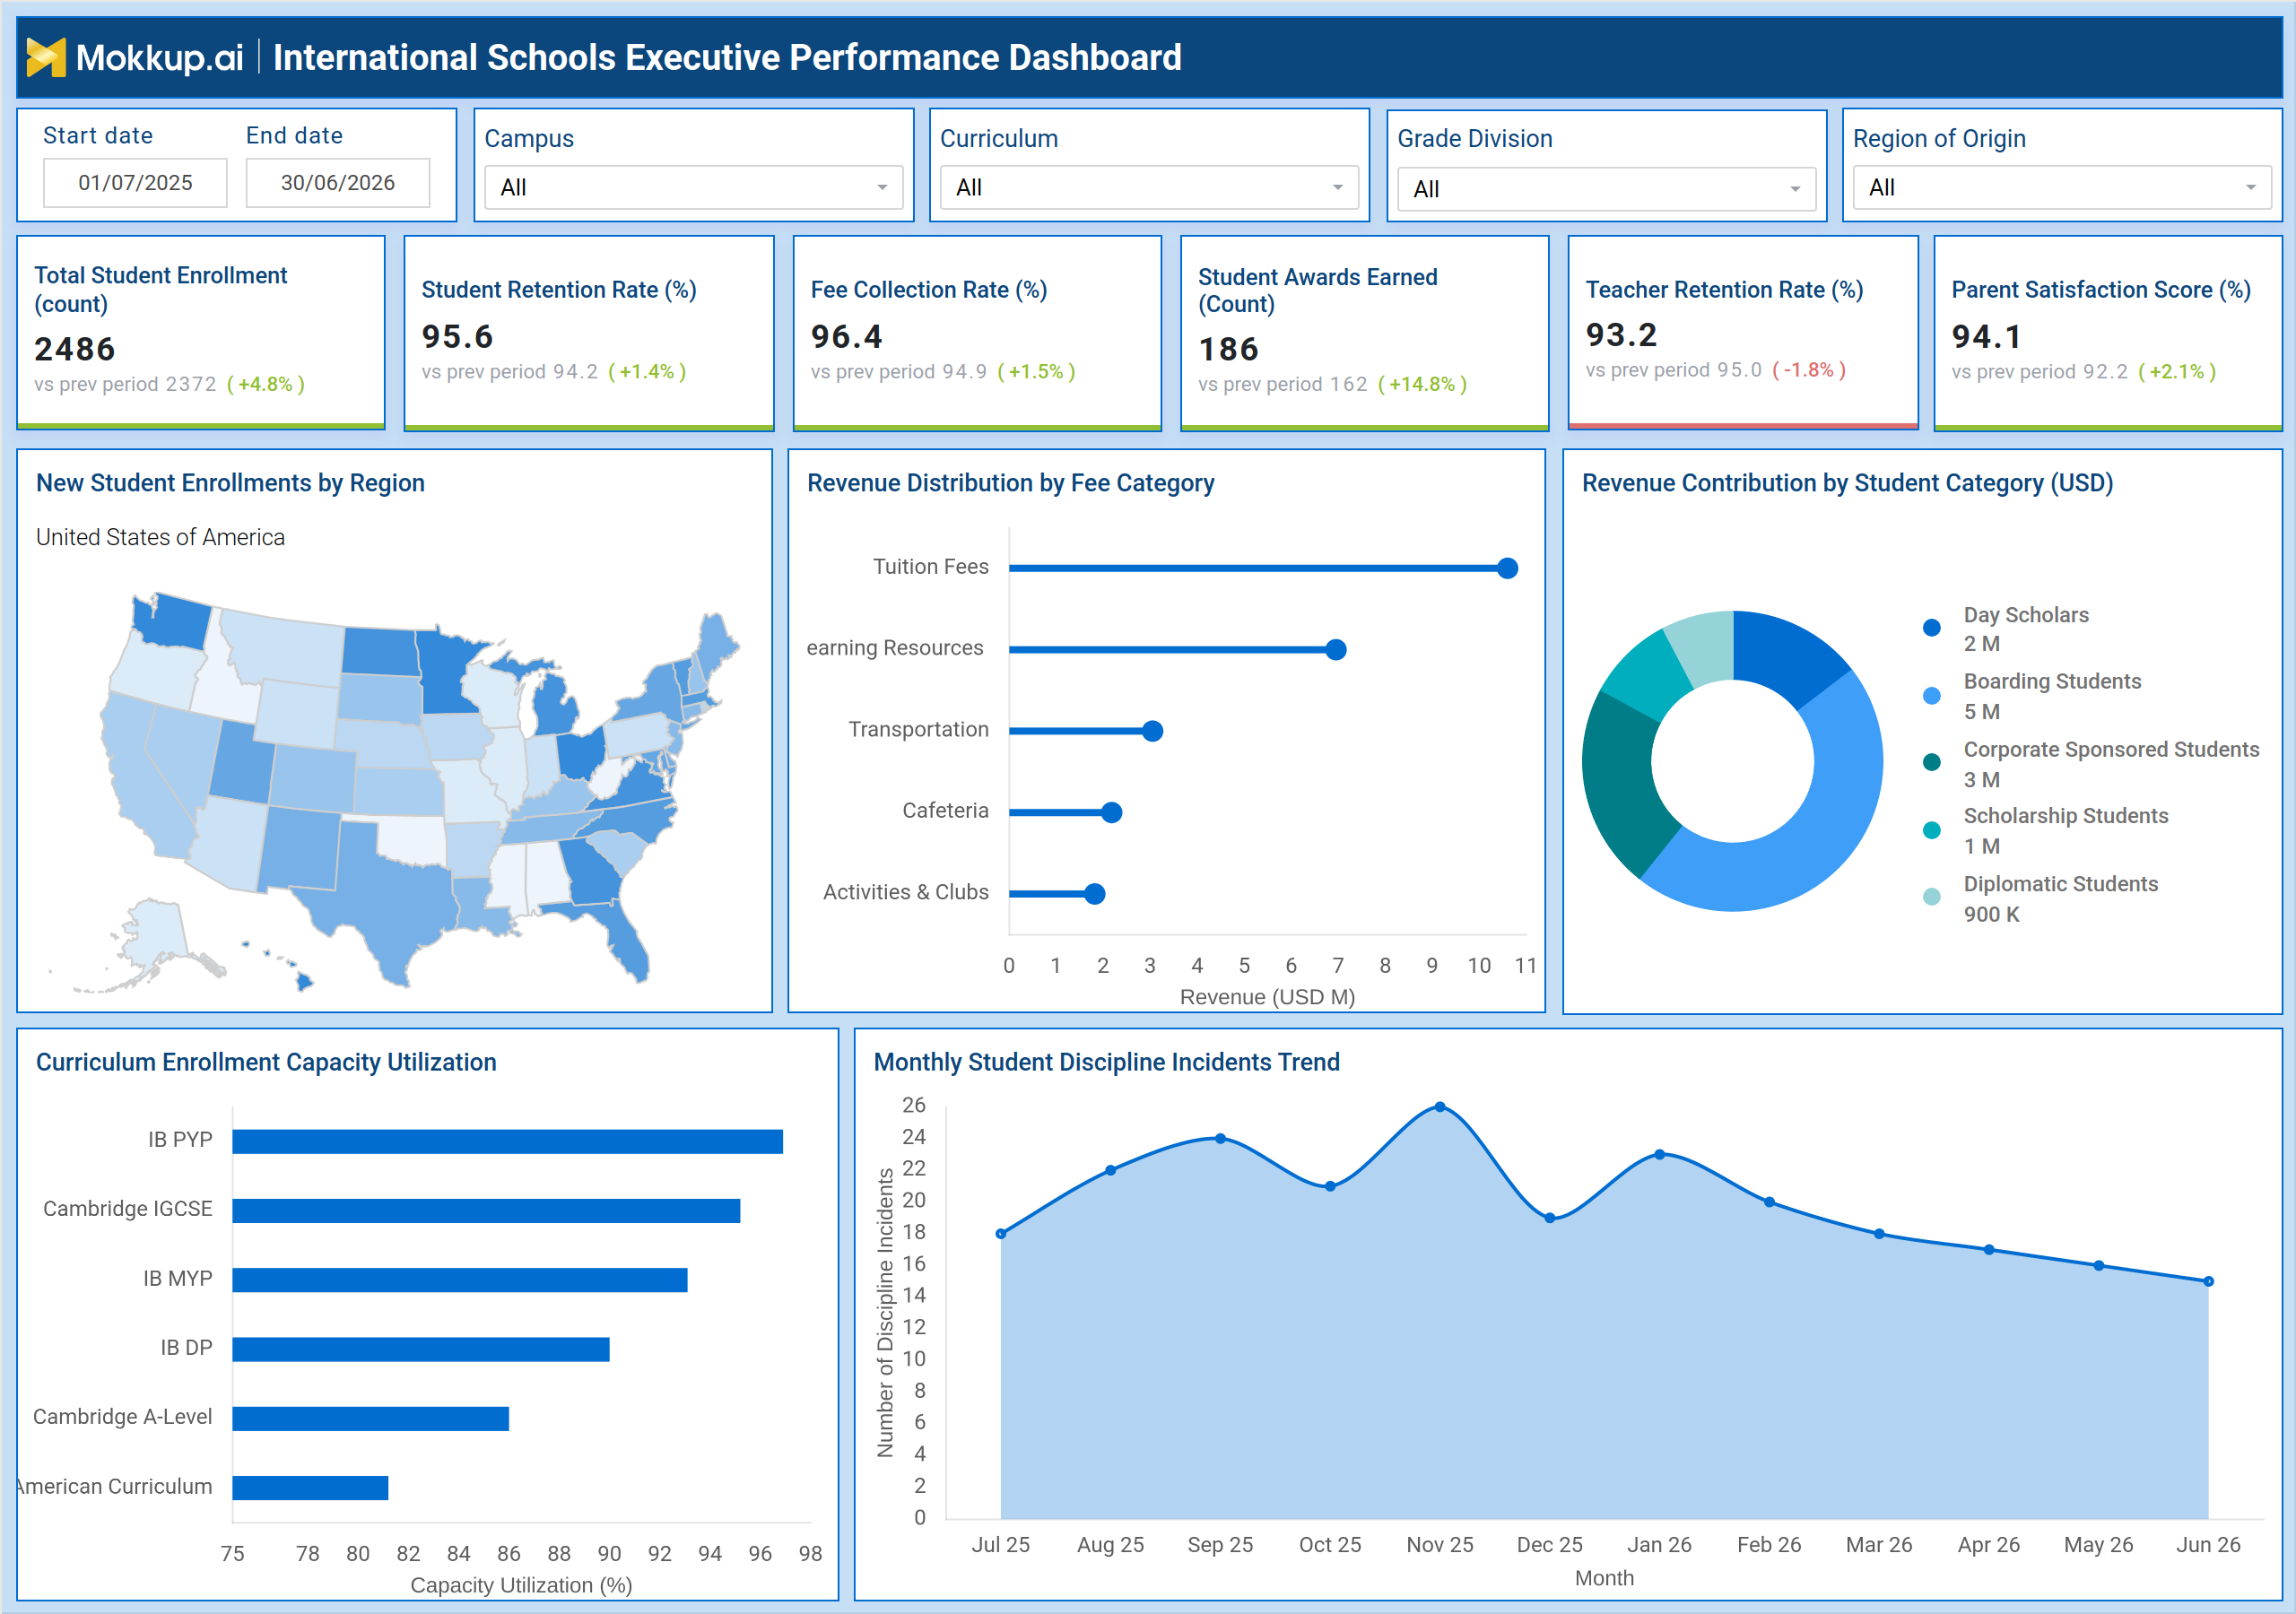
What is an International Schools Executive Performance Dashboard
The International Schools Executive Performance Dashboard is a Power BI wireframe template built for school leadership teams that need a single view of enrollment, revenue, and staff performance across campuses. It brings together student enrollment, retention, fee collection, and satisfaction metrics with regional enrollment mapping, revenue breakdowns, and curriculum utilization visuals, giving administrators a way to run international school performance tracking without switching between spreadsheets. The layout supports filtering by campus, curriculum, grade division, and region of origin, so leadership can narrow the view to a specific school year, program, or student segment.
Because the dashboard consolidates academic, financial, and staffing data on a single screen, it serves well as a school executive reporting template for board meetings and accreditation reviews.
How to Create an International Schools Executive Performance Dashboard
You don't need to build your report from scratch; just start with a ready-to-use dashboard template from Mokkup. Add in your data and export it however you like. Here's how to do it:
1. Create or Log in to Your Mokkup Account
Start by signing up on Mokkup.ai using your email. If you already have an account, just log in, and you'll be good to go.
2. Choose and Customize Your Dashboard Template
Find the International Schools Executive Performance Dashboard template in the Templates section. Use the drag-and-drop editor to adjust KPIs, edit filters, or add elements based on your data.
3. Export to Your BI Tool
Once your dashboard wireframe is ready, use the BI Tool Export feature to send it directly to Power BI or Tableau for further analysis and enhancements. You can also download the dashboard as a PDF, PNG, or JPEG, embed it on a platform, or invite your team to collaborate.
Note: This is a Pro template. You'll need a Pro subscription on Mokkup to use and customize this dashboard wireframe. Upgrade anytime to unlock full access.
International Schools Executive Performance Dashboard Example
A school superintendent or head of campus operations opens this dashboard at the start of a leadership review to understand how enrollment, revenue, and staff retention are trending across the network. Before a board meeting, they need a quick read on whether the current year is on pace with the previous one and which regions or curriculum programs are driving that movement. Rather than pulling data from admissions, finance, and HR systems separately, they rely on this single view to frame the conversation around student enrollment analytics for schools and organizational health together.
Leadership can identify which regions are contributing the most new enrollments and compare that against fee collection performance to see whether growth is translating into collected revenue. Finance heads can conduct school fee collection analysis by comparing tuition against ancillary categories such as learning resources, transportation, and cafeteria charges, helping them prioritize where billing follow-up is needed. Academic leaders can review curriculum capacity utilization reporting to see which programs are approaching full enrollment and which have room to grow, informing decisions on staffing and section additions. When discipline incidents trend upward or teacher retention rate tracking shows movement, administrators can flag it early before it affects the next admissions cycle.
The overall outcome is a leadership team that can walk into a board or accreditation review already aligned on where the school network stands, without waiting on reports from multiple departments. This dashboard helps administrators prioritize interventions, defend budget requests with context, and track whether prior decisions on staffing and campus investment are paying off across the school year.
How to Analyze Data in an International Schools Executive Performance Dashboard
Here is how you can analyze data from this dashboard:
- Filter by Campus / Grade Division: Focus on performance for a specific school, campus, or age group.
- Set Start and End Dates: Align the analysis with a specific term or academic year.
- Compare Student vs. Teacher Retention: Identify potential links between staff turnover and student or family attrition.
- Compare New Enrollments vs. Curriculum Capacity: Assess enrollment demand by region and determine where additional sections may be needed.
- Review Revenue by Fee Category: Compare revenue distribution with fee collection rates to distinguish billing gaps from low demand.
- Track Monthly Discipline Incidents: Monitor trends to identify emerging behavioral patterns early.
- Filter by Region of Origin: Understand how the student enrollment mix is changing across different segments.
Benefits of an International Schools Executive Performance Dashboard
The following are the benefits of using this dashboard:
- Centralizes Leadership Data: Brings enrollment, revenue, and staffing data into one school executive reporting dashboard.
- Reduces Manual Reporting: Replaces spreadsheet consolidation with a filterable visual view for faster leadership reviews.
- Supports Fee Collection Analysis: Compares tuition revenue with ancillary fee categories to identify collection gaps.
- Improves Curriculum Demand Visibility: Shows demand by curriculum level so campuses can plan staffing ahead of enrollment cycles.
- Tracks Enrollment by Region: Maps new student enrollments across regions to support enrollment planning.
- Enables Cross-Campus Performance Tracking: Compares performance across campuses, curricula, and grade divisions.
- Creates a Shared Reference Point: Gives boards and accreditation teams one view instead of relying on siloed departmental reports.
KPIs to Track in an International Schools Executive Performance Dashboard
The following key KPIs can be tracked by using this dashboard:
- Total Student Enrollment (count): total enrolled students across all campuses and programs.
- Student Retention Rate (%): the share of students who remain enrolled from one period to the next.
- Fee Collection Rate (%): the proportion of billed tuition and fees actually collected.
- Student Awards Earned (Count): academic or extracurricular awards students received, reflecting program quality.
- Teacher Retention Rate (%): a core input for teacher retention rate tracking, showing staff turnover.
- Parent Satisfaction Score (%): a measure of family sentiment toward the school experience.
Frequently Asked Questions
1. Who should use the International Schools Executive Performance Dashboard?
School superintendents, heads of campus, finance leaders, and academic directors use it to review enrollment, revenue, and staffing performance together. It is built for leadership reviews rather than day-to-day classroom reporting.
2. Can this dashboard be customized for a specific curriculum or region?
Yes. The template includes filters for campus, curriculum, grade division, and region of origin, so you can adjust it using Mokkup's drag-and-drop editor to reflect your school's programs. This supports school executive reporting template needs across different network structures.
3. What data is needed to populate this dashboard?
You need enrollment records, fee and revenue data by category, staff retention figures, and discipline incident logs. Once added, the dashboard can be exported to Power BI or Tableau for further analysis.