
What is an International School Transportation Dashboard?
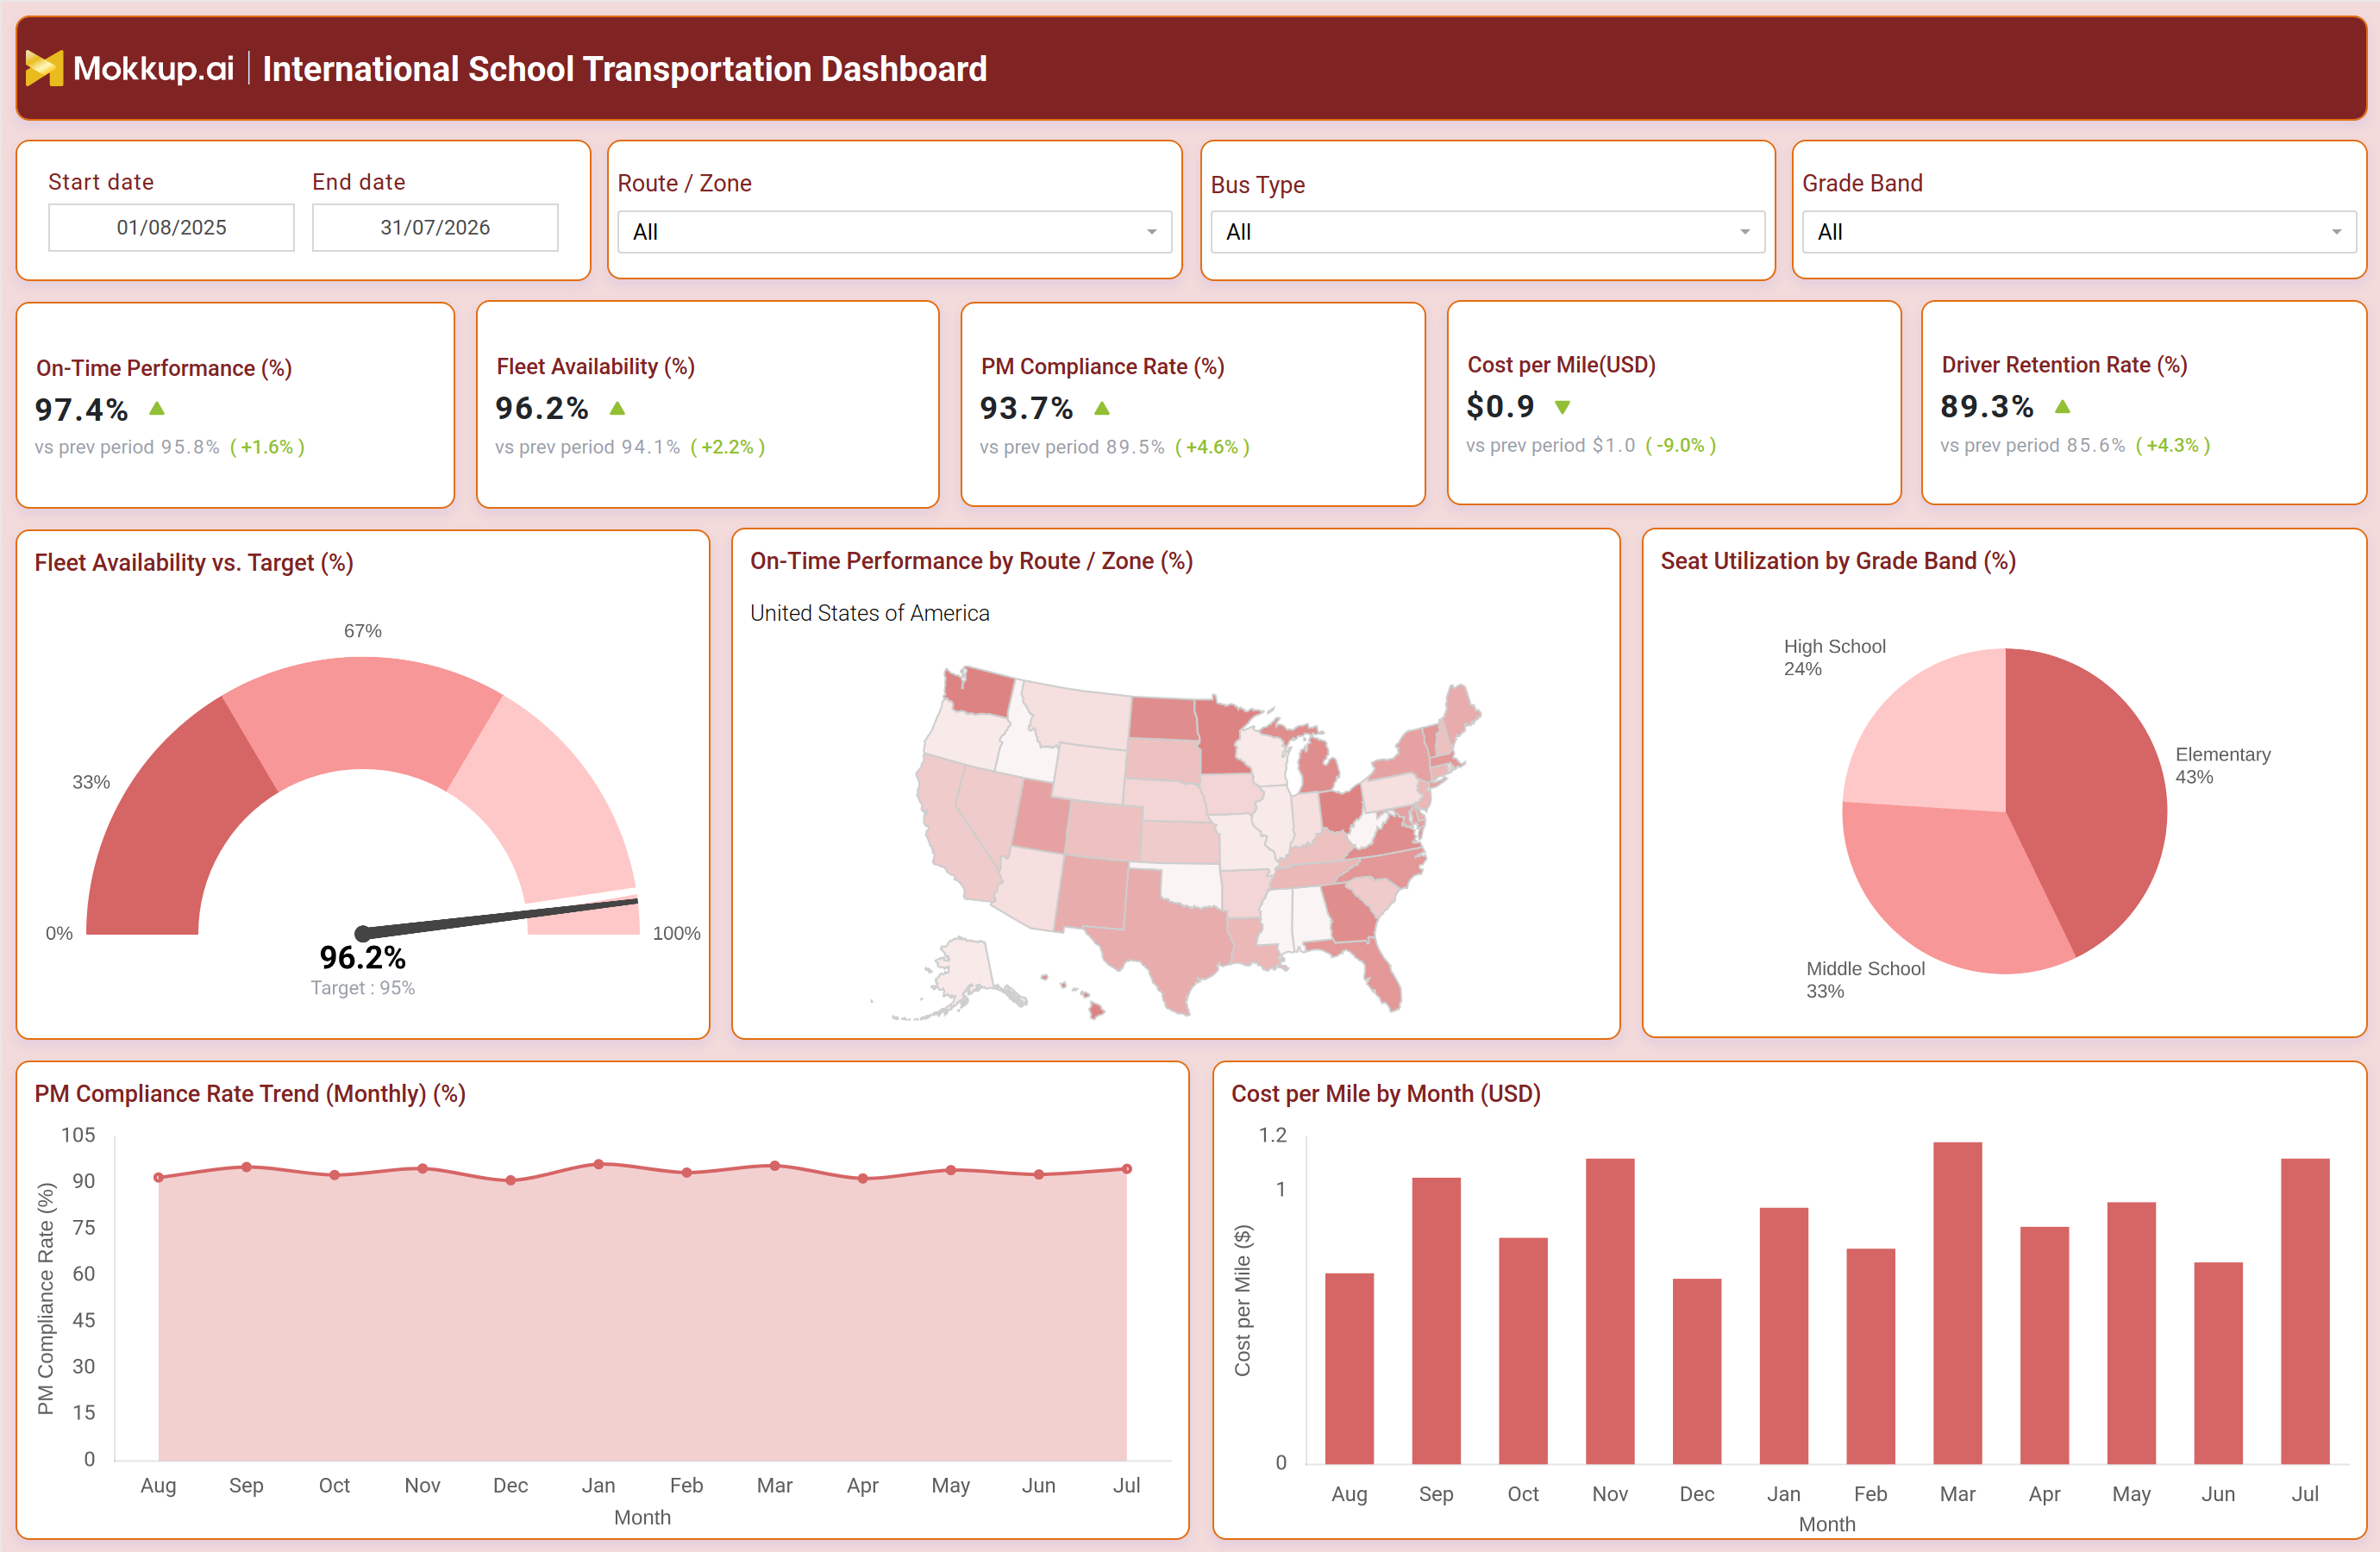
The International School Transportation Dashboard is a single-screen reporting template built for transportation directors and fleet operations teams at international schools who need one view of how their bus network performs across routes, vehicle types, and grade levels. It brings together on-time performance, fleet readiness, maintenance compliance, driver retention, and cost metrics so administrators do not have to piece together separate maintenance logs, driver rosters, and route reports to understand fleet health. Built-in filters for date range, Route/Zone, Bus Type, and Grade Band let a transportation coordinator narrow the view to a specific zone or vehicle category without editing the underlying report. Because school transportation directly affects student safety and daily attendance, having every operational signal on one screen makes this template useful for weekly operations reviews and board-level updates alike. Teams searching for an international school transportation dashboard get a starting structure that already reflects the metrics a transportation office is expected to report on, rather than a blank dashboard shell.
How to Create an International School Transportation Dashboard
You don't need to build your report from scratch; just start with a ready-to-use dashboard template from Mokkup. Add in your data and export it however you like. Here's how to do it:
1. Create or Log in to Your Mokkup Account
Start by signing up on Mokkup.ai using your email. If you already have an account, just log in, and you'll be good to go.
2. Choose and Customize Your Dashboard Template
Find the International School Transportation Dashboard template in the Templates section. Use the drag-and-drop editor to adjust KPIs, edit filters, or add elements based on your data.
3. Export to Your BI Tool
Once your dashboard wireframe is ready, use the BI Tool Export feature to send it directly to Power BI or Tableau for further analysis and enhancements. You can also download the dashboard as a PDF, PNG, or JPEG, embed it on a platform, or invite your team to collaborate.
Note: This is a Pro template. You'll need a Pro subscription on Mokkup to use and customize this dashboard wireframe. Upgrade anytime to unlock full access.
International School Transportation Dashboard Example
A transportation director for an international school system opens this dashboard at the start of each week to check whether the bus fleet is running the way it should across every zone the district serves. The question driving that visit is usually simple: are buses arriving on time, is the fleet ready to run, and are maintenance and staffing on track to support the upcoming week.On the screen, the director can identify which routes or zones are falling behind on arrival times by scanning the map view, then narrow in on that zone using the Route/Zone filter to understand whether the issue is isolated to one route or spreading across a wider area.
Fleet operations staff can compare vehicle readiness against the operating target to decide whether additional buses need to be pulled from reserve, and can track how preventive maintenance is trending month over month to decide if service schedules need tightening before a specific vehicle type starts causing delays. Planners can also review how seats are distributed across Elementary, Middle School, and High School riders to judge whether routes are sized correctly for each grade band. Beyond day-to-day monitoring, the same view supports monthly and annual planning. Finance and operations leaders can compare cost trends across months to spot seasonal spikes worth budgeting around, while HR partners can watch driver staffing trends to get ahead of shortages before they force route cancellations. Used consistently, the international school transportation dashboard turns a stack of maintenance logs, dispatch records, and driver rosters into a single reference point transportation teams can trust when making weekly and long-term operating decisions.
How to Analyze Data in an International School Transportation Dashboard
Here is how you can analyze data from this dashboard:
- Filter by Route/Zone to isolate which specific bus routes are dragging down on-time performance.
- Switch the Bus Type filter to compare reliability and cost patterns across vehicle categories.
- Use the Grade Band filter to review seat utilization separately for Elementary, Middle School, and High School riders.
- Check the Fleet Availability vs. Target gauge as part of fleet availability monitoring for school transportation to confirm readiness is holding above the operating threshold.
- Reference the On-Time Performance by Route/Zone map to spot which zones need dispatch or scheduling adjustments.
- Track the PM Compliance Rate Trend chart monthly to catch maintenance slippage early.
- Review the Cost per Mile by Month chart to identify seasonal cost spikes worth budgeting around.
- Adjust the Start and End date filters to compare performance across specific academic terms.
Benefits of an International School Transportation Dashboard
The following are the benefits of using this dashboard:
- Consolidates route, maintenance, and driver metrics into one school bus on-time performance tracking tool instead of scattered spreadsheets.
- Surfaces underperforming routes early through the Route/Zone map so dispatch issues get addressed before parent complaints rise.
- Supports budget planning with a clear cost per mile analysis for school bus fleets across the school year.
- Improves maintenance planning by keeping preventive maintenance compliance rate tracking dashboard data visible alongside fleet readiness.
- Helps HR and operations leaders monitor driver retention rates for school transportation trends before shortages disrupt routes.
- Gives administrators one screen to review during board meetings instead of compiling separate transportation reports.
KPIs to Track in an International School Transportation Dashboard
The following key KPIs can be tracked by using this dashboard:
- On-Time Performance (%) - measures the share of school bus routes arriving at stops within the scheduled window, a core signal of service reliability.
- Fleet Availability (%) - tracks the percentage of the total bus fleet ready for daily dispatch, reflecting how well fleet availability monitoring for school transportation is maintained against unplanned downtime.
- PM Compliance Rate (%) - reports adherence to scheduled preventive maintenance compliance rate tracking dashboard targets rather than reactive servicing.
- Cost per Mile (USD) - calculates average operating cost for every mile driven, supporting a cost per mile analysis for school bus fleets across budget periods.
- Driver Retention Rate (%) - measures the percentage of drivers retained over the reporting period, a leading indicator of staffing stability for driver retention rate monitoring for school transportation.
Frequently Asked Questions
1. What does the International School Transportation Dashboard track?
It tracks on-time performance, fleet availability, preventive maintenance compliance, driver retention, cost per mile, and seat utilization by grade band. Filters for date range, Route/Zone, Bus Type, and Grade Band let transportation teams narrow these metrics to a specific segment of the fleet.
2. Who should use this dashboard template?
Transportation directors, fleet operations managers, and school administrators responsible for busing budgets and driver staffing get the most value from this school bus on-time performance tracking tool. It is also useful for board reporting, since it summarizes fleet health without requiring separate maintenance or HR reports.
3. Can I customize the dashboard for my school district's data?
Yes. The template is built in Mokkup's drag-and-drop editor, so KPIs, filters, and charts can be adjusted to match your district's route structure and vehicle categories. Once customized, it exports directly to Power BI or Tableau, or downloads as PDF, PNG, or JPEG.