
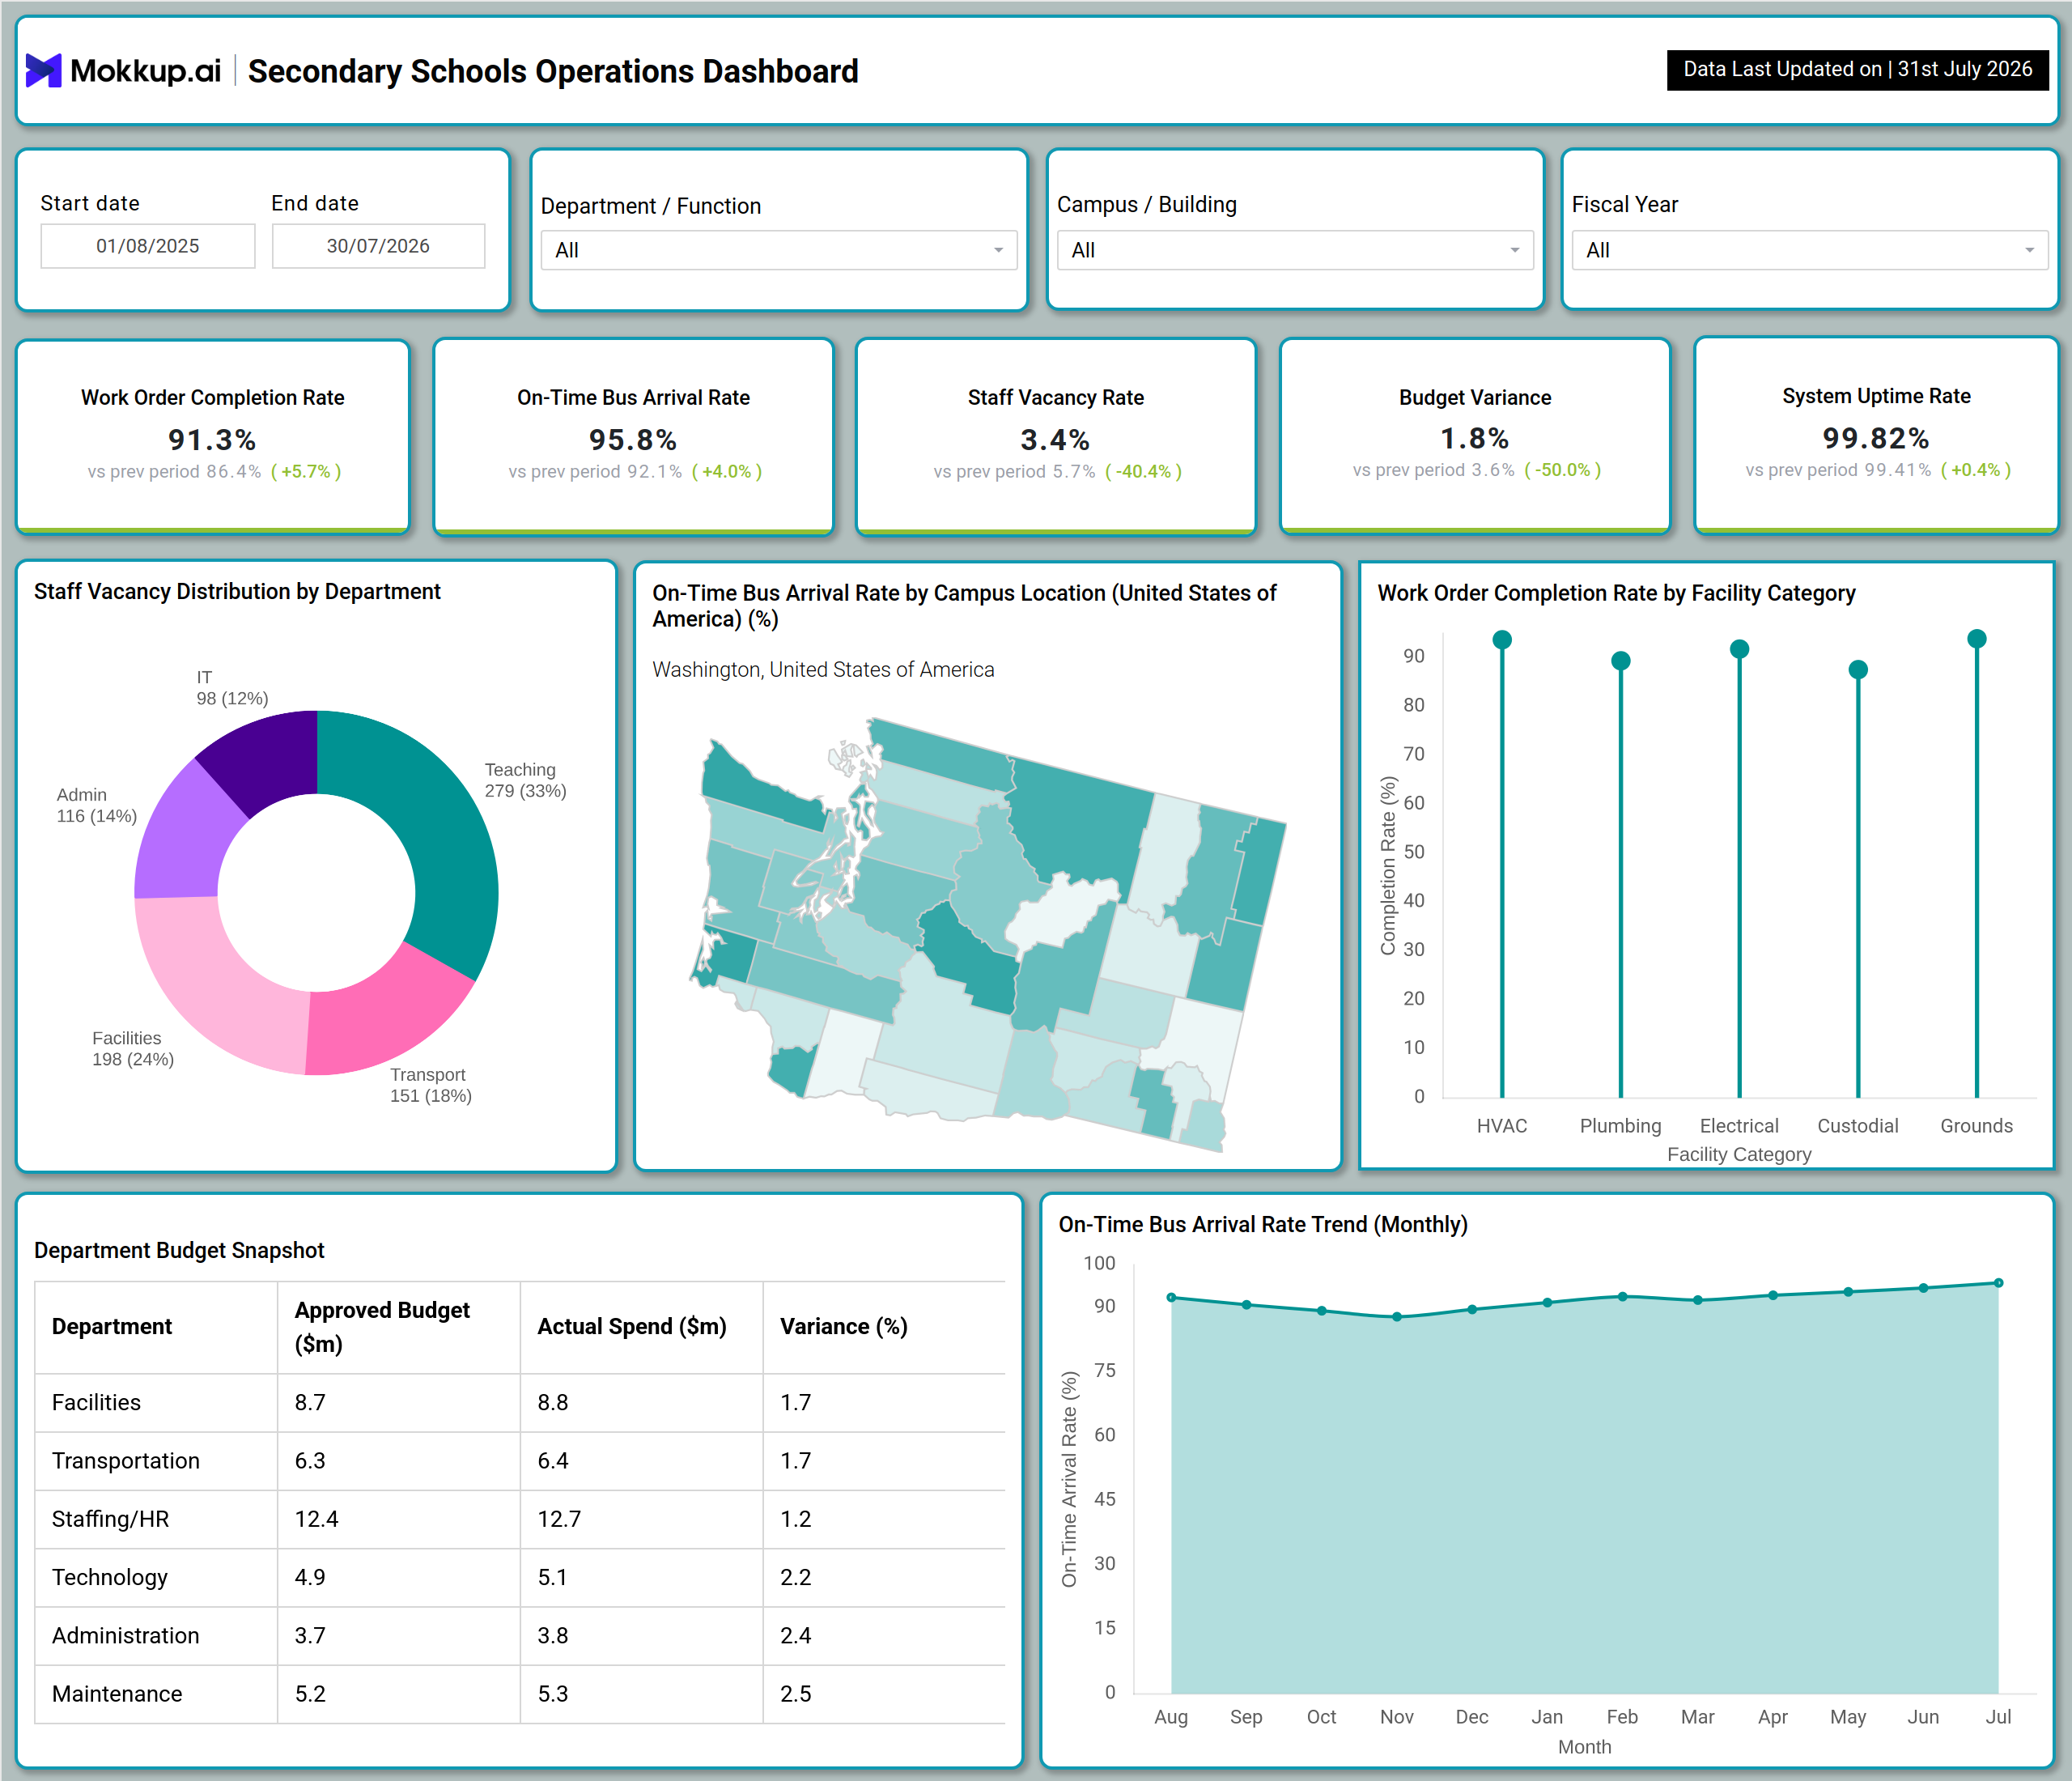
What is a Secondary Schools Operations Dashboard
The Secondary Schools Operations Dashboard is a single-screen reporting template designed for facilities, transportation, and administrative teams that manage the daily operational backbone of a secondary school system. As a secondary school operations dashboard, it brings together maintenance, transportation, staffing, budget, and technology performance into one connected view, replacing the separate spreadsheets and departmental reports operations leaders usually rely on. Built for district facilities directors, transportation coordinators, and school business officers, the dashboard consolidates work order completion, bus arrival performance, staff vacancy levels, budget variance, and system uptime into a single filterable layout. Teams can adjust the view by date range, department or function, campus or building, and fiscal year to focus on whichever segment needs attention in a given review cycle. Because every metric sits within a single connected template, operations staff spend less time compiling manual updates and more time addressing the maintenance backlog, transportation gaps, or staffing shortages that need it most.
How to Create a Secondary Schools Operations Dashboard
You don't need to build your report from scratch; just start with a ready-to-use dashboard template from Mokkup. Add in your data and export it however you like. Here's how to do it:
1. Create or Log in to Your Mokkup Account
Start by signing up on Mokkup.ai using your email. If you already have an account, just log in, and you'll be good to go.
2. Choose and Customize Your Dashboard Template
Find the Secondary Schools Operations Dashboard template in the Templates section. Use the drag-and-drop editor to adjust KPIs, edit filters, or add elements based on your data.
3. Export to Your BI Tool
Once your dashboard wireframe is ready, use the BI Tool Export feature to send it directly to Power BI or Tableau for further analysis and enhancements. You can also download the dashboard as a PDF, PNG, or JPEG, embed it on a platform, or invite your team to collaborate.
Note: This is a Pro template. You'll need a Pro subscription on Mokkup to use and customize this dashboard wireframe. Upgrade anytime to unlock full access.
Secondary Schools Operations Dashboard Example
A district facilities director typically opens this secondary school operations dashboard at the start of a review cycle to understand whether campus operations are on track before a board meeting or budget review. The goal is usually to answer a specific question: are work orders being closed fast enough, are buses running on schedule, and is staffing keeping pace with needs across campuses? Rather than pulling separate reports from the maintenance team, the transportation office, and HR, the director scans one screen and immediately knows where attention is needed.
From there, the facilities team can compare completion performance across categories like HVAC, plumbing, electrical, custodial, and grounds work to identify which facility type is falling behind and needs additional staffing or contractor support. Transportation coordinators can track on-time bus arrival performance by campus location and monitor how it shifts month to month, helping them decide where route adjustments or additional buses are needed before the next semester. HR and staffing leads can review vacancy distribution by department to see whether hiring gaps are concentrated in teaching, facilities, transport, admin, or IT roles, which shapes recruiting priorities for the term ahead.
Finance and administration teams can compare approved budgets against actual spend at the department level to catch departments trending over variance early enough to correct course before the fiscal year closes. Used together, these views help school operations leaders move from reactive firefighting to proactive planning, prioritizing maintenance work, transportation routes, hiring, and budget decisions based on what the data shows rather than anecdotal reports. Over a semester, this dashboard becomes the reference point operations staff return to before every leadership check-in, giving them a defensible, evidence-based way to explain what changed and why.
How to Analyze Data in a Secondary Schools Operations Dashboard
Here is how you can analyze data from this dashboard:
- Analyze operational performance: Filter by date range, department, campus, or fiscal year to evaluate a specific reporting segment.
- Monitor maintenance efficiency: Compare Work Order Completion Rate across facility categories to identify maintenance areas falling behind.
- Track transportation reliability: Review the monthly On-Time Bus Arrival Rate trend to monitor school transportation performance over time.
- Prioritize recruitment efforts: Analyze Staff Vacancy Distribution by department to identify areas with the greatest hiring needs.
- Monitor budget performance: Compare the Department Budget Snapshot with approved budgets to identify departments exceeding planned spending.
- Connect IT and facilities performance: Review System Uptime Rate alongside work order data to understand how technology reliability impacts facility operations.
- Identify underperforming locations: Use the campus and building filters to isolate sites that require targeted operational improvements.
Benefits of a Secondary Schools Operations Dashboard
The following are the benefits of using this dashboard:
- Centralize school operations: Combine facilities, transportation, staffing, budget, and technology metrics into a single secondary school operations dashboard.
- Track maintenance performance: Monitor work order completion rates across campuses to improve facility management.
- Monitor staffing gaps: Track staff vacancy rates to identify hiring needs before they impact school operations.
- Improve budget accountability: Monitor department budget variances to identify overspending and support better financial control.
- Speed up operational reviews: Filter data by campus, department, and fiscal year for faster leadership reporting.
- Support data-driven decisions: Use operational insights to optimize maintenance staffing, bus routing, and budget allocation.
- Customize and export easily: Start with a Mokkup template and quickly customize or export the dashboard to Power BI or Tableau.
KPIs to Track in a Secondary Schools Operations Dashboard
The following key KPIs can be tracked by using this dashboard:
- Work Order Completion Rate - measures the share of maintenance work orders resolved within the reporting period, forming the basis of a work order completion rate tracking tool for facilities teams.
- On-Time Bus Arrival Rate - tracks the percentage of bus routes arriving within scheduled time windows across campuses, supporting school bus on-time arrival rate monitoring.
- Staff Vacancy Rate - shows the proportion of open positions against total budgeted staff, broken down by Teaching, Facilities, Transport, Admin, and IT.
- Budget Variance - captures the percentage difference between approved and actual departmental spend, the core metric behind this department budget variance tracking dashboard.
- System Uptime Rate - supports facility maintenance system uptime monitoring by measuring the reliability of technology systems behind maintenance and facilities operations.
Frequently Asked Questions
1. What is a Secondary Schools Operations Dashboard used for?
It consolidates facilities, transportation, staffing, and budget performance into one view so operations leaders can track how a secondary school system is running without checking separate reports. It supports faster reviews across campuses, departments, and fiscal years.
2. Which teams benefit most from this dashboard?
Facilities directors, transportation coordinators, HR and staffing leads, and school business officers all use this secondary school operations dashboard to monitor their respective areas from a single screen. It also gives district leadership a consolidated view for board reporting.
3. How does system uptime fit into school operations tracking?
System Uptime Rate sits alongside facilities and transportation metrics because reliable operational technology underpins maintenance ticketing, transportation routing, and budget reporting. Facility maintenance system uptime monitoring helps operations teams catch technology outages before they disrupt daily school operations.