
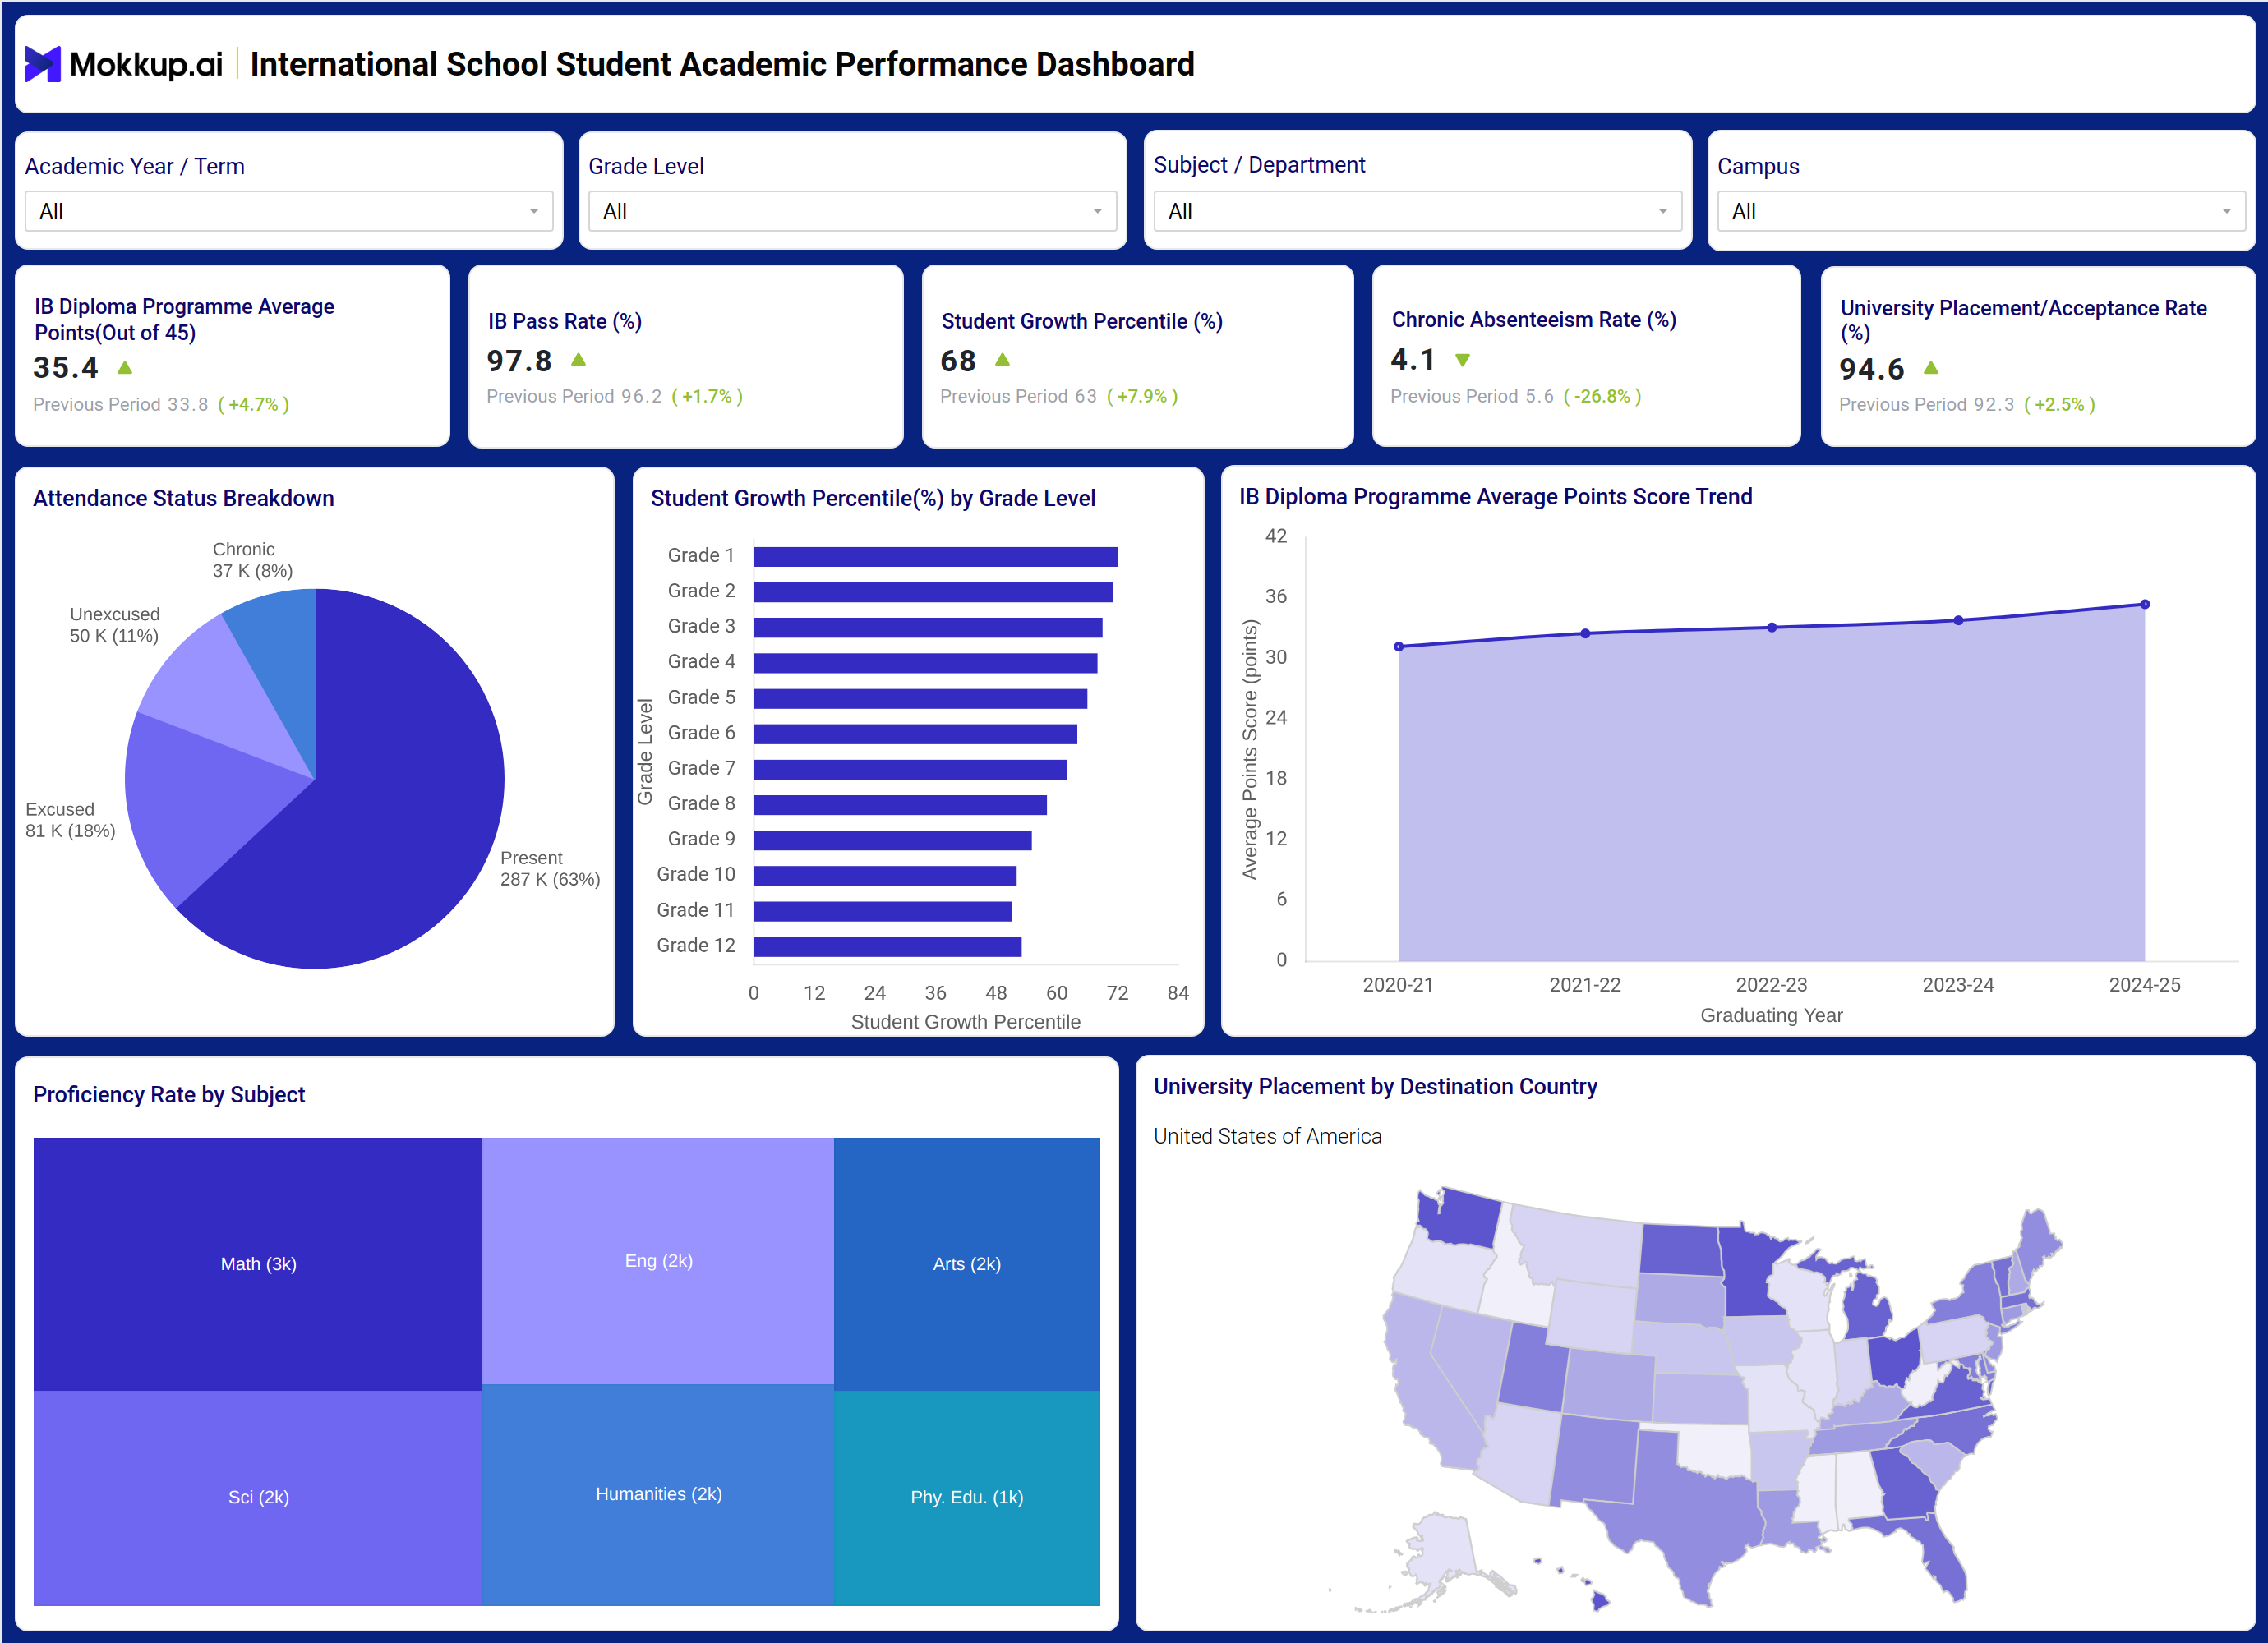
What is an International School Student Academic Performance Dashboard?
The International School Student Academic Performance Dashboard is a monitoring tool built for school leadership, academic coordinators, and IB program administrators who need a single view of learning outcomes across grade levels, subjects, and campuses. It consolidates IB Diploma Programme scores, pass rates, growth percentile trends, attendance patterns, and university placement outcomes into one interface, replacing scattered spreadsheets and static reports assembled at term end.
As an IB Diploma Programme average points tracking tool, it lets academic teams see how diploma performance is trending well before a report card cycle closes, while student growth percentile monitoring by grade level highlights where progress is accelerating or stalling. The dashboard filters data by academic year or term, grade level, subject or department, and campus, so a director overseeing multiple campuses can isolate performance for one site or compare it across the network. Paired with a proficiency rate by subject dashboard for schools view, it goes beyond diploma scores to show where curriculum reinforcement is needed most, giving international school administrators one consistent reference point for tracking each cohort's progress toward graduation and beyond.
How to Create an International School Student Academic Performance Dashboard
You don't need to build your report from scratch; just start with a ready-to-use dashboard template from Mokkup. Add in your data and export it however you like. Here's how to do it:
1. Create or Log in to Your Mokkup Account
Start by signing up on Mokkup.ai using your email. If you already have an account, just log in, and you'll be good to go.
2. Choose and Customize Your Dashboard Template
Find the International School Student Academic Performance Dashboard template in the Templates section. Use the drag-and-drop editor to adjust KPIs, edit filters, or add elements based on your data.
3. Export to Your BI Tool
Once your dashboard wireframe is ready, use the BI Tool Export feature to send it directly to Power BI or Tableau for further analysis and enhancements. You can also download the dashboard as a PDF, PNG, or JPEG, embed it on a platform, or invite your team to collaborate.
Note: This is a Pro template. You'll need a Pro subscription on Mokkup to use and customize this dashboard wireframe. Upgrade anytime to unlock full access.
International School Student Academic Performance Dashboard Example
An academic director opens this dashboard ahead of a leadership review to understand whether the current cohort is on track for its IB Diploma outcomes and where intervention is needed before the term ends. Rather than requesting separate exports from teachers and administrators, they filter by academic year and campus to get an immediate read on how the graduating class compares to prior years.From there, the coordinator can track whether diploma point averages and pass rates are moving in the right direction relative to prior terms, and identify which grade levels are showing the strongest or weakest growth percentile gains. If a particular grade is lagging in growth, the team can drill into subject-level proficiency to determine whether the gap concentrates in a specific department such as math or humanities, or is spread evenly across subjects.
Attendance patterns sit alongside academic outcomes, so counselors can compare chronic absenteeism trends against growth and proficiency to flag students or grade bands where attendance issues are dragging down performance. When placement season approaches, the same view lets staff assess how acceptance and placement rates are shaping up by destination country, helping college counseling teams prioritize outreach and support for cohorts heading into competitive admissions cycles.Taken together, the dashboard gives international school leadership a single reference point for connecting attendance, academic growth, and university outcomes, so decisions about staffing, intervention programs, and counseling resources are grounded in a full picture of the student journey rather than isolated metrics viewed in silos.
How to Analyze Data in an International School Student Academic Performance Dashboard
Here is how you can analyze data from this dashboard:
- Filter by academic year or term to compare current performance against prior periods
- Segment by grade level to support student growth percentile monitoring by grade level and pinpoint where gains concentrate
- Break down results by subject or department to spot proficiency gaps across disciplines
- Compare campuses side by side when the school operates more than one location
- Cross-reference attendance status breakdown against growth and pass rate trends
- Track the IB Diploma Programme Average Points Score Trend across graduating years to spot momentum
- Review university placement by destination country to align counseling resources with acceptance patterns
Benefits of an International School Student Academic Performance Dashboard
The following are the benefits of using this dashboard:
- Consolidates diploma outcomes, attendance, and placement data into one international school student academic performance dashboard
- Functions as a proficiency rate by subject dashboard for schools to spot curriculum strengths and gaps early
- Reduces manual reporting time for academic coordinators and school leadership
- Surfaces grade-level and subject-level gaps before they affect graduation outcomes
- Supports chronic absenteeism rate tracking for international schools alongside academic outcomes
- Gives counseling teams a clear view for university placement rate analysis for international schools by destination
- Standardizes reporting across multiple campuses within the same network
KPIs to Track in an International School Student Academic Performance Dashboard
The following key KPIs can be tracked by using this dashboard:
- IB Diploma Programme Average Points: measures the average diploma score earned by students out of 45, indicating overall academic rigor and preparedness
- IB Pass Rate: tracks the percentage of students who successfully pass the IB Diploma Programme requirements
- Student Growth Percentile: shows how much academic progress students are making relative to peers, independent of starting achievement level
- Chronic Absenteeism Rate: supports chronic absenteeism rate tracking for international schools by measuring the share of students missing significant instructional time
- University Placement/Acceptance Rate: tracks the percentage of graduating students accepted into university programs, reflecting counseling effectiveness
Frequently Asked Questions
1. What data does the International School Student Academic Performance Dashboard track?
It tracks IB Diploma Programme outcomes, student growth percentile, attendance patterns, subject-wise proficiency, and university placement rates across this international school student academic performance dashboard. Filters for academic year, grade level, subject, and campus let teams narrow the view to any cohort.
2. How often should schools update this dashboard?
Most international schools refresh the data each term or academic year to align with grading cycles and IB reporting periods. Consistent updates make the IB diploma programme average points tracking tool useful for spotting trends rather than one-off snapshots.
3. Can this dashboard support college counseling decisions?
Yes. The university placement rate analysis for international schools helps counseling teams see acceptance rates by destination country and connect them to academic growth and attendance trends, supporting more targeted student guidance.