
What is a Secondary School Students Academic Performance Dashboard?
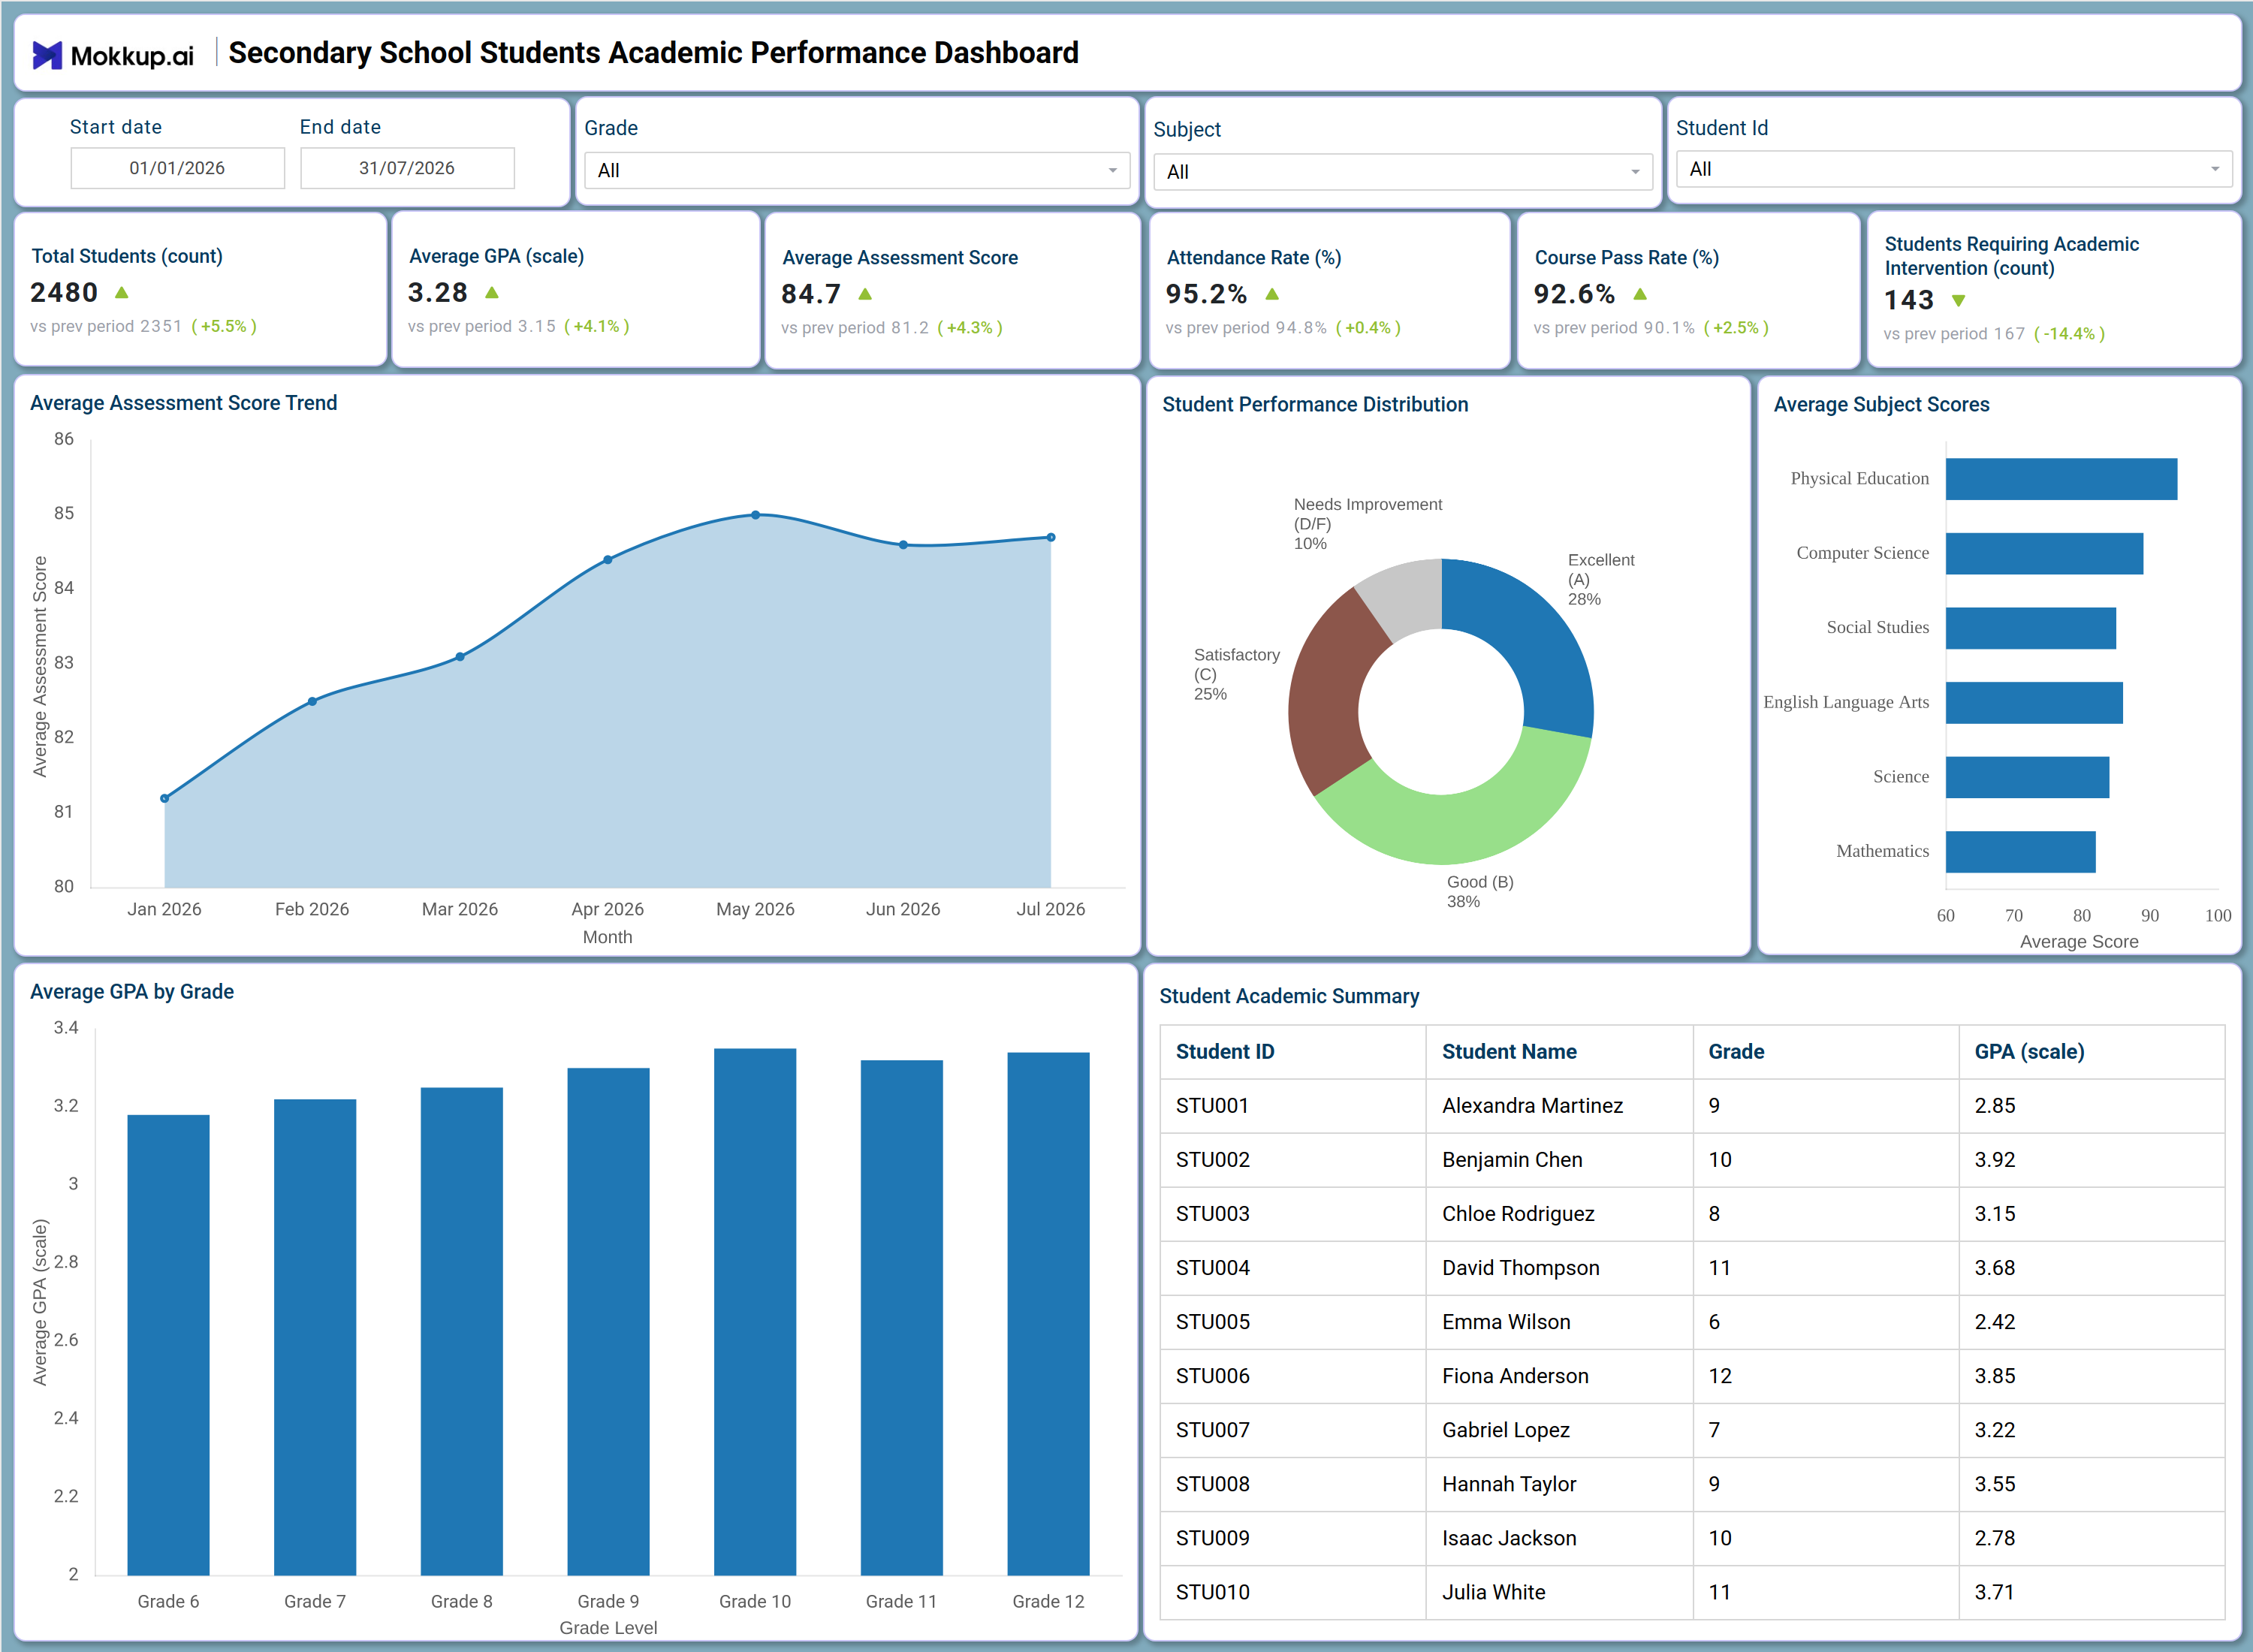
The Secondary School Students Academic Performance Dashboard is a secondary school academic performance dashboard built for school administrators, academic coordinators, and grade-level counselors who need one view of how students are performing across grades and subjects. It consolidates enrollment counts, grade point averages, assessment scores, attendance, course completion, and intervention flags into a single structured template, replacing scattered spreadsheets and manual grade-book exports. Counselors use it to spot which grades or subjects are falling behind before report cards are issued, while academic leads rely on it to prioritize which students need an academic intervention tracking dashboard review before a marking period closes. Built on the Mokkup platform, the wireframe can be customized with a school's own data and filtered by grade, subject, or student ID to support ongoing academic planning.
How to Create a Secondary School Students Academic Performance Dashboard
You don't need to build your report from scratch; just start with a ready-to-use dashboard template from Mokkup. Add in your data and export it however you like. Here's how to do it:
1. Create or Log in to Your Mokkup Account
Start by signing up on Mokkup.ai using your email. If you already have an account, just log in, and you'll be good to go.
2. Choose and Customize Your Dashboard Template
Find the Secondary School Students Academic Performance Dashboard template in the Templates section. Use the drag-and-drop editor to adjust KPIs, edit filters, or add elements based on your data.
3. Export to Your BI Tool
Once your dashboard wireframe is ready, use the BI Tool Export feature to send it directly to Power BI or Tableau for further analysis and enhancements. You can also download the dashboard as a PDF, PNG, or JPEG, embed it on a platform, or invite your team to collaborate.
Note: This is a Pro template. You'll need a Pro subscription on Mokkup to use and customize this dashboard wireframe. Upgrade anytime to unlock full access.
Secondary School Students Academic Performance Dashboard Example
A vice principal or academic coordinator typically opens this dashboard at the start of a review cycle to answer one question: is the school gaining ground academically, or losing it heading into the next assessment period? Filtering by the current term while leaving grade, subject, and student ID open at first gives a school-wide read before narrowing into any one group.From there, the coordinator compares how grade point averages have shifted across grade levels, using what functions as a student GPA tracking dashboard template view to see whether upper grades are pulling ahead of lower ones or whether a particular grade needs extra support. Reviewing the monthly trend in assessment scores lets the team confirm whether recent instructional changes are working or whether scores have plateaued.
Looking at how students are spread across performance bands through a student performance distribution dashboard lens, helps leadership judge whether the lowest-performing group is shrinking, and comparing average scores subject by subject shows planners exactly where a curriculum or staffing gap is forming. Because attendance and course completion sit alongside academic metrics, the same review connects a dip in scores to attendance rate tracking dashboard school signals, helping the team decide whether an intervention should target instruction, attendance, or both. The student-level summary table lets a counselor move from a school-wide pattern straight down to the individual students driving it, without switching tools. Together, these views turn a term's worth of grades and attendance records into a specific, actionable list of students, grades, or subjects the academic team can act on before the next reporting period.
How to Analyze Data in a Secondary School Students Academic Performance Dashboard
Here is how you can analyze data from this dashboard:
- Filter by Grade to isolate performance patterns for a single grade level before comparing it against the rest of the school.
- Use the Subject filter to narrow every chart down to one subject area during a curriculum review.
- Select a specific Student Id to pull up an individual academic record without scrolling through the full table.
- Adjust the Start date and End date range to compare performance across different terms or semesters.
- Monitor the Monthly Average Assessment Score Trend chart to catch a decline in scores before it affects report cards.
- Review the Student Performance Distribution donut chart, a student performance distribution dashboard view, to track how many students fall into the Needs Improvement band.
- Compare the Average Subject Scores bar chart to identify which subjects are dragging down overall academic results.
- Use the Average GPA by Grade chart to spot which grade levels need additional academic support.
- Scan the Student Academic Summary table to identify specific students who need an academic intervention tracking dashboard follow-up.
Benefits of a Secondary School Students Academic Performance Dashboard
The following are the benefits of using this dashboard:
- Centralizes GPA, assessment scores, attendance, and course completion in one secondary school academic performance dashboard.
- Reduces manual grade-book compilation with pre-built KPI tiles and chart layouts.
- Supports grade-by-grade comparison so academic leads can prioritize support where it is needed most.
- Highlights subject-level score gaps to guide curriculum and staffing decisions.
- Surfaces students requiring an academic intervention tracking dashboard review before performance declines further.
- Gives counselors and administrators a shared student GPA tracking dashboard template for planning meetings.
- Functions as a course pass rate monitoring tool for department heads planning end-of-term support.
- Speeds up reporting cycles by replacing static spreadsheets with a filterable, structured template.
KPIs to Track in a Secondary School Students Academic Performance Dashboard
The following key KPIs can be tracked by using this dashboard:
- Total Students (count): Tracks total enrollment covered by the dashboard, providing the base against which every other academic metric is measured.
- Average GPA (scale): Reflects overall academic standing across the student body and anchors the student GPA tracking dashboard template view.
- Average Assessment Score (%): Measures how students are performing on graded assessments across the selected period.
- Attendance Rate (%): Supports attendance rate tracking dashboard school analysis by showing how consistently students are present for instruction.
- Course Pass Rate (%): Functions as a course pass rate monitoring tool, quantifying the share of students completing coursework successfully each term.
- Students Requiring Academic Intervention (count): Flags students falling behind, feeding directly into the academic intervention tracking dashboard workflow.
Frequently Asked Questions
1. What industries benefit most from this Secondary School Students Academic Performance Dashboard?
Secondary schools, school districts, and academic coordinators benefit most from this dashboard. Counselors, vice principals, and instructional leads use it to track grades, attendance, and intervention needs in one place.
2. Can this dashboard track which students need academic intervention?
Yes. The Students Requiring Academic Intervention KPI and the Student Academic Summary table work together to flag and list students falling behind, supporting the academic intervention tracking dashboard workflow.
3. Is this dashboard suitable for comparing performance across grade levels?
Yes. The Average GPA by Grade chart and the Grade filter let administrators compare grade levels side by side, making it well suited to a student GPA tracking dashboard template use case.