
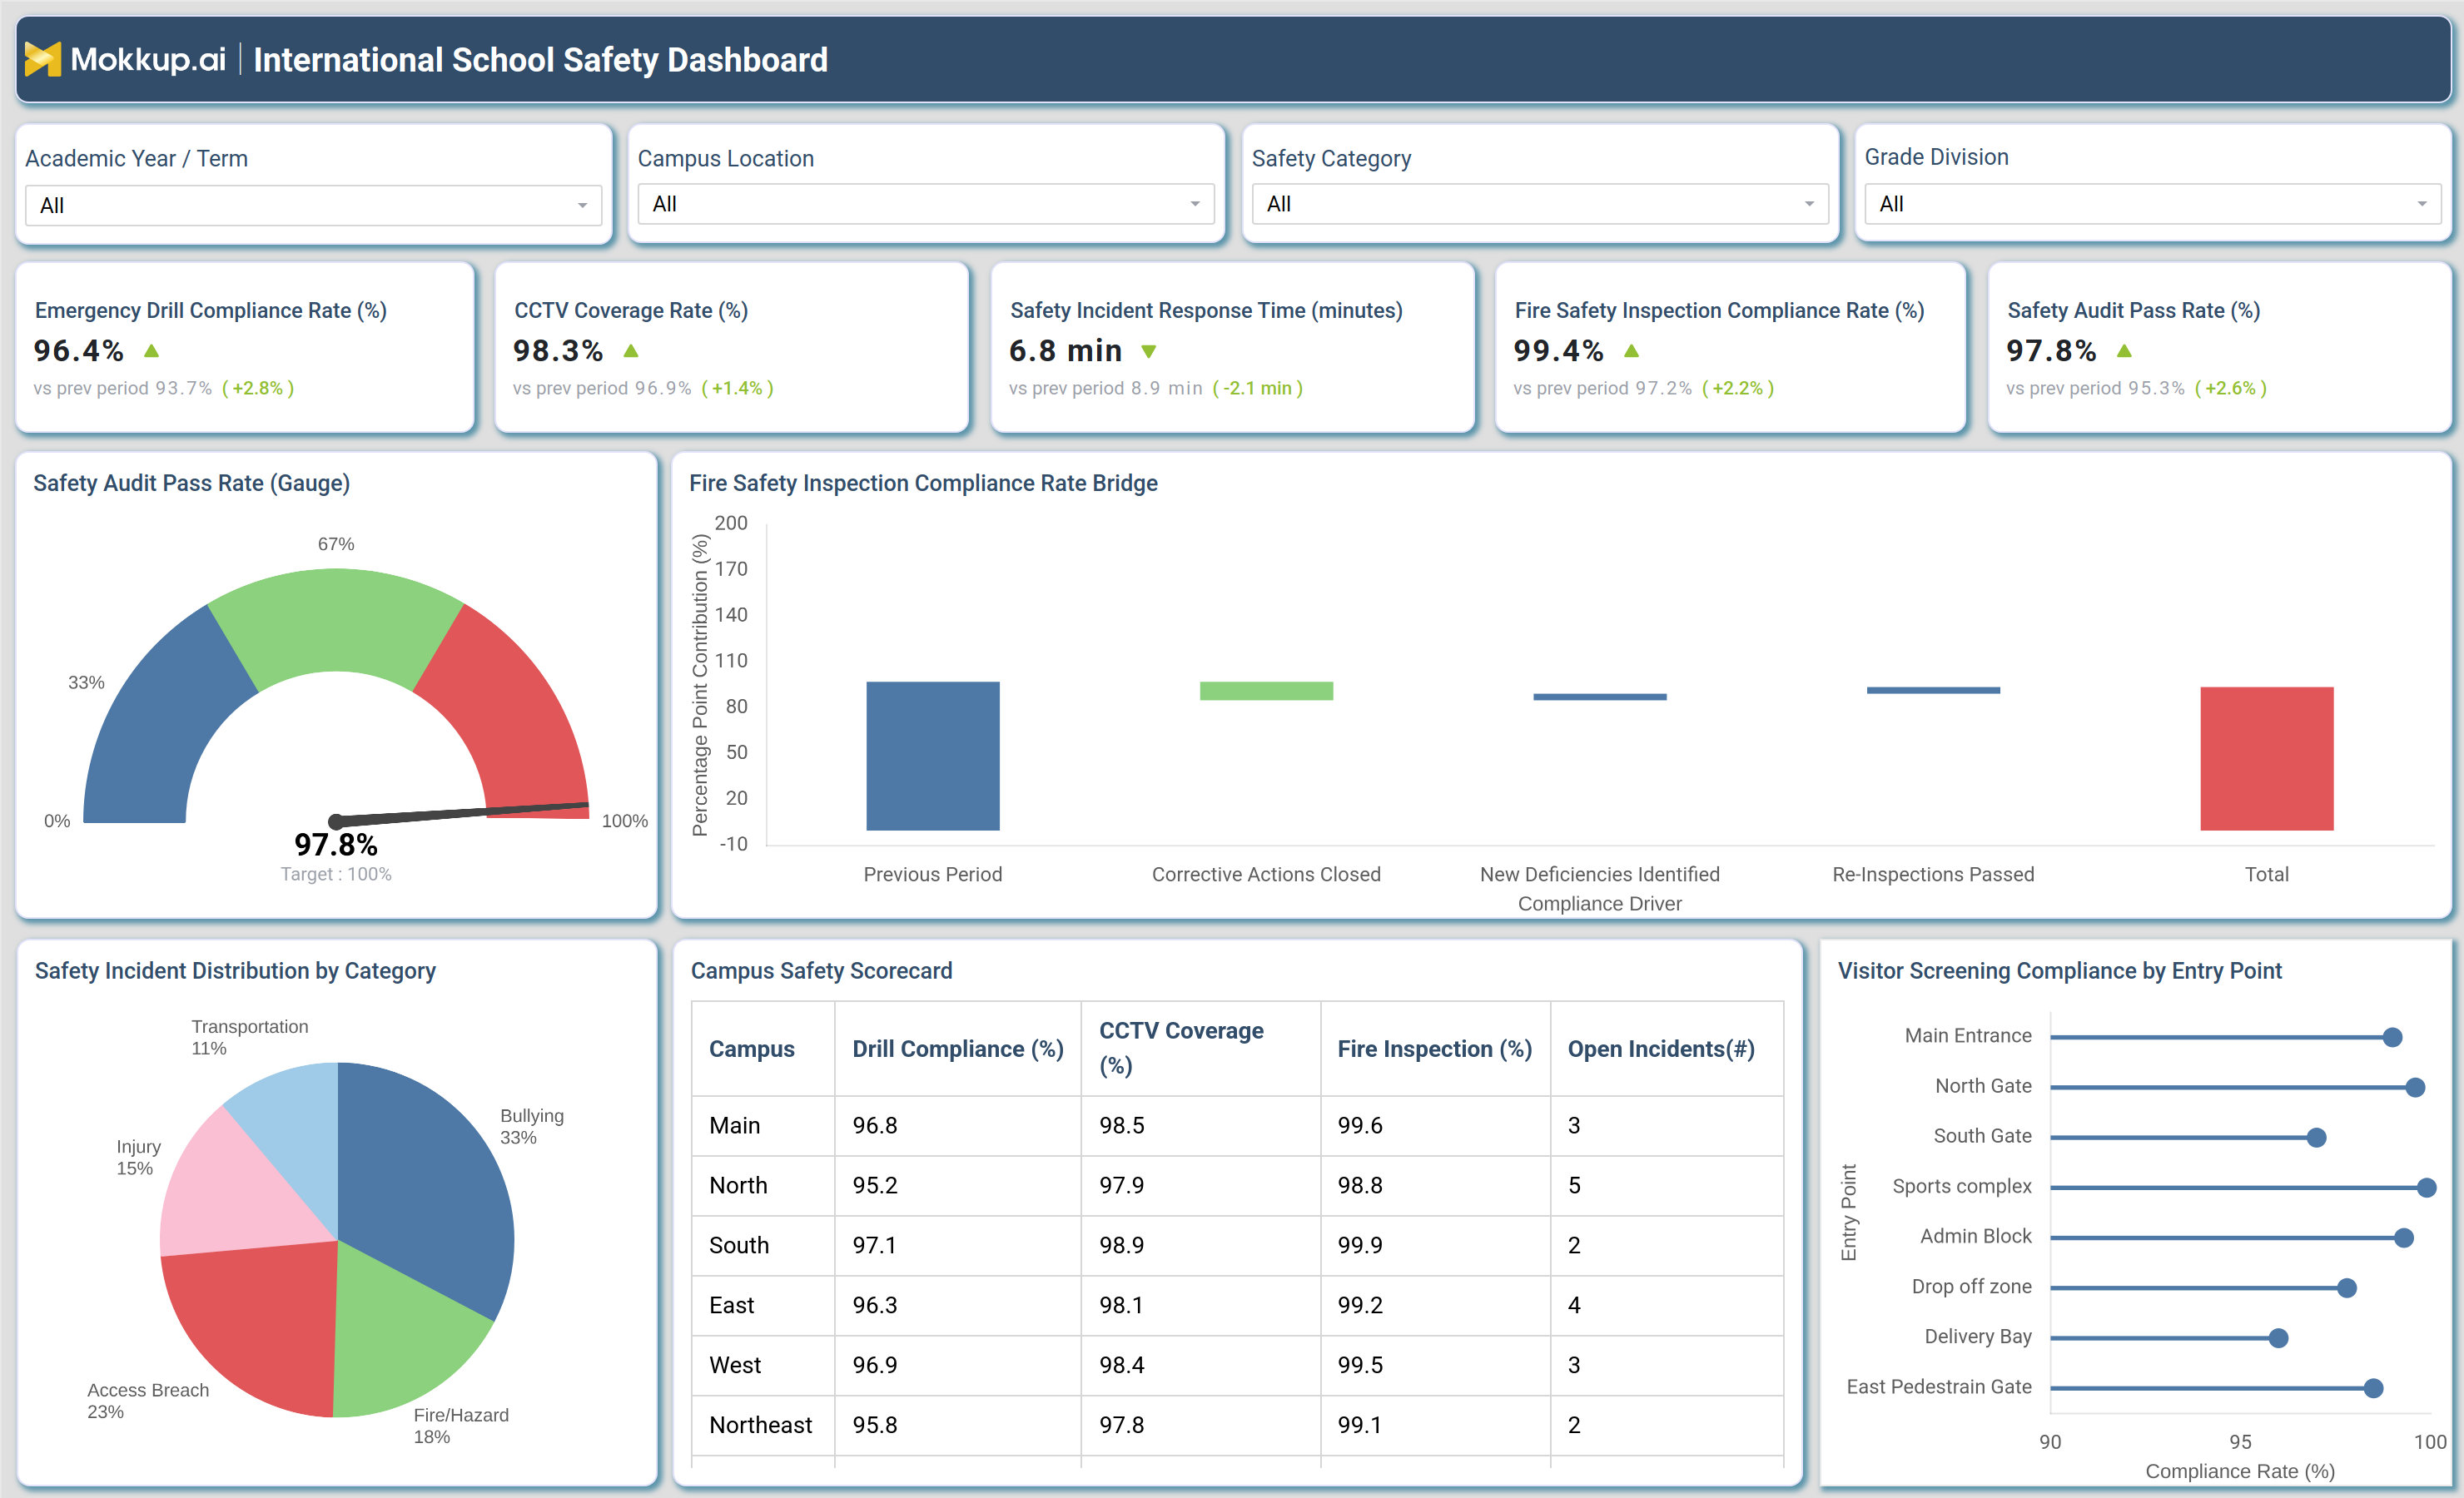
What is an International School Safety Dashboard?
The International School Safety Dashboard is a single-screen reporting template built for campus safety officers, facilities managers, and school administrators who need one view of how well a campus protects students, staff, and visitors. It consolidates emergency drill performance, camera coverage, fire safety inspections, and incident response data so safety teams do not have to compile separate drill logs, CCTV audit sheets, and inspection reports before every review. Filters for Academic Year/Term, Campus Location, Safety Category, and Grade Division let a safety officer narrow the view to a specific site or incident type. Teams searching for an emergency drill compliance rate tracking tool get a structure that already benchmarks drill completion, screening compliance, and audit performance side by side. It also supports safety incident distribution tracking for international schools, breaking cases down by category so leadership can see what is driving volume at a given campus. Used consistently, this international school safety dashboard turns compliance paperwork into one trusted reference point.
How to Create an International School Safety Dashboard
You don’t need to build your report from scratch, just start with a ready-to-use dashboard template from Mokkup. Add in your data and export it however you like. Here’s how to do it:
1. Create or Log in to Your Mokkup Account
Start by signing up on Mokkup.ai using your email. If you already have an account, just log in, and you'll be good to go.
2. Choose and Customize Your Dashboard Template
Find the International School Safety Dashboard template in the Templates section. Use the drag-and-drop editor to adjust KPIs, edit filters, or add elements based on your data.
3. Export to Your BI Tool
Once your dashboard wireframe is ready, use the BI Tool Export feature to send it directly to Power BI or Tableau for further analysis and enhancements. You can also download the dashboard as a PDF, PNG, or JPEG, embed it on a platform, or invite your team to collaborate.
Note: This is a Pro template. You'll need a Pro subscription on Mokkup to use and customize this dashboard wireframe. Upgrade anytime to unlock full access.
International School Safety Dashboard Example
A campus safety officer at an international school opens this dashboard at the start of a term to check whether every campus is prepared for an emergency and whether physical security measures are holding steady. The question guiding that review is straightforward: are drills being completed, is camera coverage sufficient, and are fire inspections passing without lingering issues? From the single screen, the officer can identify whether drill completion, camera coverage, and audit performance are improving or slipping, then filter by Campus Location to see whether one site is falling behind.
When fire inspection compliance shifts, the officer can separate how much came from corrective actions closed versus new deficiencies identified, helping prioritize follow-up before the next inspection cycle. Reviewing how incidents break down by category helps the team decide where to invest first, whether that means reinforcing anti-bullying programs or tightening access control. Comparing campuses on the safety scorecard makes it easy to spot which site needs support, while scanning entry-point screening compliance shows facilities teams where visitor check-in procedures need reinforcement. Used this way, the dashboard shifts safety management from reacting to individual incidents toward planning ahead, giving international school leadership one consistent way to confirm every campus meets the same safety standard regardless of size or location.
How to Analyze Data in an International School Safety Dashboard
Here is how you can analyze data from this dashboard:
- Filter by Campus Location to compare drill compliance, CCTV coverage, and audit performance across sites.
- Use the Grade Division filter to compare safety compliance across elementary, middle, and high school cohorts.
- Check the Safety Audit Pass Rate gauge against its target to see how close each campus is to full compliance.
- Break down the Fire Safety Inspection Compliance Rate Bridge to separate corrective actions closed from new deficiencies.
- Use the Safety Incident Distribution by Category chart to identify which incident type drives overall case volume.
- Cross-check the Campus Safety Scorecard to compare drill compliance, CCTV coverage, and open incidents by campus.
- Run visitor screening compliance rate analysis for schools by scanning entry points for weak checkpoints.
- Rely on this emergency drill compliance rate tracking tool each term to confirm every campus completed its drills.
Benefits of an International School Safety Dashboard
The following are the benefits of using this dashboard:
- Provides one view of emergency preparedness, camera coverage, and fire compliance for the international school safety dashboard.
- Strengthens campus CCTV coverage monitoring for schools by pairing camera uptime with incident response time.
- Functions as a fire safety inspection compliance tracking dashboard that separates corrective actions from new deficiencies.
- Surfaces underperforming campuses early through the safety scorecard before an audit finds the gap.
- Improves accountability by tracking safety incident response time against the prior period.
- Flags entry points with weak visitor screening compliance before they become a security gap.
- Gives safety officers one consistent report to share with school boards and accreditation reviewers.
KPIs to Track in an International School Safety Dashboard
The following key KPIs can be tracked by using this dashboard:
- Emergency Drill Compliance Rate (%) - measures the share of scheduled drills completed on time, the core signal behind this emergency drill compliance rate tracking tool.
- CCTV Coverage Rate (%) - tracks the percentage of campus areas monitored by cameras, part of campus CCTV coverage monitoring for schools.
- Safety Incident Response Time (minutes) - measures how quickly safety teams respond once an incident is reported.
- Fire Safety Inspection Compliance Rate (%) - reports inspections passed without open deficiencies, the anchor metric for this fire safety inspection compliance tracking dashboard.
- Safety Audit Pass Rate (%) - measures overall audit performance against each campus's compliance target.
Frequently Asked Questions
1. What is included in an International School Safety Dashboard?
It includes emergency drill compliance, CCTV coverage, fire safety inspection results, safety audit performance, incident distribution by category, and visitor screening compliance. Filters for Academic Year/Term, Campus Location, Safety Category, and Grade Division let teams narrow the view to a specific site or incident type.
2. How often should schools update safety dashboard data?
Most schools refresh drill, inspection, and incident data at the end of each term, while CCTV coverage and visitor screening logs can be updated more frequently. Consistent update cycles keep campus comparisons accurate and audit-ready.
3. Can this dashboard compare multiple campuses at once?
Yes. The Campus Safety Scorecard and Campus Location filter let administrators compare drill compliance, CCTV coverage, fire inspection results, and open incidents across every campus in one view. It also supports safety incident distribution tracking for international schools, showing which incident categories are most common campus by campus.