
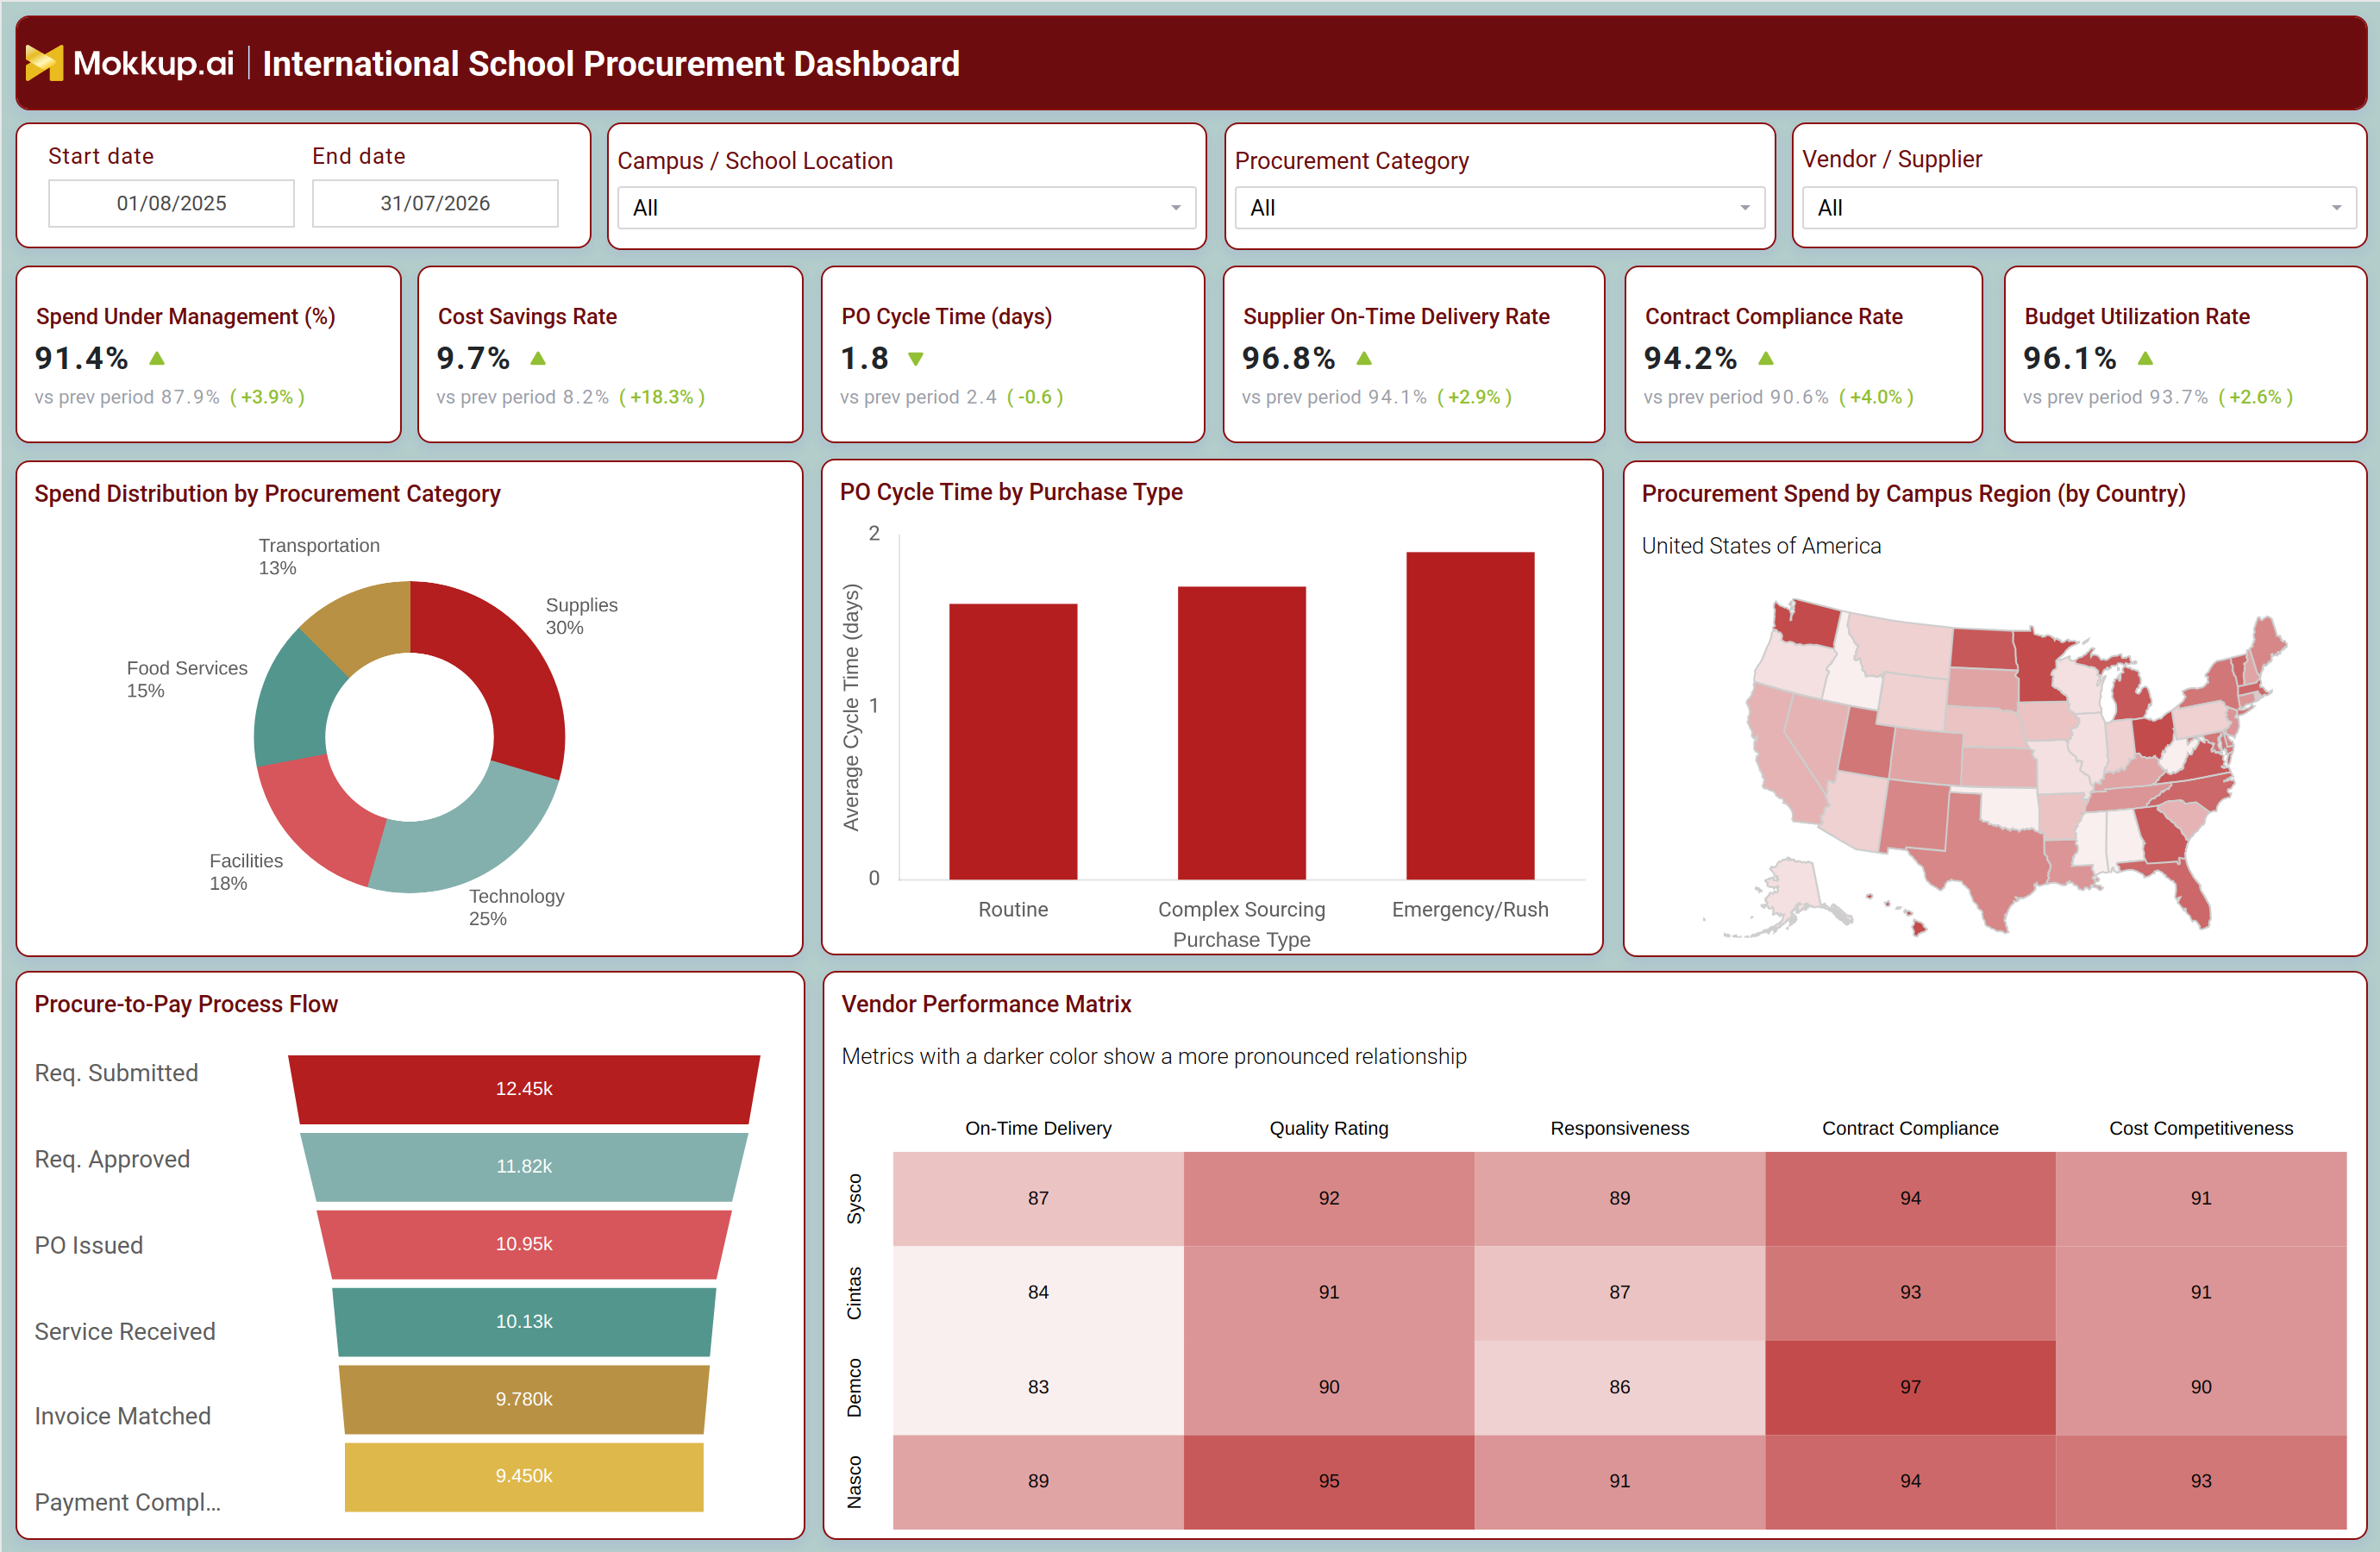
What is an International School Procurement Dashboard
The International School Procurement Dashboard gives finance and operations leaders at international school networks a single view of purchasing activity across campuses, vendors, and procurement categories. It consolidates spend, cycle time, and supplier performance data so procurement teams no longer have to piece together information from separate purchase order logs, vendor contracts, and campus-level spreadsheets. Built for institutions managing purchasing across supplies, technology, facilities, food services, and transportation, this international school procurement dashboard brings visibility to how funds move from requisition to payment. Procurement officers, business managers, and finance directors use it to keep up with spend under management tracking for schools, evaluate vendor reliability, and confirm that purchasing activity stays within approved budgets and contract terms across every campus location.
How to Create an International School Procurement Dashboard
You don't need to build your report from scratch—just start with a ready-to-use dashboard template from Mokkup. Add in your data and export it however you like. Here's how to do it:
1. Create or Log in to Your Mokkup Account
Start by signing up on Mokkup.ai using your email. If you already have an account, just log in, and you'll be good to go.
2. Choose and Customize Your Dashboard Template
Find the International School Procurement Dashboard template in the Templates section. Use the drag-and-drop editor to adjust KPIs, edit filters, or add elements based on your data.
3. Export to Your BI Tool
Once your dashboard wireframe is ready, use the BI Tool Export feature to send it directly to Power BI or Tableau for further analysis and enhancements. You can also download the dashboard as a PDF, PNG, or JPEG, embed it on a platform, or invite your team to collaborate.
Note: This is a Pro template. You'll need a Pro subscription on Mokkup to use and customize this dashboard wireframe. Upgrade anytime to unlock full access.
International School Procurement Dashboard Example
A business manager or procurement director opens the International School Procurement Dashboard at the start of a budget review to understand how purchasing is trending across the network. Before looking at any single vendor or category, they want to know whether overall spend is staying under control and whether campuses are following approved purchasing channels. The dashboard's date range and campus filters let them narrow the view to a specific term, location, or procurement category before concluding.
From there, procurement teams can identify which categories consume the largest share of the budget and whether spend is shifting toward higher-cost purchase types. By reviewing the procure-to-pay process flow monitoring tool, they can pinpoint where requisitions stall between approval, purchase order issuance, and invoice matching and flag steps that slow payment completion. Comparing PO cycle time tracking for school purchase orders across routine, complex sourcing, and emergency or rush categories helps planners decide whether urgent purchases are becoming too frequent and driving up costs. Looking at the vendor performance scorecard for school districts, buyers can compare suppliers on delivery reliability, quality, responsiveness, and cost competitiveness before renewing or renegotiating a contract. When contract compliance rate tracking for schools reveals a dip, procurement leads know to investigate whether a vendor is deviating from agreed terms or pricing.
Taken together, the dashboard helps procurement and finance leaders move from reactive purchasing to proactive vendor and budget management. Instead of waiting for a quarterly audit to uncover overspending or underperforming suppliers, teams can catch and correct issues as purchasing activity happens across every campus. The result is tighter budget control, stronger vendor accountability, and a purchasing process that stays aligned with institutional policy.
How to Analyze Data in an International School Procurement Dashboard
Here is how you can analyze data from this dashboard:
- Filter by Campus / School Location: Compare purchasing patterns and spending across different sites.
- Segment by Procurement Category: Identify categories where spend under management needs greater attention.
- Track PO Cycle Time: Monitor purchase order processing times by purchase type to identify delays in complex sourcing or emergency orders.
- Review the Procure-to-Pay Process Flow: Identify bottlenecks between requisition, approval, purchasing, and payment.
- Compare Vendor Performance: Use the vendor performance scorecard to evaluate suppliers before contract renewals.
- Monitor Contract Compliance: Compare vendor compliance rates with cost savings to confirm suppliers are meeting agreed terms.
- Use the Campus Region Map: Identify locations with slower supplier deliveries or higher concentrations of procurement spend.
Benefits of an International School Procurement Dashboard
The following are the benefits of using this dashboard:
- Centralizes Procurement KPIs: Brings procurement performance metrics from every campus into one international school procurement dashboard.
- Reduces Manual Reconciliation: Simplifies the reconciliation of purchase orders, invoices, and vendor contracts.
- Identifies Procure-to-Pay Bottlenecks: Highlights process delays before they affect payment timelines.
- Improves Vendor Accountability: Uses a consistent vendor performance scorecard to evaluate supplier performance.
- Supports Budget Discipline: Tracks spend under management to help finance teams monitor and control procurement costs.
- Supports Vendor Decisions: Combines contract compliance and cost data to help finance teams make informed vendor changes.
- Speeds Up Decision-Making: Provides filters for campus, procurement category, and vendor to quickly focus on relevant data.
KPIs to Track in an International School Procurement Dashboard
The following key KPIs can be tracked by using this dashboard:
- Spend Under Management (%): the share of total procurement spend that flows through approved purchasing channels and contracts
- Cost Savings Rate (%): the percentage of cost saved through negotiation, bulk purchasing, or contract renegotiation against budgeted spend
- PO Cycle Time (days): the average number of days from purchase order issuance to fulfillment
- Supplier On-Time Delivery Rate (%): the percentage of orders vendors deliver within the agreed timeframe
- Contract Compliance Rate (%): how closely vendor activity follows agreed contract terms and purchasing policy
- Budget Utilization Rate (%): how much of the allocated procurement budget has been spent against what was planned
Frequently Asked Questions
1. What is the International School Procurement Dashboard used for?
It tracks procurement spend, vendor performance, and purchase order cycle time across international school campuses. Procurement teams and finance leaders use this international school procurement dashboard to keep purchasing activity aligned with budget and contract terms.
2. How does the dashboard help control procurement costs?
It surfaces cost savings, budget utilization, and spend distribution by category so leaders can spot overspending early. Paired with vendor scorecards, it also helps teams negotiate better terms with underperforming suppliers.
3. Can the dashboard be customized for a specific school network?
Yes, the template can be customized in Mokkup by adding campus locations, procurement categories, and vendor lists specific to your network. Filters for date range, campus, category, and vendor make it adaptable to different reporting needs.