
What is an International School Operations Dashboard?
An international school operations dashboard brings the many moving parts of multi-campus school operations into one structured view. It consolidates data across academic year and term, campus or building, department, and cost center, so operations leaders can filter down to the exact segment under review without switching between spreadsheets. School administrators use this international school operations dashboard to move between campus operating budget allocation, facility condition, staffing, and transportation metrics without losing context. Because it draws on actual school data rather than static reports, the dashboard supports facilities, HR, transportation, and finance teams who each depend on a different slice of the same underlying numbers. Whether the priority is classroom utilization rate tracking, maintenance planning, or staffing efficiency, the dashboard gives every stakeholder a shared reference point for how the school system is performing across campuses and terms. Instead of waiting on a scheduled report cycle, teams can return to the same dashboard throughout the term to check whether a metric is drifting in the wrong direction and act before it becomes a larger operational problem.
How to Create an International School Operations Dashboard
You don't need to build your report from scratch; just start with a ready-to-use dashboard template from Mokkup. Add in your data and export it however you like. Here's how to do it:
1. Create or Log in to Your Mokkup Account
Start by signing up on Mokkup.ai using your email. If you already have an account, just log in, and you'll be good to go.
2. Choose and Customize Your Dashboard Template
Find the International School Operations Dashboard template in the Templates section. Use the drag-and-drop editor to adjust KPIs, edit filters, or add elements based on your data.
3. Export to Your BI Tool
Once your dashboard wireframe is ready, use the BI Tool Export feature to send it directly to Power BI or Tableau for further analysis and enhancements. You can also download the dashboard as a PDF, PNG, or JPEG, embed it on a platform, or invite your team to collaborate.
Note: This is a Pro template. You'll need a Pro subscription on Mokkup to use and customize this dashboard wireframe. Upgrade anytime to unlock full access.
International School Operations Dashboard Example
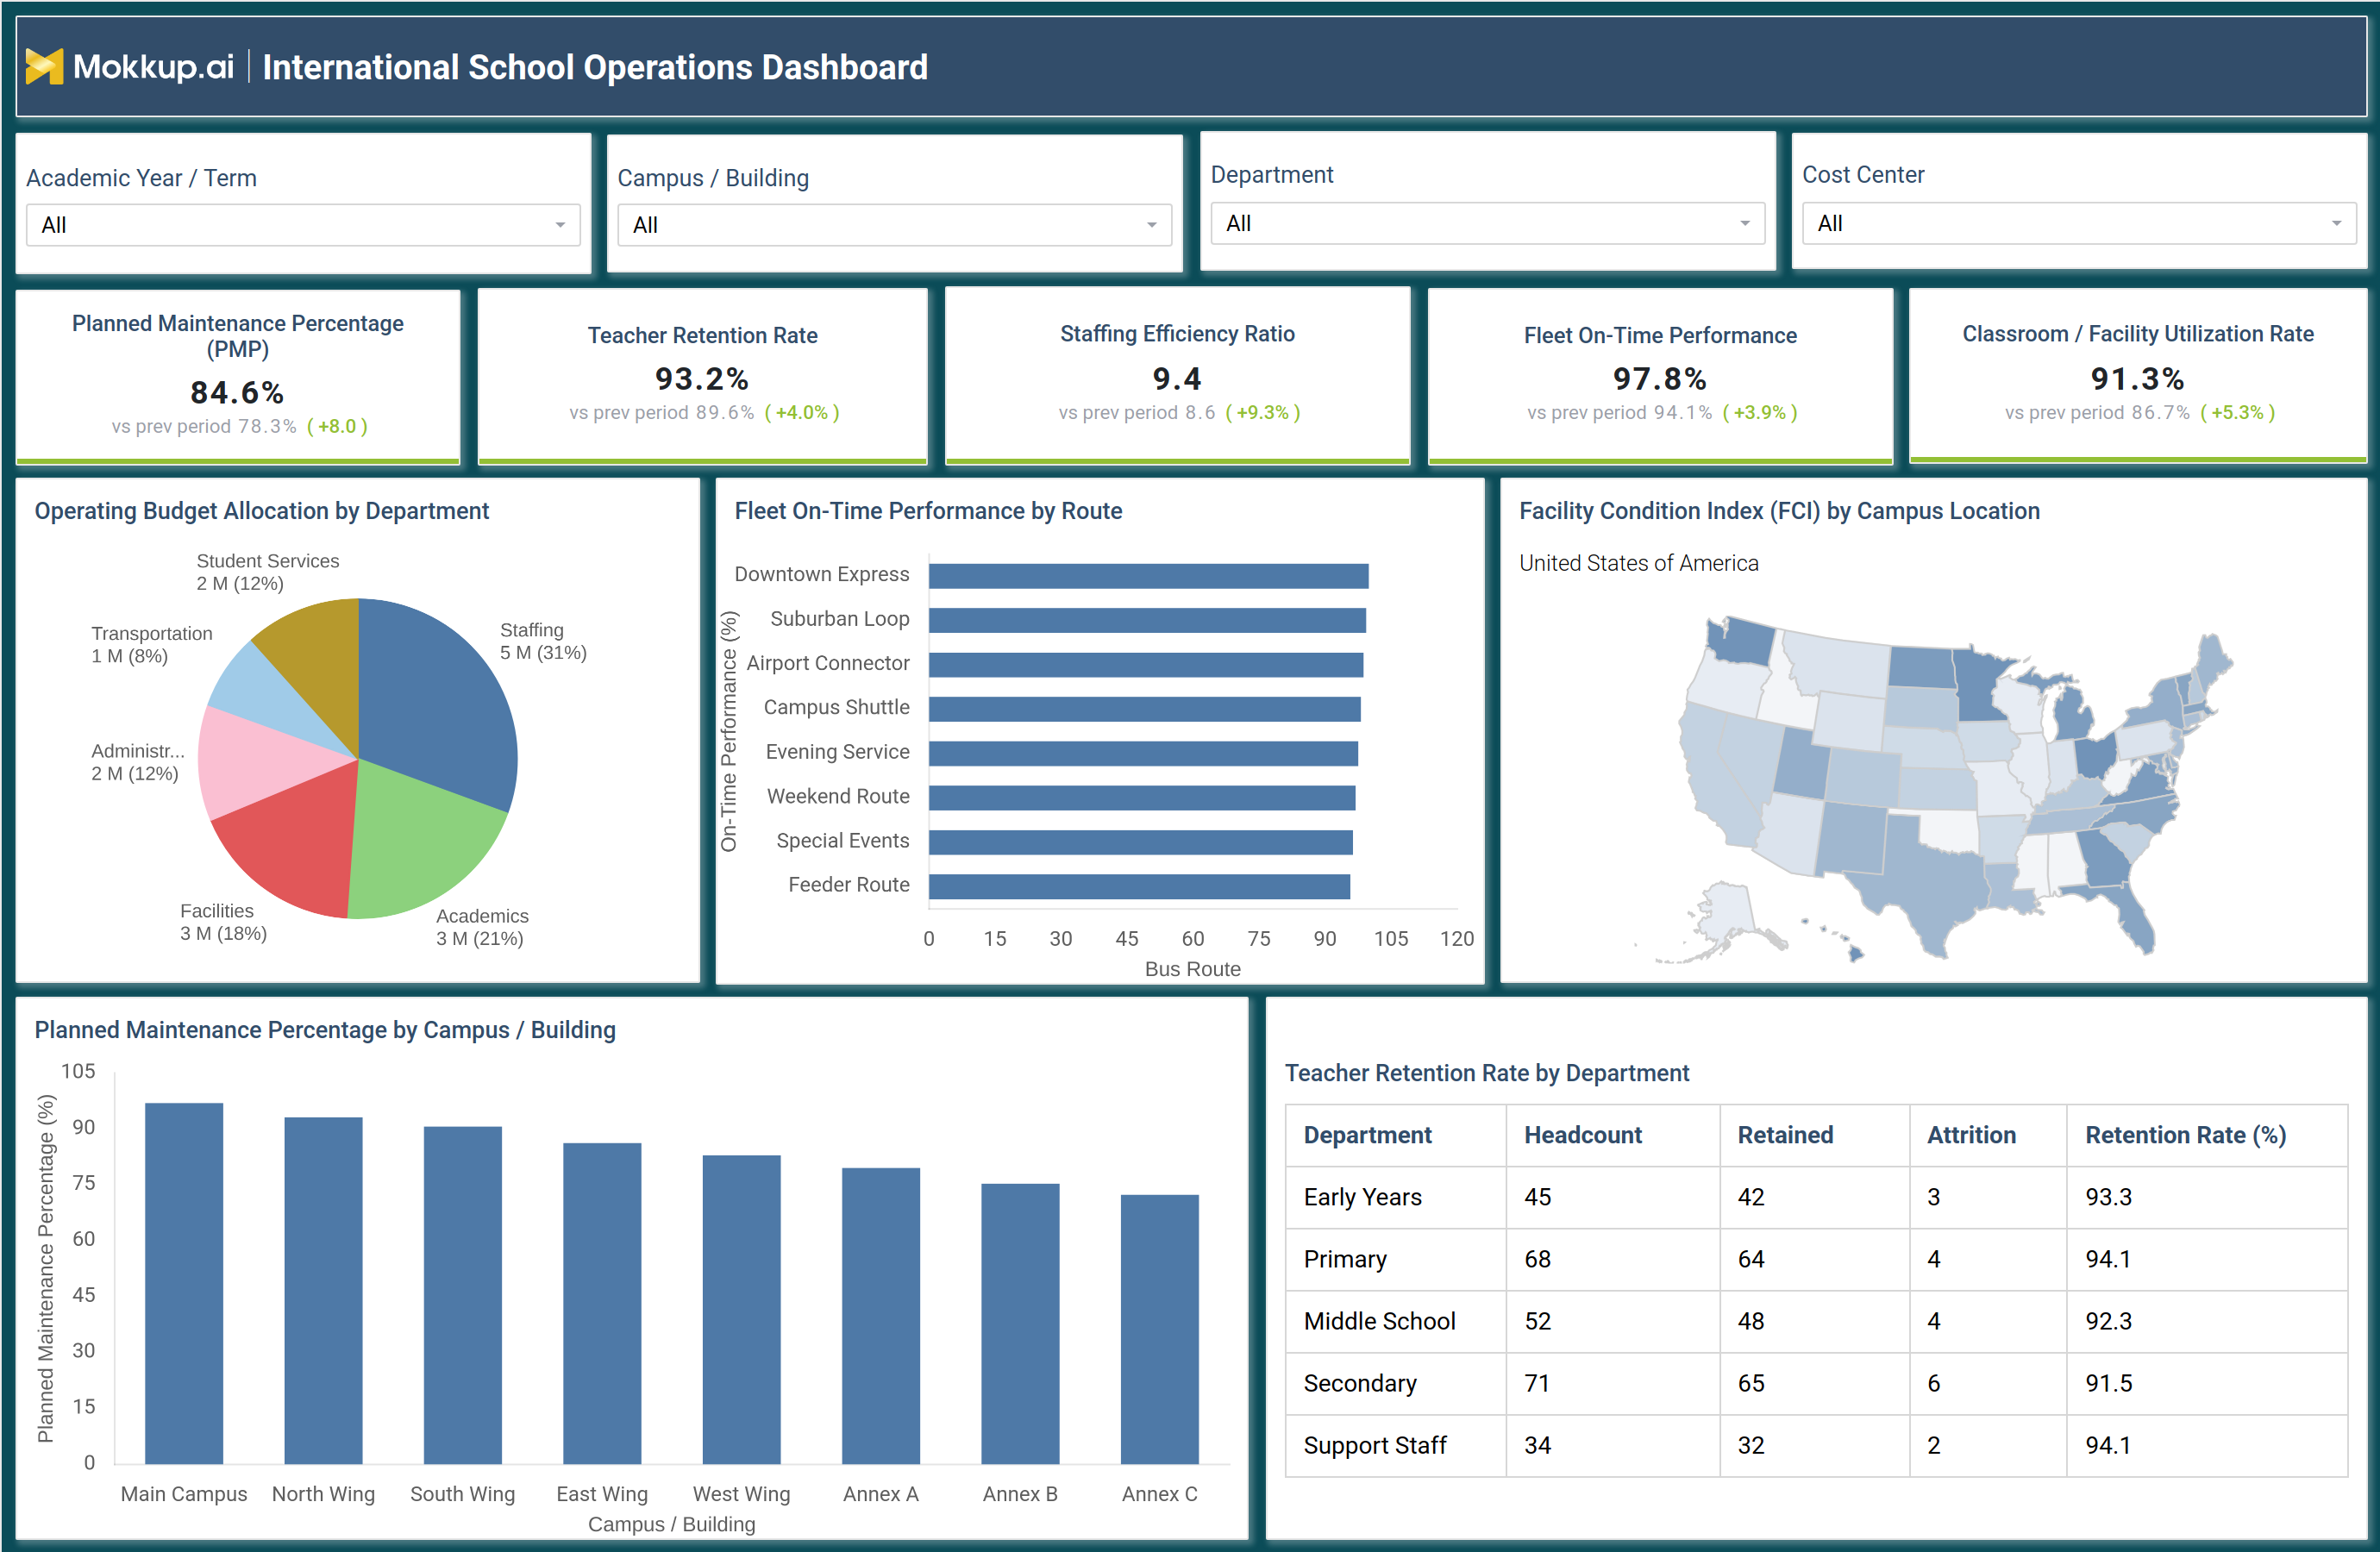
A school operations director typically opens this dashboard at the start of a term review to understand how campuses are trending against budget, staffing, and facility targets. Before reviewing any single metric, they narrow the view by academic year, campus, department, or cost center to focus on the area that needs attention. From there, the dashboard lets the director assess how the operating budget is distributed across departments and whether spending aligns with strategic priorities. Facilities teams can identify which campuses are falling behind on planned maintenance and prioritize repair schedules using this school facility maintenance dashboard view for cross-campus comparison.
Transportation coordinators can compare on-time performance across bus routes to flag routes needing schedule or staffing adjustments, drawing on school transportation fleet performance data route by route. HR leaders can review teacher retention rate dashboard breakdowns by department to spot where attrition is concentrated and plan retention initiatives accordingly. Academic planners can also compare classroom utilization rate tracking across buildings to decide where space is underused or overcrowded. Taken together, the dashboard moves school leadership from isolated departmental reporting to a coordinated view of operations, so decisions about budget, staffing, facilities, and transportation are made with the full picture in view instead of in silos.
How to Analyze Data in an International School Operations Dashboard
Here is how you can analyze data from this dashboard:
- Filter by Academic Year / Term, Campus / Building, Department, and Cost Center to isolate the exact segment under review
- Compare Planned Maintenance Percentage by Campus / Building to identify which locations need attention first
- Use the school facility maintenance dashboard view to prioritize repair and maintenance schedules across buildings
- Review Fleet On-Time Performance by Route to catch underperforming bus routes early
- Cross-check Teacher Retention Rate by Department in the table to see where attrition is concentrated
- Examine Operating Budget Allocation by Department to confirm spending matches strategic priorities
- Reference the Facility Condition Index by Campus Location map to spot regional facility risk patterns
- Track Classroom / Facility Utilization Rate alongside enrollment trends to plan space needs ahead of term changes
Benefits of an International School Operations Dashboard
The following are the benefits of using this dashboard:
- Centralizes campus operating budget allocation, staffing, facilities, and transportation data in one view
- Improves school transportation fleet performance visibility across every bus route
- Reduces time spent consolidating reports from separate campus and department systems
- Surfaces facility maintenance gaps before they turn into costly repairs
- Supports HR planning with department-level teacher retention rate dashboard visibility
- Makes classroom utilization rate tracking simple across campuses and buildings
- Gives leadership a shared reference point for cross-campus decision making
KPIs to Track in an International School Operations Dashboard
The following key KPIs can be tracked by using this dashboard:
- Planned Maintenance Percentage (PMP): share of maintenance work completed on a planned schedule rather than as reactive repairs
- Teacher Retention Rate: percentage of teaching staff retained over a period, tracked by department in the teacher retention rate dashboard
- Staffing Efficiency Ratio: measure of staffing levels relative to operational demand across departments
- Fleet On-Time Performance: percentage of bus routes arriving within scheduled time windows
- Classroom / Facility Utilization Rate: proportion of available classroom and facility space actively in use
Frequently Asked Questions
1. What does this dashboard track for school operations teams?
This international school operations dashboard tracks facility maintenance, teacher retention, staffing efficiency, transportation performance, and budget allocation across campuses, terms, and departments. Filters let users narrow the view to a specific campus, department, or cost center.
2. Who uses this dashboard within a school system?
Operations directors, facilities managers, HR leaders, transportation coordinators, and finance teams use it to monitor their respective areas. Because it consolidates data across departments, it also supports leadership reviews that span multiple functions and campuses at once.
3. Can this dashboard be customized for a specific school network?
Yes, the Mokkup template can be customized with your own filters, KPIs, and branding before export. Once configured, it can be exported to Power BI or Tableau, or downloaded as PDF, PNG, or JPEG.