
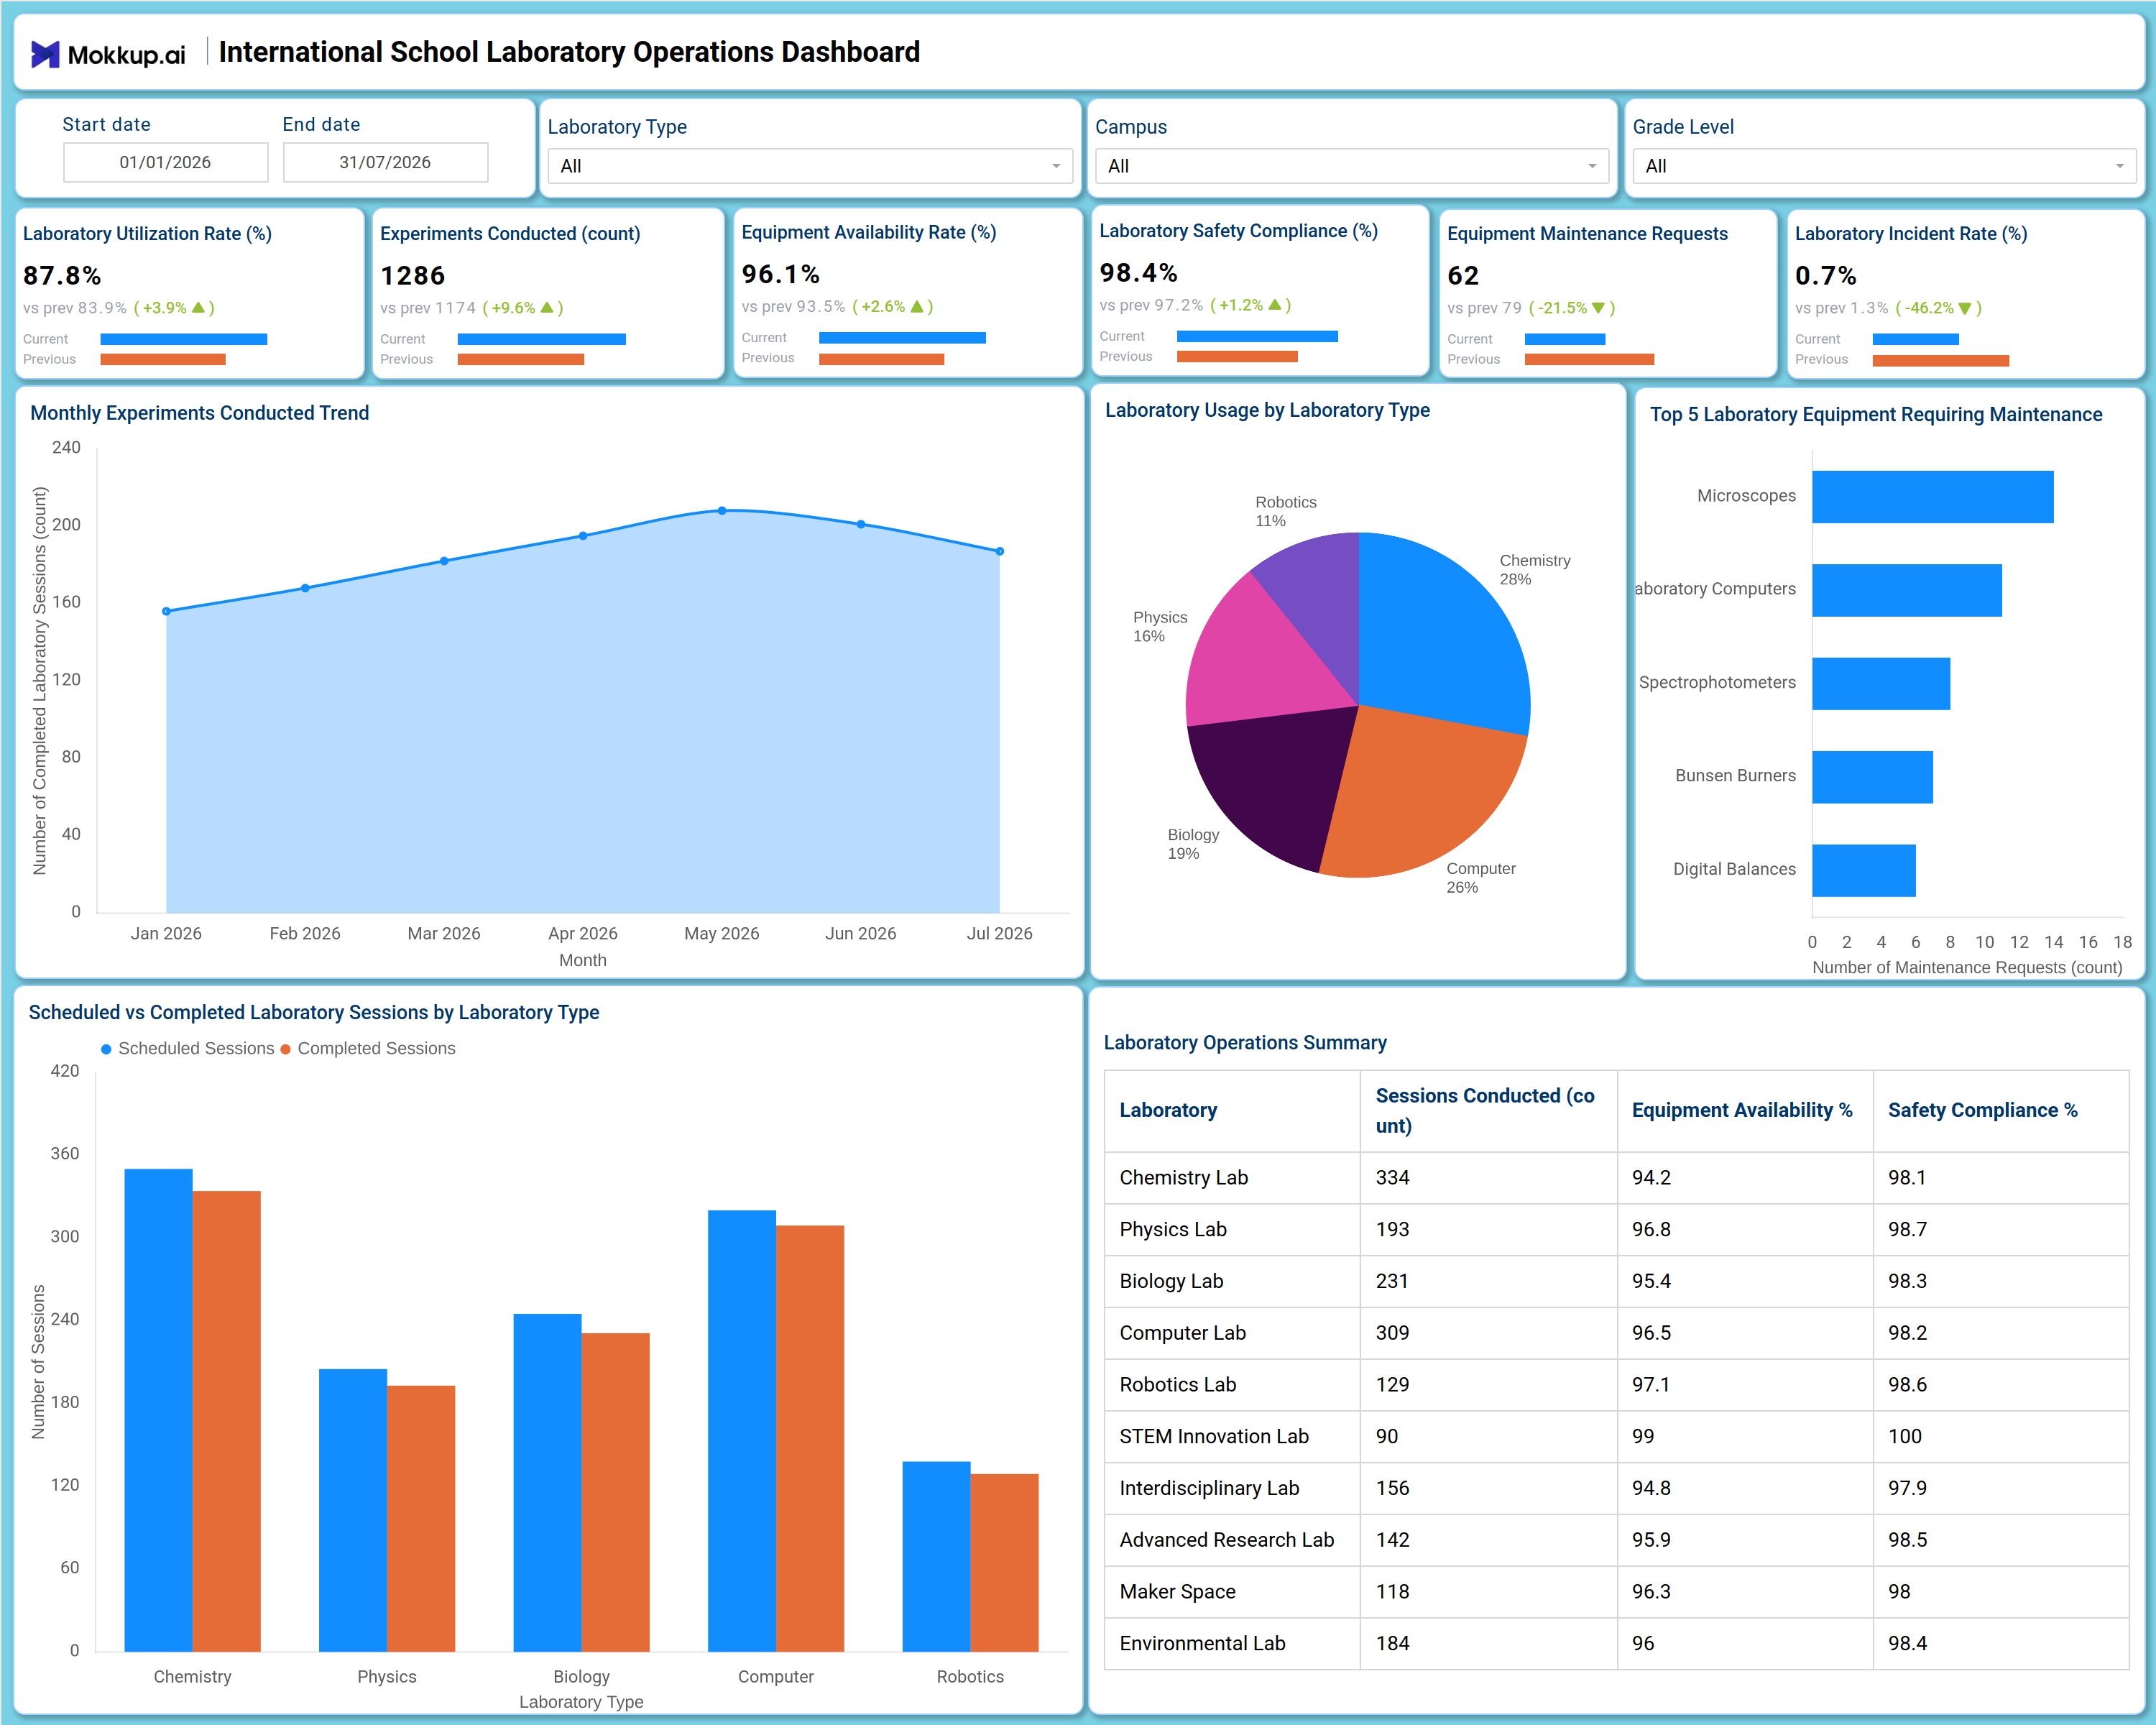
What is an International School Laboratory Operations Dashboard
The International School Laboratory Operations Dashboard is a single-screen analytics template designed for lab coordinators, science department heads, and academic operations teams managing chemistry, physics, biology, computer, and robotics laboratories across an international school campus. This international school laboratory operations dashboard brings utilization, safety, and equipment data together in one place, replacing scattered lab logbooks and maintenance spreadsheets with a single structured view. Teams can filter by laboratory type, campus, or grade level to see how sessions, experiments, and maintenance requests are trending across the term. It functions as a laboratory usage-by-type dashboard template that helps operations staff plan scheduling, staffing, and safety priorities with clarity.
How to Create an International School Laboratory Operations Dashboard
You don't need to build your report from scratch-just start with a ready-to-use dashboard template from Mokkup. Add your data and export it as needed. Here's how to do it:
1. Create or Log in to Your Mokkup Account
Start by signing up on Mokkup.ai using your email. If you already have an account, just log in, and you'll be good to go.
2. Choose and Customize Your Dashboard Template
Find the International School Laboratory Operations Dashboard template in the Templates section. Use the drag-and-drop editor to adjust KPIs, edit filters, or add elements based on your data.
3. Export to Your BI Tool
Once your dashboard wireframe is ready, use the BI Tool Export feature to send it directly to Power BI or Tableau for further analysis and enhancements. You can also download the dashboard as a PDF, PNG, or JPEG, embed it on a platform, or invite your team to collaborate.
Note: This is a Pro template. You'll need a Pro subscription on Mokkup to use and customize this dashboard wireframe. Upgrade anytime to unlock full access.
International School Laboratory Operations Dashboard Example
A lab coordinator at an international school typically opens this dashboard at the start of a review period to understand how laboratory capacity is being used across departments and whether usage matches what was scheduled. Much of that opening question depends on what this laboratory incident rate tracking dashboard shows for safety events, since a single unresolved incident can affect scheduling for an entire department. From the single screen, the coordinator applies the laboratory type, campus, and grade level filters to isolate performance for a specific department, then compares scheduled sessions against completed sessions to spot labs that are underused or overbooked.
This laboratory utilization rate tracking dashboard also lets the team review how experiments conducted have trended month over month, so a dip or spike can be tied back to a specific term or event rather than treated as noise. Alongside utilization, the coordinator reviews which laboratory type is generating the most demand and whether that demand is shifting between chemistry, biology, physics, computer, and robotics spaces. Equipment health is assessed at the same time: by reviewing which instruments are generating the most maintenance requests, the operations team can prioritize repairs and replacements before shortages start affecting scheduled sessions, turning this into a practical equipment maintenance request tracking tool rather than a static report.
The overall outcome is that lab coordinators and academic operations leaders stop reacting to equipment failures and safety incidents after they happen and instead plan around usage patterns, maintenance needs, and compliance trends as they emerge. Department heads can walk into budget or staffing conversations with a clear picture of which labs need additional capacity, which equipment categories need replacement funding, and where safety performance is holding steady, all without compiling separate reports from each laboratory.
How to Analyze Data in an International School Laboratory Operations Dashboard
Here is how you can analyze data from this dashboard:
- Use the Start date and End date filters to narrow the dashboard to a specific term or reporting period.
- Filter by Laboratory Type to compare utilization and safety performance between chemistry, physics, biology, computer, and robotics labs.
- Apply the Campus filter to isolate laboratory performance for a specific school site before comparing across locations.
- Review the Monthly Experiments Conducted Trend to see whether lab activity is rising or falling ahead of exam or project season.
- Compare Scheduled vs Completed Laboratory Sessions by Laboratory Type to spot labs with recurring cancellations or overbooking.
- Check the Laboratory Usage by Laboratory Type pie chart to see which departments drive the highest share of lab demand.
- Monitor the Top 5 Laboratory Equipment Requiring Maintenance chart as an equipment maintenance requests tracking tool for prioritizing repairs.
- Scan the Laboratory Operations Summary table to compare sessions conducted, equipment availability, and safety compliance lab by lab.
Benefits of an International School Laboratory Operations Dashboard
The following are the benefits of using this dashboard:
- Centralizes utilization, safety, and equipment data for every laboratory type in one international school laboratory operations dashboard.
- Functions as a laboratory safety compliance monitoring dashboard that tracks compliance and incident trends together on one screen.
- Reduces manual reporting by replacing separate lab logbooks and maintenance spreadsheets with pre-built KPI tiles and charts.
- Gives science department heads a shared view of session scheduling accuracy across every laboratory type.
- Highlights equipment categories generating the most maintenance requests so budget decisions rely on documented demand.
- Helps academic operations teams justify staffing and space decisions using a laboratory usage by type dashboard template.
- Pairs incident and compliance metrics for a laboratory incident rate tracking dashboard view that supports faster risk response.
- Surfaces lab-by-lab performance through the Laboratory Operations Summary table for governance and audit reviews.
KPIs to Track in an International School Laboratory Operations Dashboard
The following key KPIs can be tracked by using this dashboard:
- Laboratory Utilization Rate (%): Anchors this laboratory utilization rate tracking dashboard by measuring the share of scheduled capacity actually used across all lab types.
- Experiments Conducted (count): Tracks the total number of experiments completed across all laboratory types during the selected period.
- Equipment Availability Rate (%): Quantifies how much laboratory equipment is operational and ready for use, flagging capacity gaps caused by breakdowns.
- Laboratory Safety Compliance (%): Central to this laboratory safety compliance monitoring dashboard, this KPI evaluates adherence to safety protocols across labs, supporting audit readiness.
- Equipment Maintenance Requests (count): Tracks how many maintenance tickets are logged for laboratory instruments, a leading indicator for budget planning.
- Laboratory Incident Rate (%): Anchors this laboratory incident rate tracking dashboard by measuring safety events per session, helping teams catch rising risk early.
Frequently Asked Questions
1. What schools benefit most from the International School Laboratory Operations Dashboard?
International schools running active STEM programs across chemistry, physics, biology, computer, and robotics labs get the most value from this international school laboratory operations dashboard. Lab coordinators, science department heads, and academic operations teams use it as a laboratory safety compliance monitoring dashboard to align scheduling, safety, and equipment budgets in one view.
2. Can this dashboard track equipment that needs maintenance?
Yes. The Top 5 Laboratory Equipment Requiring Maintenance chart acts as an equipment maintenance requests tracking tool, ranking instruments such as microscopes, laboratory computers, and spectrophotometers by request volume so operations teams know where to focus repair budgets.
3. Is this dashboard useful for comparing laboratory usage across departments?
Yes. As a laboratory usage by type dashboard template, it breaks down session share and scheduled-versus-completed sessions by chemistry, physics, biology, computer, and robotics labs, making cross-department comparisons straightforward.