
What is a Boarding School Laboratory Operations Dashboard
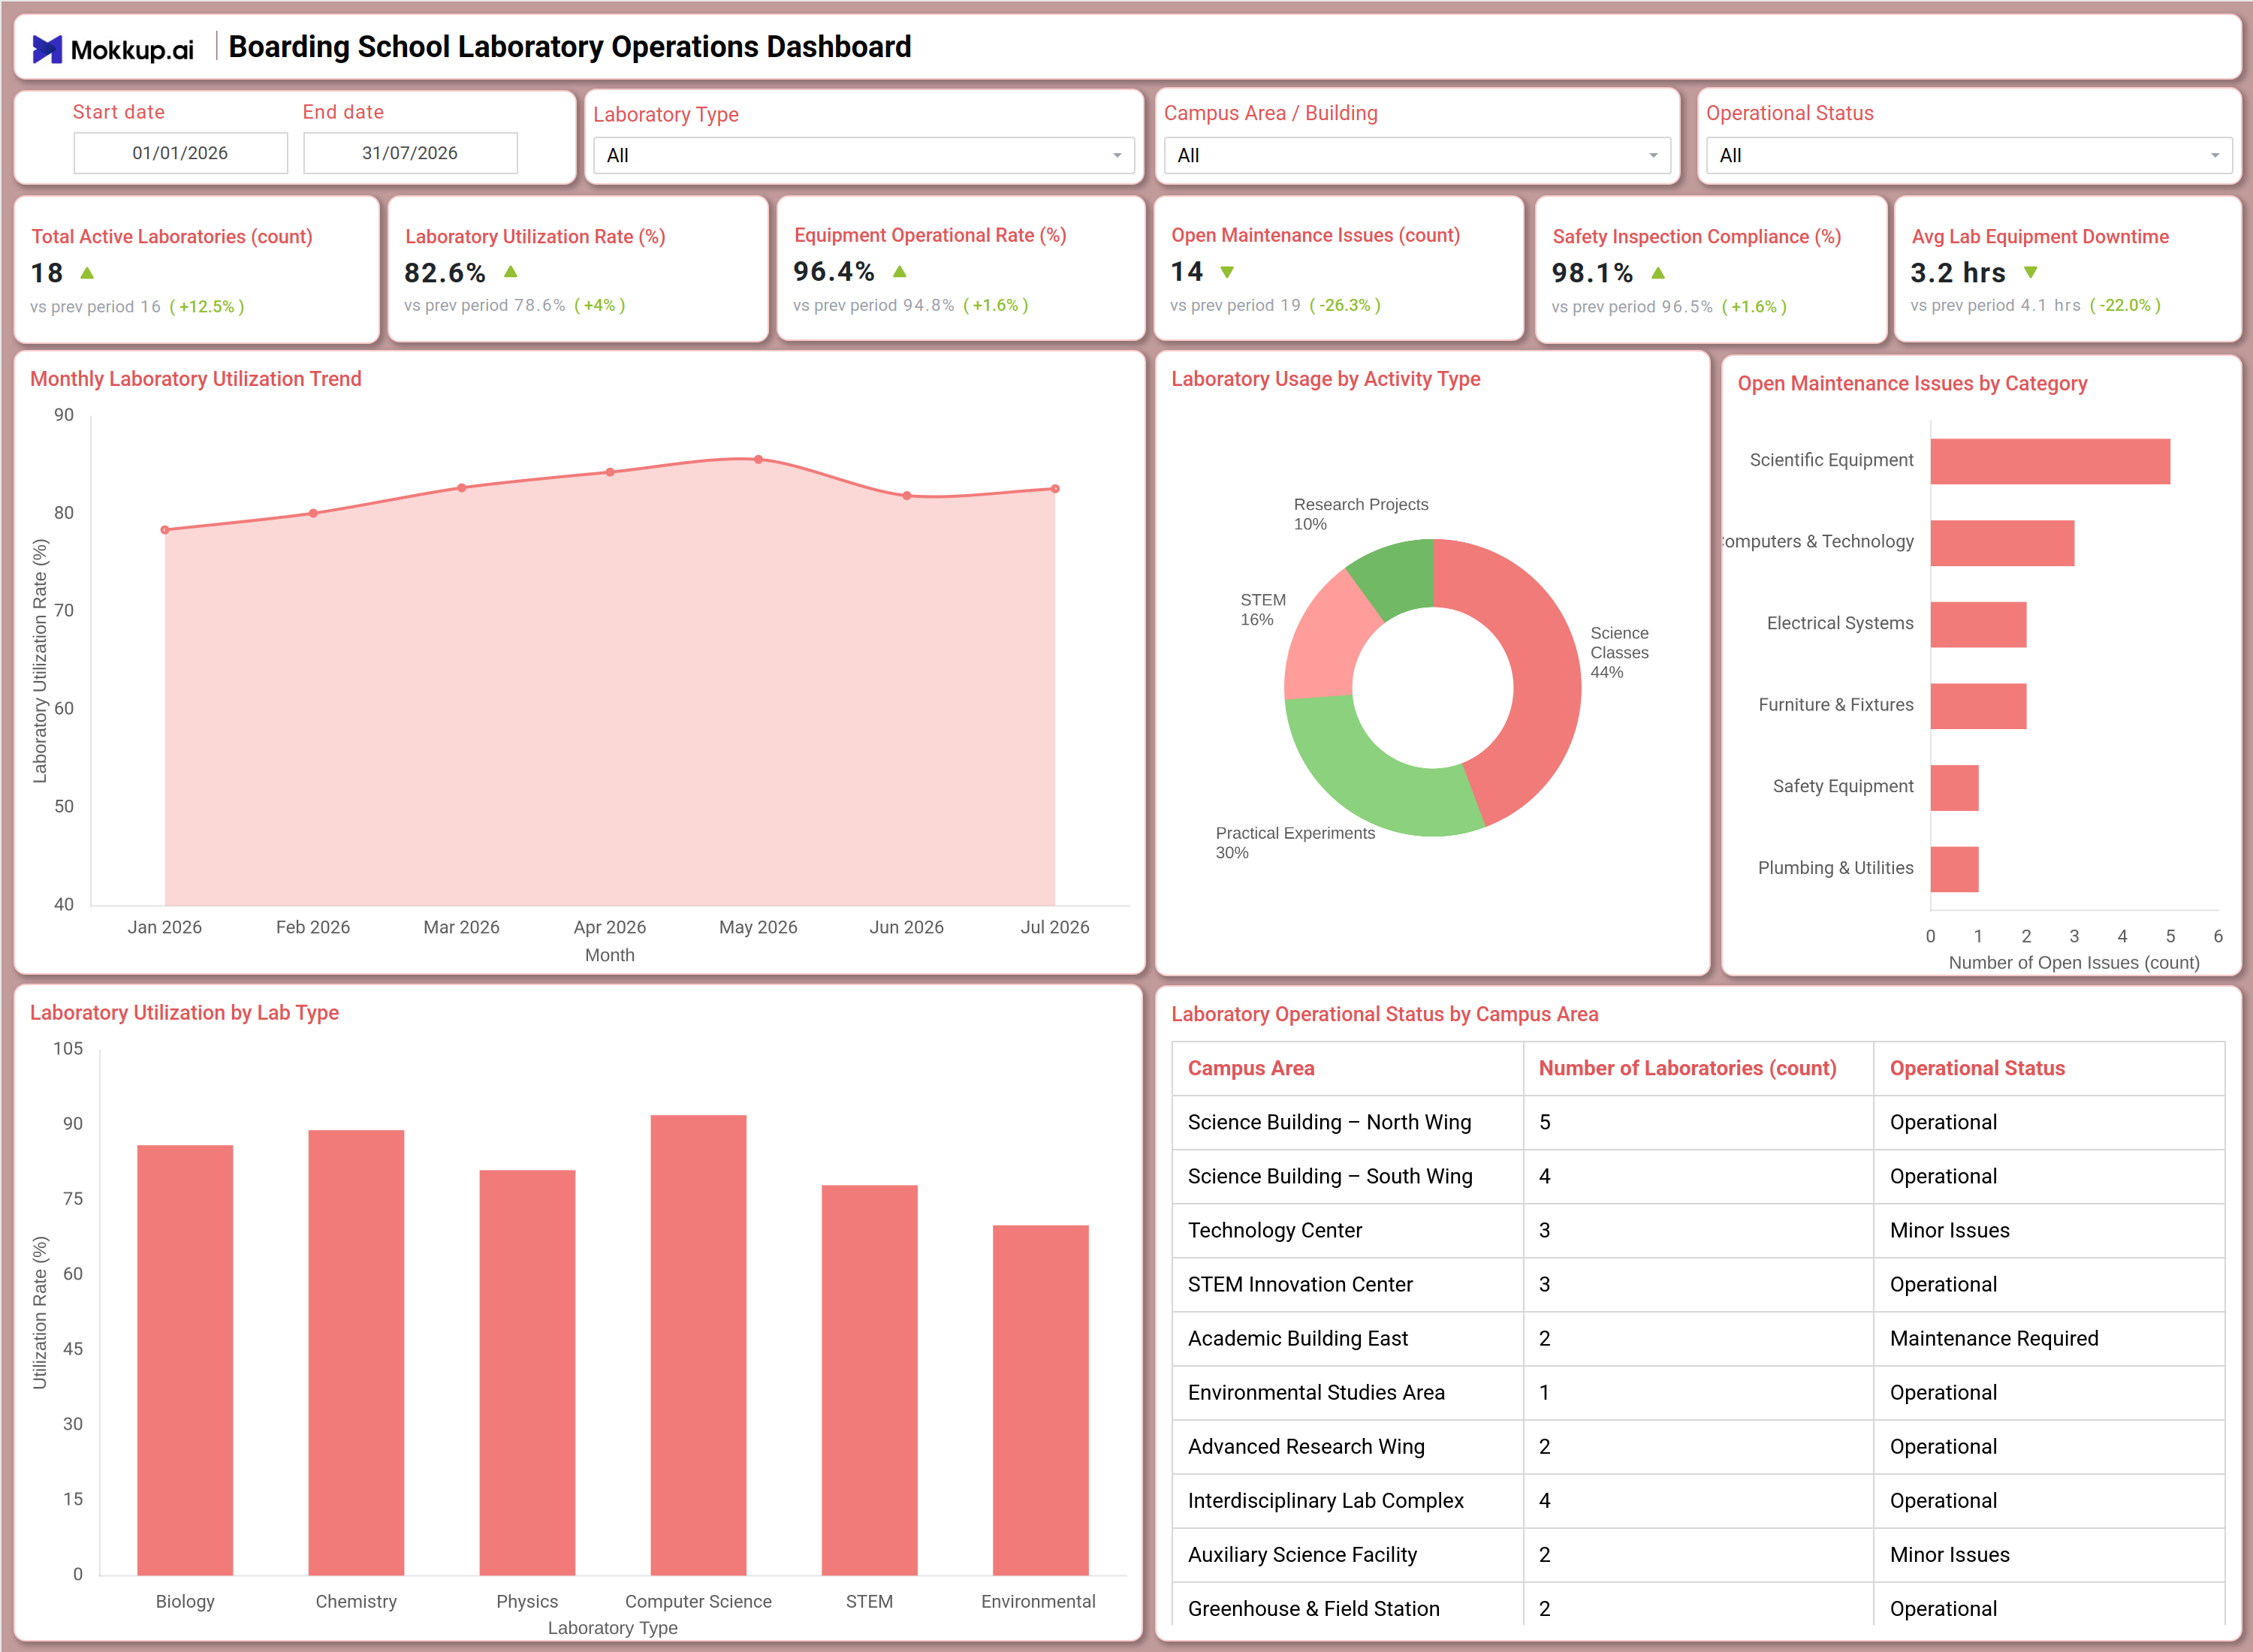
The Boarding School Laboratory Operations Dashboard is a single-screen laboratory operations dashboard built for science department heads, facility administrators, and boarding school academic teams who need a clear view of how laboratory spaces are used and maintained across campus. It consolidates Total Active Laboratories, Laboratory Utilization Rate, Equipment Operational Rate, Open Maintenance Issues, Safety Inspection Compliance, and Avg Lab Equipment Downtime into one connected view. Filters for Laboratory Type, Campus Area / Building, and Operational Status let teams narrow the view down to a single wing, lab category, or maintenance status. Rather than pulling utilization figures and safety records from separate systems, this boarding school laboratory operations dashboard brings lab usage, equipment health, and maintenance tracking into a single reference point administrators can revisit each term.
How to Create a Boarding School Laboratory Operations Dashboard
You don't need to build your report from scratch; just start with a ready-to-use dashboard template from Mokkup. Add in your data and export it however you like. Here's how to do it:
1. Create or Log in to Your Mokkup Account
Start by signing up on Mokkup.ai using your email. If you already have an account, just log in, and you'll be good to go.
2. Choose and Customize Your Dashboard Template
Find the Boarding School Laboratory Operations Dashboard template in the Templates section. Use the drag-and-drop editor to adjust KPIs, edit filters, or add elements based on your data.
3. Export to Your BI Tool
Once your dashboard wireframe is ready, use the BI Tool Export feature to send it directly to Power BI or Tableau for further analysis and enhancements. You can also download the dashboard as a PDF, PNG, or JPEG, embed it on a platform, or invite your team to collaborate.
Note: This is a Pro template. You'll need a Pro subscription on Mokkup to use and customize this dashboard wireframe. Upgrade anytime to unlock full access.
Boarding School Laboratory Operations Dashboard Example
A facilities coordinator or science department head typically opens this dashboard at the start of a term to check whether lab capacity matches the number of classes and research projects scheduled across campus. Before reviewing any single lab or wing, they apply the Start/End date, Laboratory Type, Campus Area / Building, and Operational Status filters to narrow the view down to the area they are responsible for.
From there, the dashboard supports several connected decisions. Reviewing the Monthly Laboratory Utilization Trend lets planners see whether lab usage is climbing or leveling off across the term, informing whether additional lab time should be scheduled or freed up for other classes. A laboratory usage by activity type analysis of the donut chart shows how lab hours are split between science classes, practical experiments, STEM work, and research projects, which guides how future lab bookings are prioritized. Comparing utilization across lab types, including biology, chemistry, physics, computer science, STEM, and environmental, helps administrators identify which specialty labs are running near capacity and which have room for additional sessions.
On the maintenance side, reviewing open issues by category lets facilities teams decide which type of repair, such as scientific equipment, computers and technology, electrical systems, furniture and fixtures, safety equipment, or plumbing and utilities, needs attention first, while the campus area table shows exactly which buildings carry a Minor Issues or Maintenance Required status so requests reach the right team. Altogether, this laboratory utilization rate tracking dashboard gives boarding school administrators a single place to balance lab scheduling against equipment readiness, helping them keep science facilities running safely and productively across campus.
How to Analyze Data in a Boarding School Laboratory Operations Dashboard
Here is how you can analyze data from this dashboard:
- Use the Laboratory Type filter to isolate utilization and maintenance patterns for a single category such as Chemistry or STEM.
- Filter by Campus Area / Building to review lab performance for one wing or facility at a time.
- Apply the Operational Status filter to focus only on laboratories flagged as Minor Issues or Maintenance Required.
- Monitor the Monthly Laboratory Utilization Trend to catch seasonal dips or spikes in lab usage before they affect scheduling.
- Review the Laboratory Usage by Activity Type donut chart for a laboratory usage by activity type analysis of how lab hours split between classes, experiments, STEM, and research work.
- Use the Laboratory Utilization by Lab Type bar chart to identify which lab categories are nearing full capacity.
- Rely on this open maintenance issues tracking tool to prioritize repairs by equipment or system category before backlogs grow.
- Cross-reference the Laboratory Operational Status by Campus Area table to route maintenance requests to the correct building.
Benefits of a Boarding School Laboratory Operations Dashboard
The following are the benefits of using this dashboard:
- Centralizes laboratory utilization, safety compliance, and maintenance data for the entire boarding school laboratory operations dashboard in one structured template.
- Turns this open maintenance issues tracking tool into a single view of the repair backlog across every category of lab equipment and infrastructure.
- Functions as a safety inspection compliance monitoring dashboard that keeps administrators alert to compliance dips before they affect accreditation reviews.
- Provides a laboratory usage by activity type analysis that shows how lab hours split between coursework, practical experiments, and research work.
- Reduces manual compilation of term-end facility reports with pre-built KPI tiles and chart layouts.
- Enables campus area-level comparison of lab operational status to guide maintenance staffing and budget decisions.
- Gives facilities teams and science department heads a shared view of lab readiness across every building on campus.
KPIs to Track in a Boarding School Laboratory Operations Dashboard
The following key KPIs can be tracked by using this dashboard:
- Total Active Laboratories (count): tracks how many labs are currently operational across campus, a baseline for capacity planning.
- Laboratory Utilization Rate (%): the central measure behind this laboratory utilization rate tracking dashboard, showing how intensively lab spaces are used relative to available capacity.
- Equipment Operational Rate (%): quantifies the share of lab equipment that is functional and ready for use at any given time.
- Open Maintenance Issues (count): measures the current repair backlog across all laboratories, key to prioritizing facilities staff time.
- Safety Inspection Compliance (%): the anchor metric of this safety inspection compliance monitoring dashboard, tracking how consistently labs pass required safety checks.
- Avg Lab Equipment Downtime (hrs): the core metric behind this lab equipment downtime tracking dashboard, showing how many hours equipment sits out of service and where repair turnaround needs to improve.
Frequently Asked Questions
1. What industries benefit most from this Boarding School Laboratory Operations Dashboard?
Boarding schools, science departments, and campus facilities teams get the most value from this dashboard. It also suits STEM-focused programs that manage multiple specialty labs across several buildings.
2. Can this dashboard track equipment downtime alongside safety compliance?
Yes, this lab equipment downtime tracking dashboard tracks Avg Lab Equipment Downtime and Equipment Operational Rate alongside Safety Inspection Compliance, so teams see equipment health and safety standing together. This helps administrators judge whether a maintenance issue is also a safety risk.
3. Is this dashboard suitable for tracking maintenance across multiple campus buildings?
Yes. The Campus Area / Building filter and the Laboratory Operational Status by Campus Area table let facilities teams compare operational status across every science building, technology center, and research wing on campus.