
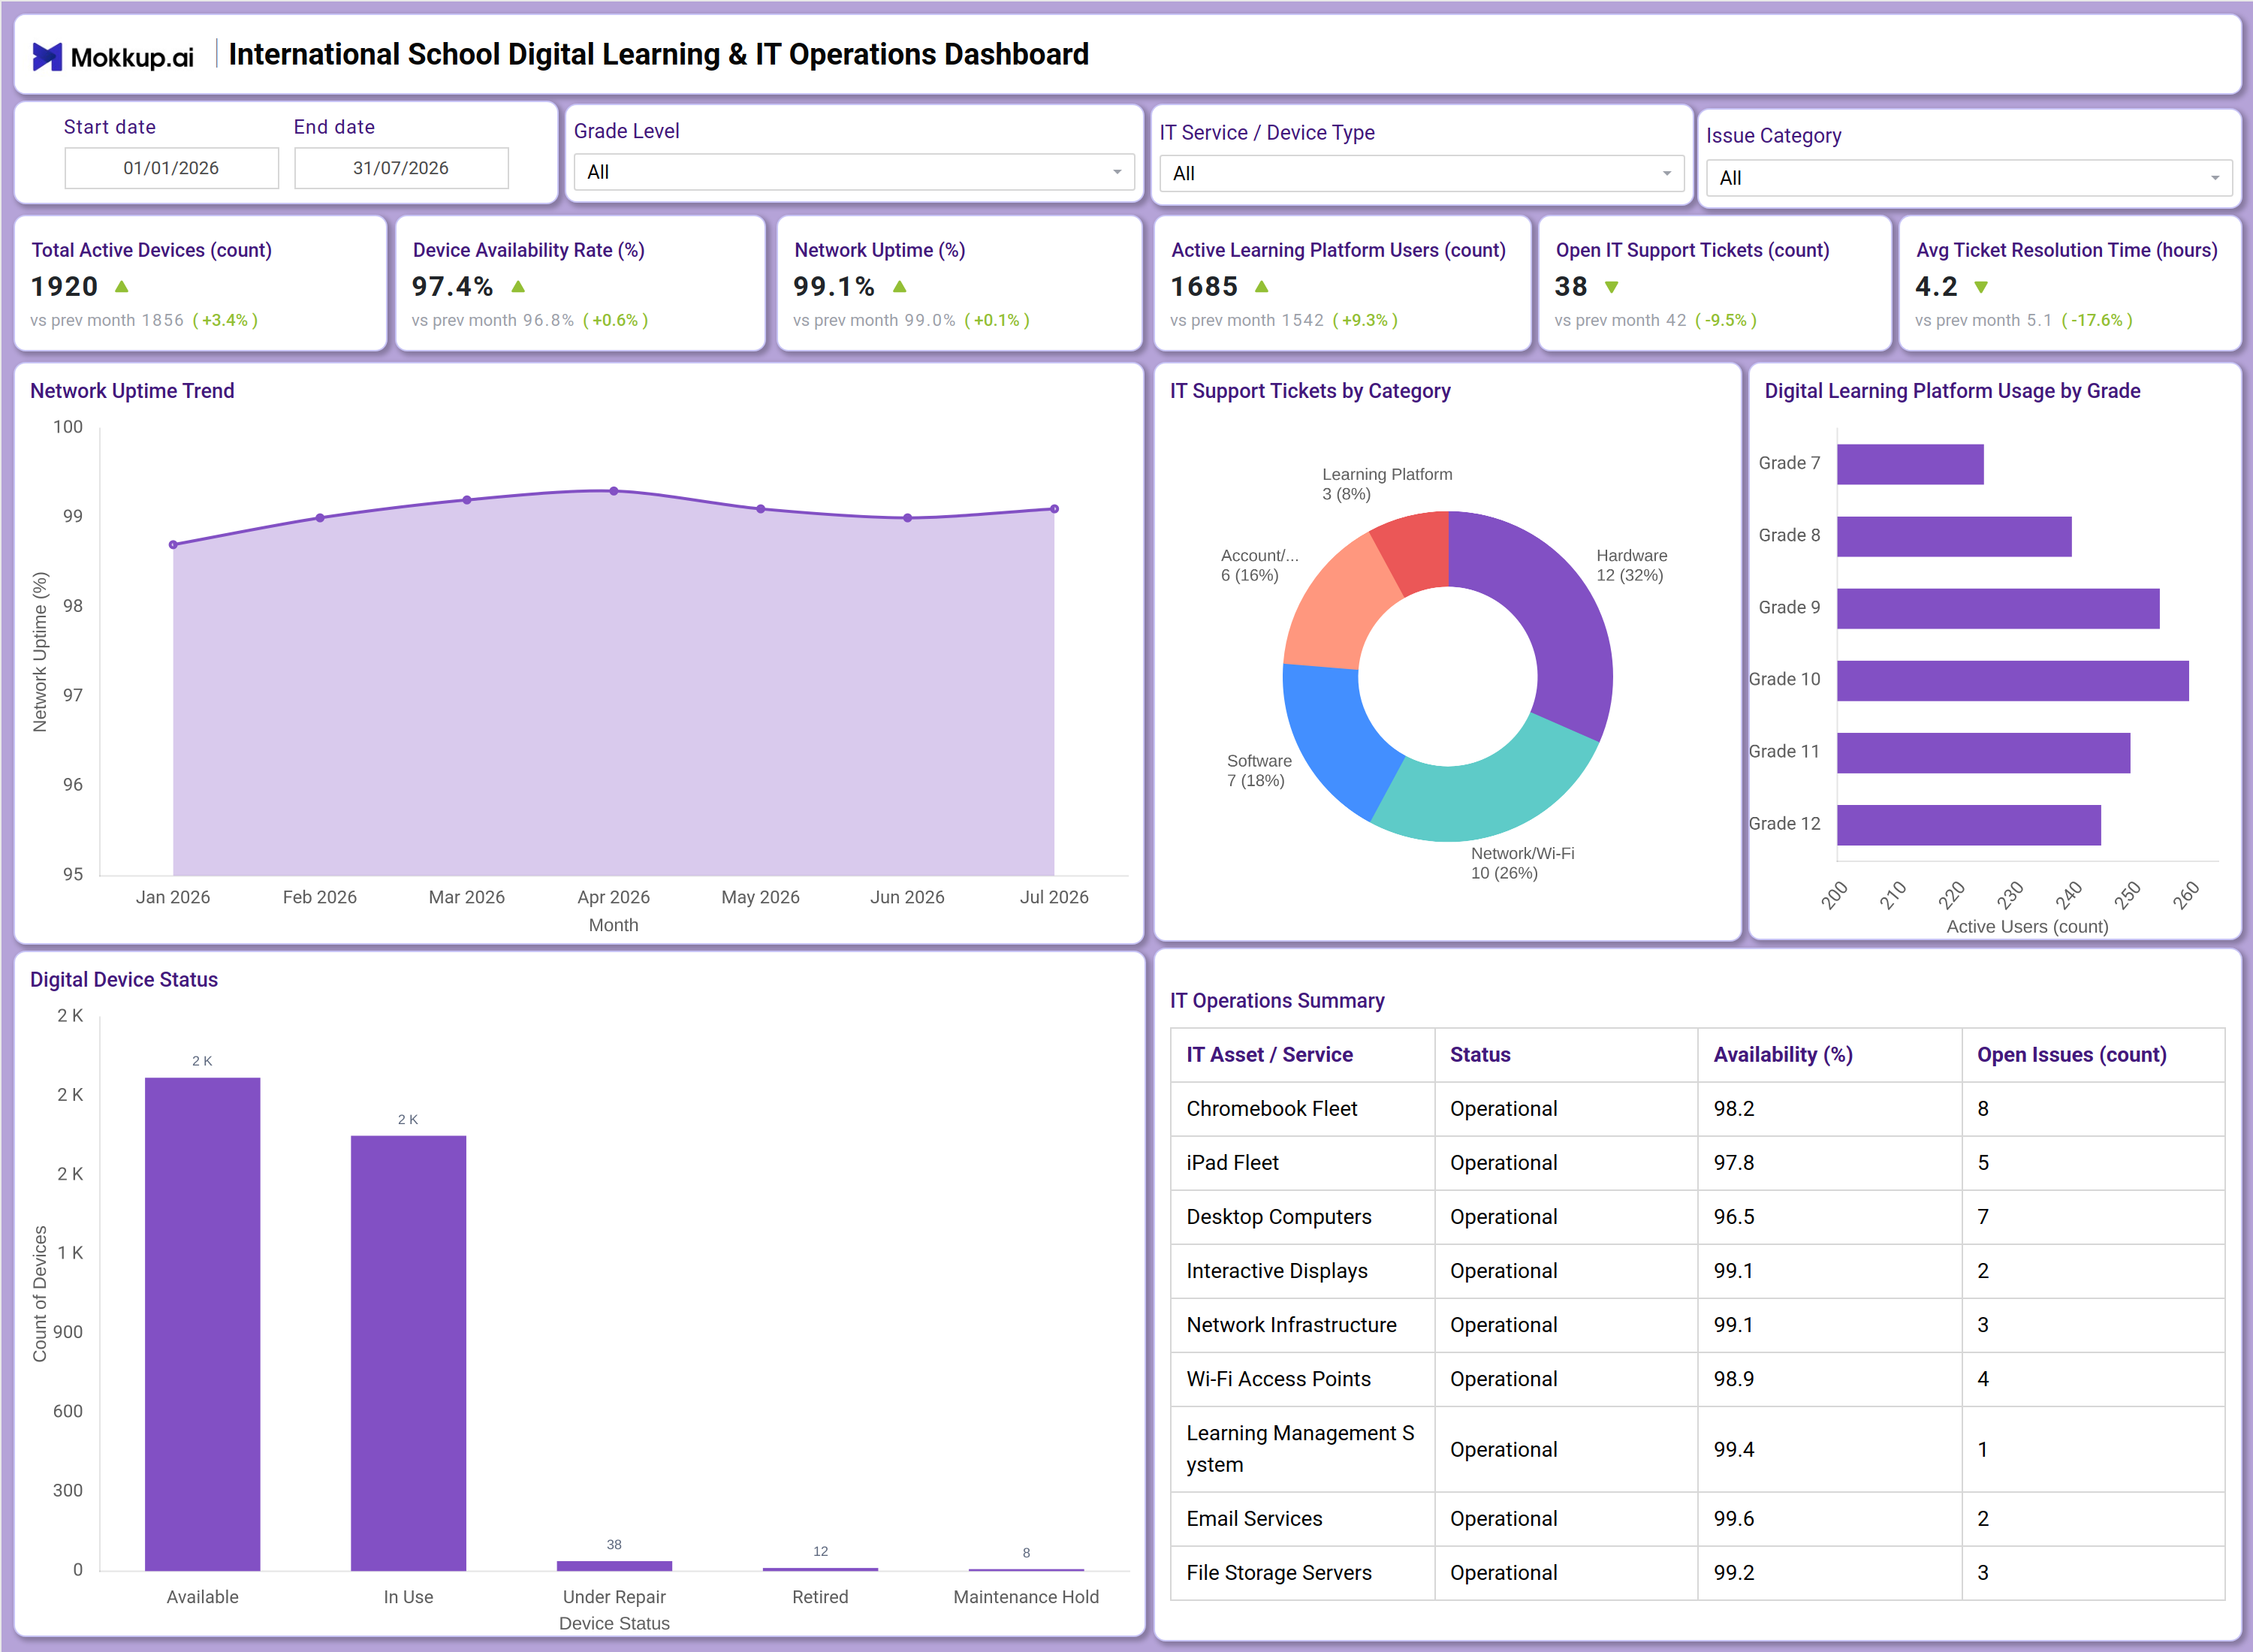
What is an International School Digital Learning & IT Operations Dashboard?
The International School Digital Learning & IT Operations Dashboard gives IT administrators and school technology teams a single view of device performance, network reliability, and platform adoption across a campus. Built as an international school digital learning dashboard, it consolidates device inventory, network uptime, and support ticket data so IT leads can catch issues before they disrupt classrooms. Technology directors and IT support staff use this school IT operations dashboard template to track how digital infrastructure holds up across grade levels and device fleets, including a device availability rate tracking dashboard view that flags dips before they affect instruction. Instead of switching between helpdesk, inventory, and network monitoring tools, the dashboard brings device status, ticket categories, and platform engagement into one place.
How to Create an International School Digital Learning & IT Operations Dashboard
You don't need to build your report from scratch; just start with a ready-to-use dashboard template from Mokkup. Add in your data and export it however you like. Here's how to do it:
1. Create or Log in to Your Mokkup Account
Start by signing up on Mokkup.ai using your email. If you already have an account, just log in, and you'll be good to go.
2. Choose and Customize Your Dashboard Template
Find the International School Digital Learning & IT Operations Dashboard template in the Templates section. Use the drag-and-drop editor to adjust KPIs, edit filters, or add elements based on your data.
3. Export to Your BI Tool
Once your dashboard wireframe is ready, use the BI Tool Export feature to send it directly to Power BI or Tableau for further analysis and enhancements. You can also download the dashboard as a PDF, PNG, or JPEG, embed it on a platform, or invite your team to collaborate.
Note: This is a Pro template. You'll need a Pro subscription on Mokkup to use and customize this dashboard wireframe. Upgrade anytime to unlock full access.
International School Digital Learning & IT Operations Dashboard Example
A school IT director typically opens this dashboard at the start of the week to check whether campus technology is holding up before staff and students log in. Using the Grade Level, IT Service/Device Type, and Issue Category filters, they narrow the view to a single grade, one device fleet, or a category of support request needing closer attention. The question driving this review is simple: is anything about to break, and where should support attention go first? From there, the director reviews whether device availability is holding steady or slipping, and whether network stability is strong enough for uninterrupted virtual instruction. When ticket volume in a specific area climbs, they examine how issues break down by category to determine whether hardware, network, software, or account problems are driving the increase, then route technician time accordingly.
Comparing digital learning platform usage tracking across grade levels also helps identify which grades are engaging less with the learning management system, prompting a conversation with those teachers instead of a blanket rollout of new training. When device status shifts, such as more devices moving into repair or maintenance hold, the team decides whether to redeploy retired stock or expedite replacements. Altogether, the dashboard helps school IT teams shift from reactive firefighting to planned maintenance, prioritizing the fleets and grade levels that need attention before small issues become classroom disruptions. It also gives principals and academic leads a shared view of how reliable the school's digital learning environment really is.
How to Analyze Data in an International School Digital Learning & IT Operations Dashboard
Here is how you can analyze data from this dashboard:
- Use the Grade Level filter to isolate digital learning and device metrics for a specific grade.
- Use the IT Service / Device Type filter to focus on one fleet, such as Chromebooks or interactive displays.
- Filter by Issue Category for IT support tickets by category tracking across hardware, network, software, account, or learning platform issues.
- Monitor the Network Uptime Trend chart with this network uptime monitoring dashboard tool to detect stability dips before they affect virtual classrooms.
- Review the IT Support Tickets by Category donut to see which issue type is generating the highest ticket volume.
- Compare the Digital Learning Platform Usage by Grade chart to spot grades with lower platform adoption.
- Track the Digital Device Status chart to see how devices split across available, in use, under repair, retired, and maintenance hold.
- Use the IT Operations Summary table to compare availability and open issues across every IT asset and service in one view.
Benefits of an International School Digital Learning & IT Operations Dashboard
The following are the benefits of using this dashboard:
- Centralizes device inventory, network status, and support tickets into one IT operations view.
- Functions as a network uptime monitoring dashboard tool so IT teams catch instability early.
- Enables IT support tickets by category tracking to prioritize hardware, network, software, and account issues.
- Reduces manual reporting by pairing KPI tiles with pre-built device and ticket trend charts.
- Surfaces the IT Operations Summary table for a side-by-side view of availability and open issues by asset.
- Works as a device availability rate tracking dashboard for procurement teams planning fleet replacements.
- Gives IT directors and school leadership a shared view of this international school digital learning dashboard's reliability.
KPIs to Track in an International School Digital Learning & IT Operations Dashboard
The following key KPIs can be tracked by using this dashboard:
- Total Active Devices (count): Measures how many devices, including Chromebooks and iPads, are deployed and tracked across the school network.
- Device Availability Rate (%): A device availability rate tracking dashboard metric showing the share of the fleet ready for use versus down for repair or retired.
- Network Uptime (%): Tracks how consistently the school network stays online, central to digital learning platform usage tracking during class hours.
- Active Learning Platform Users (count): Counts students and staff actively engaging with the learning management system, signaling adoption by grade.
- Open IT Support Tickets (count): Shows the current backlog of unresolved technology issues IT staff need to address.
- Avg Ticket Resolution Time (hours): Measures how quickly the IT team closes out support tickets once logged.
- IT Asset Availability (%): Found in the IT Operations Summary table, this per-service figure breaks availability down by asset to reveal where a campus-wide average masks a struggling system.
Frequently Asked Questions
1. What industries benefit most from this International School Digital Learning & IT Operations Dashboard?
International schools and multi-campus networks benefit most, since IT directors, technology coordinators, and academic leads rely on the same device and network data.
2. Can this dashboard track IT support tickets by category?
Yes. The IT Support Tickets by Category donut and Issue Category filter support IT support tickets by category tracking across hardware, network, software, account, and learning platform issues.
3. Is this dashboard suitable for IT budget planning?
Yes. As a school IT operations dashboard template, it separates ticket volume from per-asset availability so budget conversations focus on the right fleets.
4. How does the Network Uptime Trend chart work?
It plots uptime percentage by month, functioning as a network uptime monitoring dashboard tool that makes slow degradation easy to spot before it becomes an outage.
5. What does Active Learning Platform Users measure?
It counts students and staff logged into the learning management system, a core figure in digital learning platform usage tracking used to gauge adoption by grade.